HISTORY & MATHEMATICS: Trends and Cycles – 2014 ISBN 978-5-7057-4223-3
Abstract
The escape from the ‘Malthusian trap’ is shown to tend to generate in a rather systematic way quite serious political upheavals. Some demographic structural mechanisms that generate such upheavals have been analyzed, which has made it possible to develop a mathematical model of the respective processes.
The forecast of political instability in Sub-Saharan African countries in 2015–2050 produced on the basis of this model is presented.
Keywords: modernization, instability, Malthusian trap, mathematical modeling, youth bulge, urbanization, Africa, demographic dynamics, demographic transition, political dynamics, political demography. – This research has been supported by the Russian Science Foundation (Project No 14-11-00634)
Malthusian trap as a factor of political instability
What is that trap which we mention in the title of this article (and at whose escape we claim another trap to be detected)? It is the so-called ‘Malthusian trap’. The Malthusian trap[2] is a rather typical for pre-industrial societies situation when the growth of output (as it is accompanied by a faster demographic growth) does not lead in the long-range perspective to the increase in per capita output and the improvement of living conditions of the majority of population that remains close to the bare survival level (see, e.g., Malthus 1798, 1978 [1798]; Artzrouni and Komlos 1985; Steinmann and Komlos 1988; Komlos and Artzrouni 1990; Steinmann, Prskawetz, and Feichtinger 1998; Wood 1998; Kögel and Prskawetz 2001; Grinin, Korotayev, and Malkov 2008; Grinin and Korotayev 2009; Grinin et al. 2009; Grinin 2010).
In complex pre-industrial societies the Malthusian trap was one of the main generators of state breakdowns (see, e.g., Korotayev and Khaltourina 2006; Korotayev, Malkov, and Khaltourina 2006b; Chu and Lee 1994; Nefedov 2004; Turchin 2003, 2005a, 2005b; Turchin and Korotayev 2006; Turchin and Nefedov 2009; Usher 1989; Grinin and Korotayev 2009; Grinin, Korotayev, and Malkov 2008; Grinin et al. 2009; Grinin 2007; Korotayev 2006; Korotayev, Komorova, and Khaltourina 2007; Kulpin 1990; Malkov 2002, 2003, 2004; S. Malkov and А. Malkov 2000; S. Malkov, Kovalyov, and А. Malkov 2000; Malkov et al. 2002; Malkov, Selunskaya, and Sergeyev 2005; Malkov and Sergeyev 2002, 2004а, 2004b; Mugruzin 1986, 1994; Nefedov 1999–2010; Nefedov and Turchin 2007; Turchin 2007; van Kessel-Hagesteijn 2009).
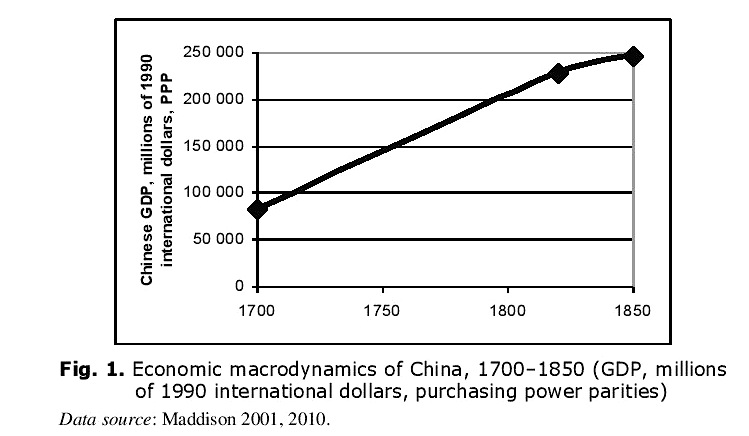
A typical example is provided by the last (Qing) of the ‘secular’ (see Korotayev, Malkov, and Khaltourina 2006b; Turchin and Nefedov 2009) cycles of Chinese political-demographic dynamics. In 1700–1850 China managed to achieve rather impressive economic results (due to, say, introduction of some New World crops [first of all, maize and sweet potatoes], development of new varieties of previously known cultivated plants, agricultural labor intensification, land reclamation, etc. [Ho 1955; 1959: 173–174, 180, 185–189; Lee 1982; Bray 1984: 452, 601; Perkins 1969: 39–40; Dikarev 1991: 69–70; Fairbank 1992: 169; Lavely and Wong 1998: 725–726; Lee and Wang 1999: 37–40; Mote 1999: 750, 942; Nefedov 2000a: 17; Myers and Wang 2002: 599, 634–636; Rowe 2002: 479; Zelin 2002: 216–218; van Kessel-Hagesteijn 2009]). As a result of these innovations the carrying capacity of land during this cycle was raised to a radically new level, which also resulted in a rather significant growth of the Chinese GDP.

Fig. 1. Economic macrodynamics of China, 1700–1850 (GDP, millions of 1990 international dollars, purchasing power parities) Data source: Maddison 2001, 2010.
Thus, according to Maddison’s (2001, 2010) estimations, between 1700 and 1850 the GDP of China grew almost threefold (see Fig. 1).
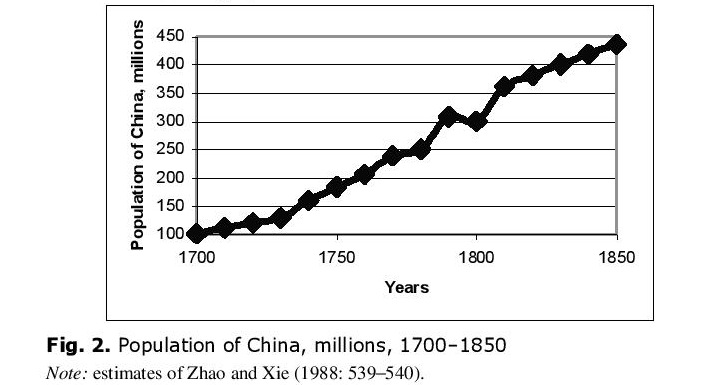
However, the Chinese population grew during the same period of time more than fourfold (see Fig. 2).
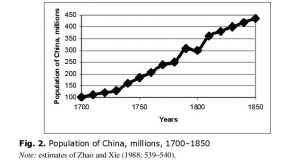
Fig. 2. Population of China, millions, 1700–1850 Note: estimates of Zhao and Xie (1988: 539–540).
As a result, by 1850 we observe a rather significant decline of per capita GDP (see Fig. 3).
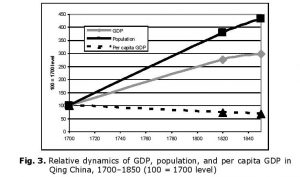
Fig. 3. Relative dynamics of GDP, population, and per capita GDP in Qing China, 1700–1850 (100 = 1700 level)
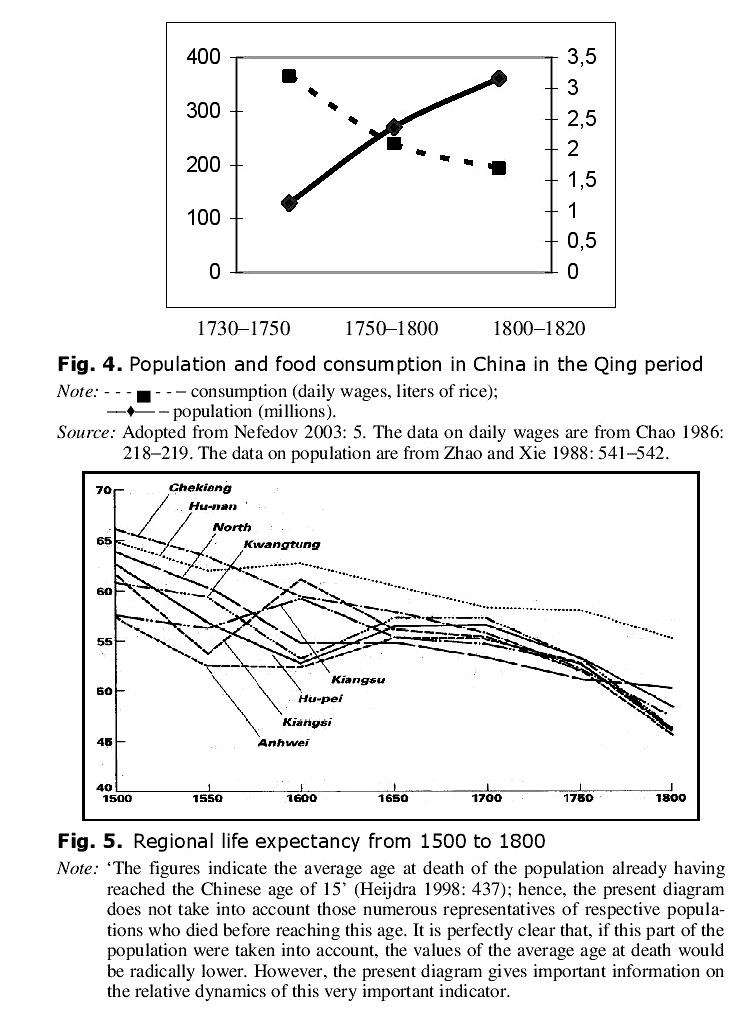
The decline in the level of life of the majority of Chinese (mainly resultant just from the point that the Chinese population growth rates exceeded the rates of economic growth) can be traced on the basis 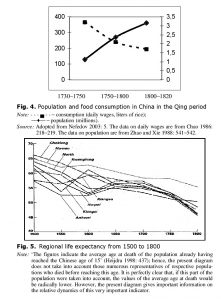 of a significant number of independent data series. For example, Fig. 4 reflects the dynamics of average real daily wages of unskilled workers in this country. As we see, quite predictably, as a result of population growth rates being higher than GDP growth rates, the average real daily wages (that were not high at all even at the beginning of the respective period [see Korotayev and Khaltourina 2006 for comparisons]) dropped to the level of bare physiological survival by the end of the period in question.
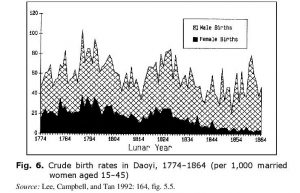
Population growth rate being higher than the growth rate of GDP, Qing China experienced a catastrophic decline in the level of life of the majority of Chinese population, which is confirmed by the data of Chinese genealogies (chia-p’u) (see Fig. 5).
It worth stressing that in this case we are dealing with a really mass source (for example, Fig. 5 was compiled on the basis of several hundred thousand Chinese genealogies). It also appears necessary to take into account the point that representatives of really low class strata had rather poor chances to get into the abovementioned genealogies. Thus, the data in Fig. 5 reflects the dynamics of the level of life not of the real low class strata, but rather of the Qing ‘middle classes’, whose members were represented in these genealogies on a really mass scale.
As we see, at the beginning of the Qing cycle the average age at death among the middle strata of the Chinese population was rather high – 55–60 years; however, by the end of the period in question the value of the respective indicator falls to explicitly low values (around 45 years), whereas it seems appropriate to emphasize that we are not dealing here with the lowest strata of the Chinese population. Another impressive feature is a striking synchronicity of the decline of the average age at death in various regions of China in the course of the Qing sociodemographic cycle.
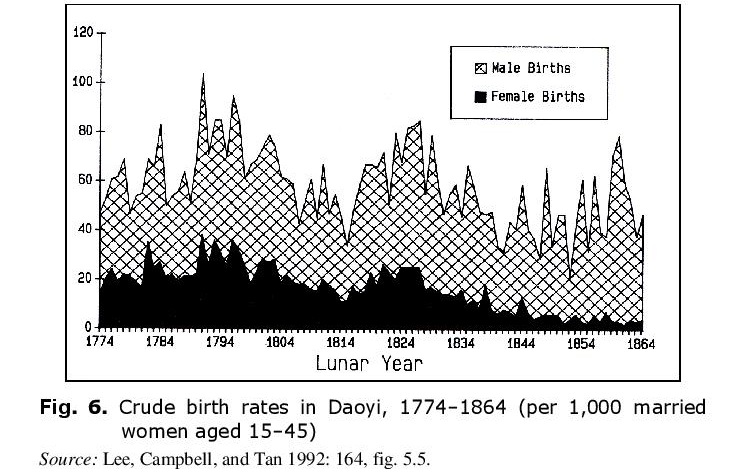
The fact that the excess of demographic growth rates over GDP growth rates led in Qing China to a catastrophic decline in the level of life of the majority of population is confirmed by the data on dynamics of female infanticide (see Fig. 6).
Fig. 6 displays the results of processing of data taken from one of the Qing registration offices that registered births of both boys and girls. As we see, even in the beginning of the period covered by Fig. 6 the situation was far from problem-free – the office used to register just about 5 new-born girls per 10 new-born boys. However, by the late 1840s the situation became simply catastrophic – the office tended to register 1–2 new-born girls per 10 new-born boys.
It appears necessary to note that the historical economic research in this field has revealed for the Qing China the presence of rather strong and significant correlations between the levels of prices of basic food commodities and the levels of female infanticide (see, e.g., Lee, Campbell, and Tan 1992: 158–175).
This, of course, suggests that the catastrophic growth of female infanticide was connected with the catastrophic decline of the living standard of the Chinese population majority.[3]
The catastrophic decline of the majority’s level of life in China quite naturally led to the growth of dissatisfaction with the government, which in 1850–1870 produced a series of rebellions (the Taiping Rebellion was the largest among them [see, e.g., Ilyushechkin 1967; Larin 1986; Nepomnin 2005: 395–444; Perkins 1969: 204; Kuhn 1978; Liu 1978 etc.]); this was apparently the bloodiest internal political collapse in the history of the humankind with the total number of dead being estimated as high as 118 (one hundred and eighteen!) million people (Huang 2002: 528). It worth noting that the majority of them died not as a result of direct violence, but because of diseases, famine, floods, etc. that took place in direct connection with the abovementioned events. The most destructive results were produced by the break of the dams by the Yellow River in 1853. As a result the great Chinese river changed its course (before these events it flew to the ocean south of the Shandung Peninsular, and afterwards it began to flow north of it), and a large part of densely populated Northern China was literally washed down. Numerous people died directly as a result of the flood, still more were left without sustenance, had to fled to the cities where the Qing government totally exhausted by the Taiping War had no resources to provide them with food. As a result, millions of undernourished people died of diseases and famine (see, e.g., Kuhn 1978 for more details).
It should be emphasized that even the catastrophic change of the Yellow River course had evident Malthusian causes. The point is that in the preceding period the growing relative overpopulation of the Yellow River valley led to the increasing cultivation of the marginal lands upstream. This resulted in the acceleration of soil erosion and, consequently, the increasing silting of the Yellow River bottom; the bottom was rising more and more that increasingly raised the threat of floods. A whole system of counter-flood dams was built in order to counteract this threat – naturally, their height grew with the rise of the Yellow River bottom. As a result, by the beginning of the Taiping Rebellion the great Chinese river flew in its lower course well above the level of the North Chinese Plain, and in order to prevent its breaking the dams enormous (and constantly growing) resources were needed. After the Taiping rebels[4] captured
the Chinese ‘breadbasket’ in the Lower Yangtze region, the revenues of the Qing budget shrank in the most catastrophic way; this was accompanied by an impetuous increase in military expenses that were necessary to counteract the deadly Taiping onslaught. As a result, the Qing government failed to secure the necessary (and very costly) support of the extremely complex counter-flood system, and the catastrophic break of the dams by the Yellow River became inevitable (see Korotayev, Malkov, and Khaltourina 2006b: ch. 2 for more details).
Note that Malthus himself considered warfare (including, naturally, internal warfare) as one of the most important results of overpopulation (in addition to epidemics and famines). What is more, he regarded wars, epidemics, and famines (and all of these were observed in China in 1850–1870) as so-called ‘positive checks’ that checked overpopulation in pre-industrial systems (Malthus 1978 [1798]). Thus, in pre-industrial societies bloody political upheavals frequently turned out to be a result of the respective social systems being caught in the Malthusian trap.
By now the students of social systems entrapped in the Malthusian trap have a rather significant number of mathematical models of political-demographic dynamics of such social systems describing the development of bloody political upheavals at the phase of socio-demographic collapse of pre-industrial political-demographic cycles (see, e.g., Korotayev and Khaltourina 2006; Korotayev, Malkov, and Khaltourina 2006b; Usher 1989; Chu and Lee 1994; Malkov 2009; Komlos and Nefedov 2002; Turchin 2003, 2005a, 2005b; Nefedov 2004; Turchin and Nefedov 2009; Turchin and Korotayev 2006 etc.).
Demographic transition and the increase in agricultural productivity due to major technological advances in the recent centuries (see, e.g., Grinin 2006) allowed most states to escape the Malthusian trap. The first phase of the demographic transition is characterized by a decline in mortality due to improved nutrition, sanitation, advancement and spread of modern medical technologies, etc. This leads to the acceleration of population growth. In the second phase of demographic transition, the development of medicine in combination with other processes (especially with mass education among women) leads to a widespread use of family planning technologies and, as a result, to a decrease of population growth rates (see, e.g., Chesnais 1992; Korotayev, Malkov, and Khaltourina 2006a).
However, these modernization processes started later in Sub-Saharan Africa than in the rest of the world; and even in the recent decades the Malthusian trap tended to produce state breakdowns in this region.
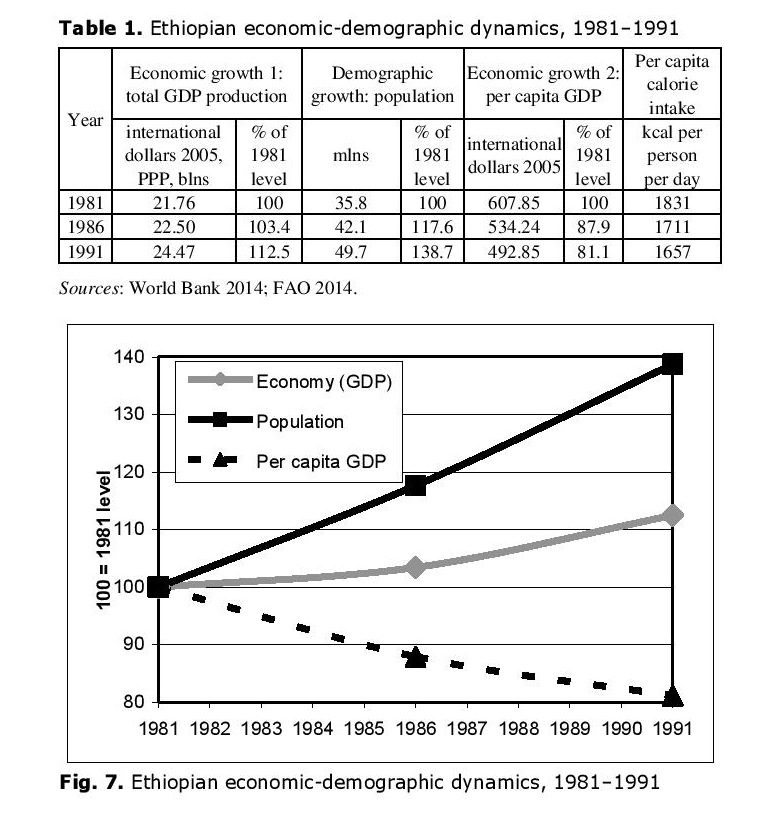
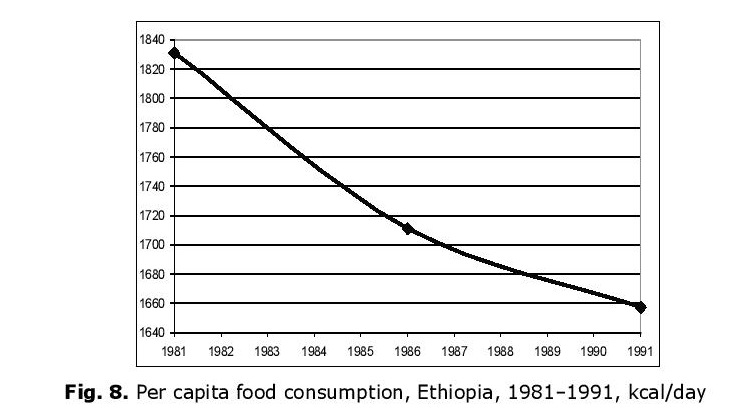
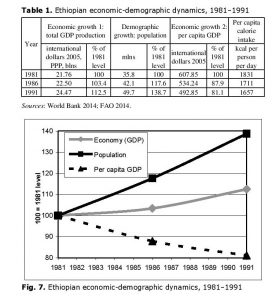 For example, in the period preceding the fall of Mengistu Haile Mariam’s regime, from 1981 to 1991, Ethiopia’s GDP grew by 12.5 %, but during the same period the population grew by 40 %. As a result, GDP per capita fell from very low $608 to catastrophic $500. Another dramatic fall occurred in per capita calorie intake: 1831 kcal/day in 1981 was already very low, 1657 in 1991 was below physiological minimum (see Table 1).
 Such a low level of per capita food consumption means that a large part of a country’s population is on the edge of serious starvation. In this situation, many inhabitants of this country might choose joining rebels (or bandits; in fact, as it is well known that rebels could be quite easily transformed into bandits, and vice versa). It can be quite a rational choice when continuation of usual ways of obtaining subsistence means an almost unavoidable hungry death, whereas joining rebels/bandits gives at least some realistic survival chances (see Korotayev and Khaltourina 2006 for more details). We do not say that this was the only cause of the fall of Mengistu Haile Mariam’s regime, but we believe that this factor definitely contributed to this fall.
Some Features of Political-Demographic Dynamics of Modernizing Systems
Against this background it appears interesting to consider a few cases of major political upheavals in recent decades.
Albania – Sociopolitical Collapse of 1997
In 1997 Albania was swept by a wave of violent riots caused by the collapse of financial pyramids, as a result of which hundreds thousand Albanians lost all their savings. As is well known, many postsocialist European countries confronted this sort of problem (like the famous collapse of the MMM pyramid in Russia), but nowhere did this lead to a sociopolitical collapse comparable with the Albanian one:
By early March 1997, Albania was in chaos… The army and police had mostly deserted. Armories had been looted…, evacuation of foreign nationals and mass emigration of Albanians to Italy began. The government’s authority… had evaporated. When Tirana fell into civil disorder in late March, the government resigned… Some 2,000 people were killed… Almost one million weapons were looted… Large parts of the country were… outside of the government’s control (Jarvis 1999: 18).
The order in the country was only restored after the deployment of foreign (first of all, Italian) troops (Ibid.: 17). With a view to what we have already considered in the previous section, it appears rather seductive to suppose a certain ‘Malthusian’ component in the above-described events. Indeed, in the 1960s – 1990s Albania was the poorest European country with anomalously high (by European standards) birth and fertility rates (see, e.g., Korotayev et al. 2010). Within such a context there seem to be all the possible grounds to expect the development of a classical Malthusian scenario: population growing faster than output – decline of per capita food consumption to the level of bare survival (or even below) – social explosion.
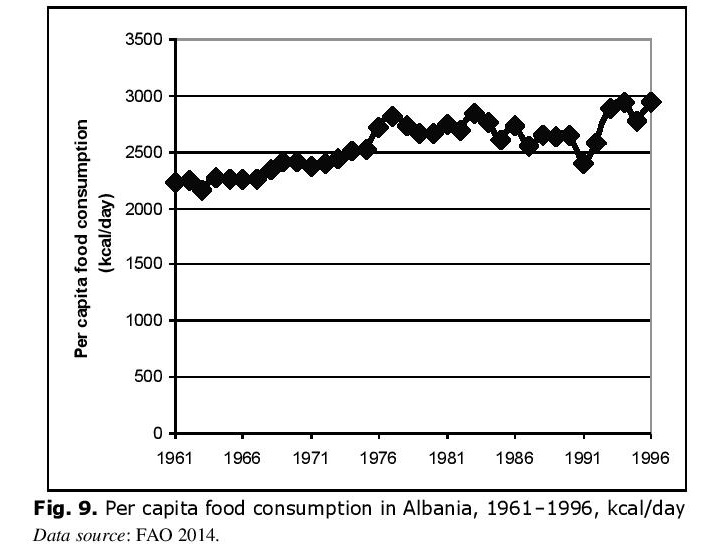
 Against this background it appears interesting to consider the actual dynamics of per capita food consumption in Albania in the three decades preceding the sociopolitical collapse of 1997 (see Fig. 9).
As we see, for the period in question the dynamics of this indicator in Albania turned out to be almost contrary to the ones predicted by the Malthusian scenario. Still in the early 1960s in Albania the problem of malnutrition was very serious and the average per capita food consumption was below the norm of 2300–2400 kcal/day recommended by the WHO (see, e.g., Naiken 2002).
However, in the 1960s and 1970s Albania managed to achieve evident successes in the solution of the food problem; in the late 1960s – early 1970s in this country the per capita food consumption exceeded the norm recommended by the WHO – and afterwards it has never dropped below it. In the late 1970s and early 1980s the growth rate of this indicator slowed down, and in 1983–1991 a certain trend towards its decline was observed, which, of course, reflects very serious economic difficulties that were experienced by Albania in the last years of the ‘communist’ period of its history (see, e.g., Sandstrom and Sjöberg 1991). However, even in 1991 (the hardest year in Albania) per capita food consumption did not drop below the norm recommended by the WHO. On the other hand, after 1991 Albania managed to achieve new successes in solving the food problem, and in 1993–1996 per capita food consumption in Albania reached record values for the whole Albanian history; by 1997 it was closer to what would be more appropriately called ‘overeating’ rather than ‘undernourishment’ level.
In any case, we may maintain with a high degree of confidence that with respect to Albania in 1961–1997 it appear impossible to speak about anything like a drop of per capita food consumption to the level of bare survival as
a result of the population growing faster than output. It appears much more appropriate to say that these were precisely those years when Albania managed to escape quite successfully from the Malthusian trap.[5]
South Korea – The 1980 Kwangju Uprising
After the end of the Korean War the largest popular uprising in South Korea took place in 1980 in the city of Kwangju (with 300 thousand participants, about 2000 dead, 5 divisions of regular army taking part in the suppression of the rebellion, etc.). This uprising was accompanied by a series of popular riots in neighboring cities (Lewis 2002).
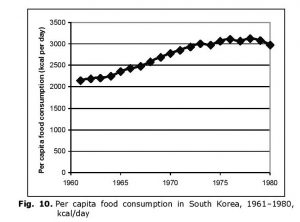 Against this background, the dynamics of per capita food consumption in South Korea in the two decades preceding the abovementioned popular rebellion looks rather noteworthy (see Fig. 10).
As we see, South Korea was another country that in the early 1960s encountered the undernourishment problem, the average per capita food consumption being below the norm recommended by the WHO. On the other hand, this was another country that in the 1960s and the early 1970s managed to achieve very noticeable achievements in solving the food problem; note that these achievements were even more considerable than in Albania, it was already in the mid-1960s that the average per capita food consumption in this country exceeded the norm recommended by the WHO (and it has never gone below that level afterwards). After 1973 the growth rate of this indicator in South Korea decreased, and in the late 1970s its certain (though quite insignificant) decline was observed. It does not seem to be a coincidence that this occurred simultaneously with the start of the period of an especially rapid growth of the South Korean economy (the so-called ‘Korean economic miracle’) when an unusually high proportion of the South Korean GDP was used for the gross capital formation purposes (see, e.g., Akaev 2010); hence, an unusually low GDP share was left for the consumption purposes. In the meantime, it appears necessary to stress that, notwithstanding some (incidentally, very small) decline of the per capita food consumption in the late 1970s, the value of this indicator remained at a very high (about 3000 kcal per day) level by the start of the abovementioned popular rebellion.
In any case, with respect to South Korea in 1961–1980 we again get across the case when it is impossible to note any fall of per capita food consumption to the level of bare survival as a result of the population growth rates exceeding the output growth rates. We rather get across one more case when a social system escaped rather successfully from the Malthusian trap just in the decades preceding a social explosion.
Egypt – 1977 ‘Bread Riots’
The largest political unrest in Egypt after 1952 took place in 1977 (the so-called ‘Bread Riots’). The participants were chanting Yā batl al-`ubūr! Fēn al-futūr? ‘Hero of the Crossing, where is our breakfast?’ (addressing President Sadat).

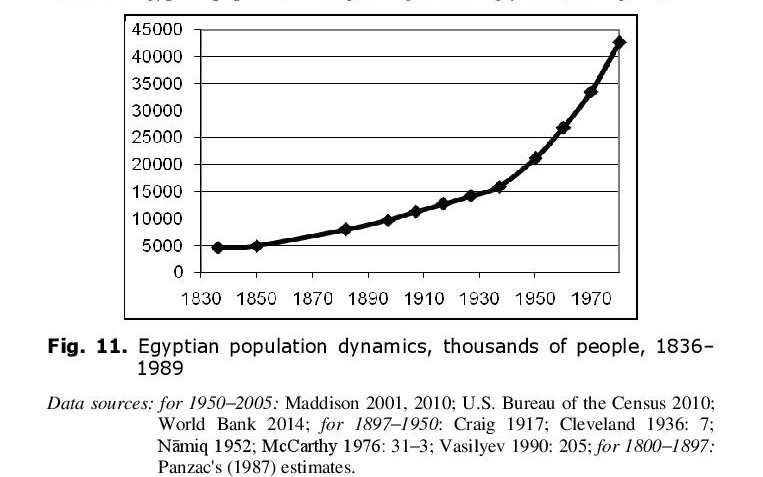
 The riots took place in all the large Egyptian cities, several hundred thousand people participated in them, not less than 800 fell victim (see, e.g., Hirst 1977). Seemingly, we should deal here with nothing else than Malthusian scenario, as the protesters clearly complained about food insufficiency, while in the 1960s – 1970s the Egyptian population was growing exceedingly fast (see Fig. 11).
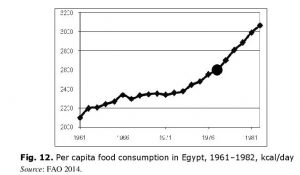
In this regard it seems reasonable to view the actual dynamics of per capita food consumption in Egypt in the 1960s and 1970s (see Fig. 12).
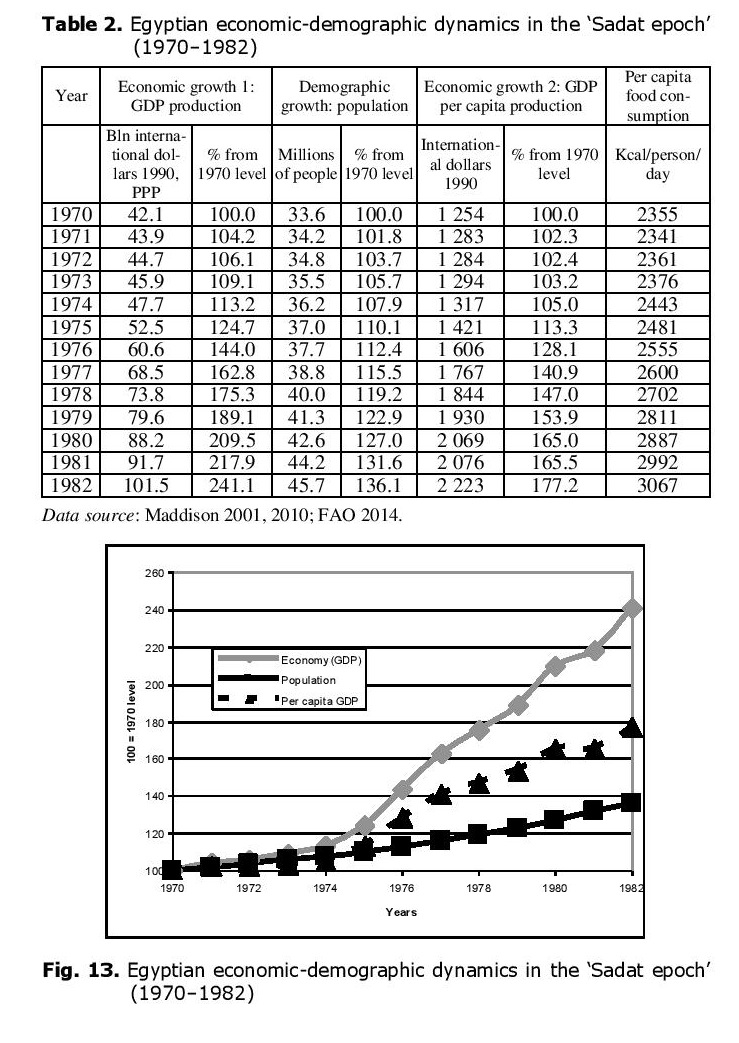
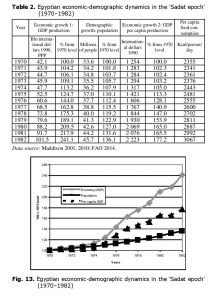 Evidently, Malthusian scenario does not work here. Indeed, in the early 1960s the problem of undernourishment was still quite acute for Egypt, and per capita consumption was lower than the WHO recommended norm of 2300–2400 kcal/person/day (Naiken 2002). In the mid-1960s Egypt reached this level, but could not exceed it before 1974. After 1973 per capita food consumption increased rapidly, getting over 3000 kcal/day in 1982 (next year after Sadat’s death) and never after decreasing beyond this level. Thus, the problem of overeating became more relevant for Egypt than the one of undernourishment. This success should be attributed to the Infitah economic reforms launched by Sadat administration in 1974 (see, e.g., Weinbaum 1985: 215–216). Indeed, though population grew by 36.1 % from 1970 to 1982, Egyptian GDP grew by 141.1 % during the same period, the major part of this growth taking place during Infitah. As a result, GDP per capita grew almost twofold, which correlated with the similarly rapid growth in per capita consumption (see Table 2 and Fig. 13).
Thus, ‘bread riots’ occurred in Egypt at that very time when the country was successfully escaping from the Malthusian trap.
Syria – The 1982 Hama Rebellion
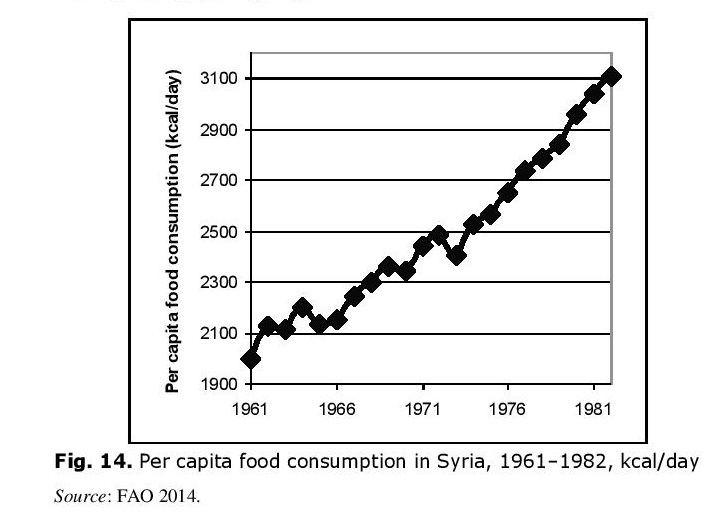
In Syria after the end of the Second World War the largest popular rebellion took place in 1982 in Hama. The rebellion was suppressed with regular army units, aviation, artillery, and tanks. According to some estimates, the number of dead reached 40 thousand, including 1000 soldiers of regular army (see, e.g., Fisk 1990; Friedman 1998; Wiedl 2006).
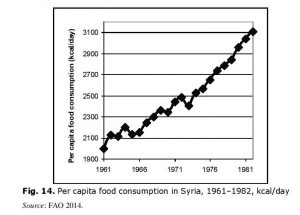 After the cases considered above the picture of dynamics of per capita food consumption in Syria in the two decades preceding the Hama rebellion should not look surprising. Yet, with respect to this country the ‘counter-Malthusian’ dynamics looks especially impressive – indeed, in the nine years preceding the rebellion the per capita food consumption in Syria was growing continuously and very rapidly (see Fig. 14).
In general, as we see, in the two decades preceding the largest popular rebellion in its post-war history Syria had escaped the Malthusian trap in a rather successful way, having moved within a historically very short period quite far from the level of explicit undernourishment of the early 1960s and reaching by 1982 a level that could be more accurately characterized as overeating.
Civil War in El Salvador
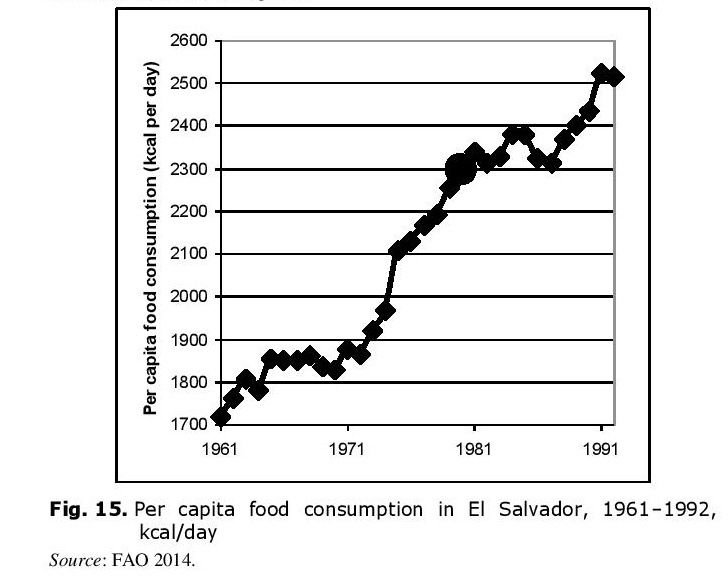
In 1980 a civil war began in El Salvador; it continued till 1992 and led to the death of 75 thousand inhabitants of this country – a colossal number for a country with total population of about 4.5 mln people at the moment of the civil war start (see, e.g., Montgomery 1995).
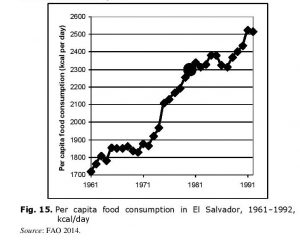 In the meantime, the per capita food consumption dynamics in El Salvador looked as follows (see Fig. 15):
We obviously see here a picture that is generally similar to the cases observed above; however, it has some noticeable nuances. As we see, still in the early 1960s the majority of the Salvadorian population confronted the most serious (in comparison with all the other cases considered above) undernourishment problems. The situation with food consumption somehow improved in this country in the 1960s. However, it improved in the most significant way just in the decade that preceded directly the outbreak of the Salvadorian civil war. It was just the year of the civil war start when per capita food consumption in this country reached the level recommended by the World Health Organization.
Civil War in Liberia
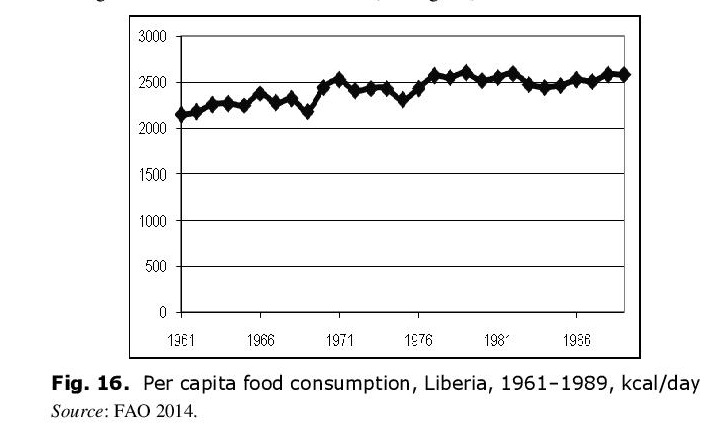
In 1989 a civil war started in Liberia which continued up to 2003. About 200,000 – 300,000 Liberians were  killed (of the total population slightly more than 2 mln at the war start) (Frenkel 1999; Huband 1998; Williams 2006). General dynamics of per capita food consumption in Liberia during 3 decades preceding the civil war looked as follows (see Fig. 16):
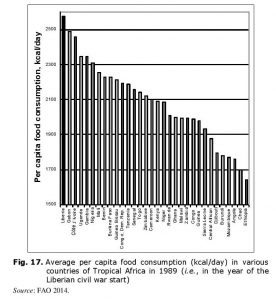
Thus, in the 1960s – 1980s (before civil war) per capita food consumption tended to grow in Liberia. While in the early 1960s there was some undernourishment, in the 1980s per capita consumption was thoroughly higher than the recommended norm of 2300–2400 kcal/day. Besides, in the year of civil war start Liberia occupied the FIRST place in Tropical Africa according to the level of per capita food consumption (see Fig. 17).
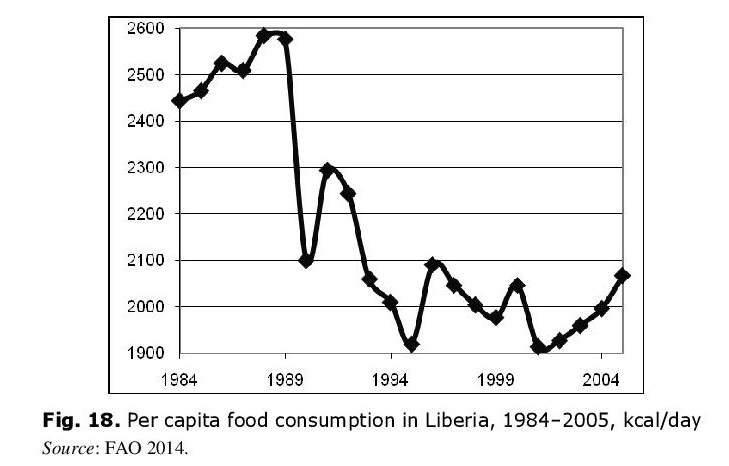
 Liberian case is among the most tragic ones, as not only did the country ‘stumble’ at the escape from the Malthusian trap, but also fell back into the trap again (see Fig. 18).
 Thus, in 2005 per capita food consumption had not yet approached the pre-war level and was significantly lower than even the early 1960s level. After civil war started, an unfavorable mechanism of positive feedback formed in Liberia, as civil war destroyed economy, which reduced the per capita consumption, which increased the unrest and worsened the civil war. During the short breaks the renewed (even before economy restoration) rapid demographic growth did not allow for any remarkable improvement in living standards (nor in per capita consumption) or even led to its worsening, which resulted in new unrests and new stages of civil war. Currently Liberia is again trying to escape from the Malthusian trap, but there is no warranty against its getting into ‘a trap at the escape from the Malthusian trap’ once more.
 Civil War in Côte d’Ivoire
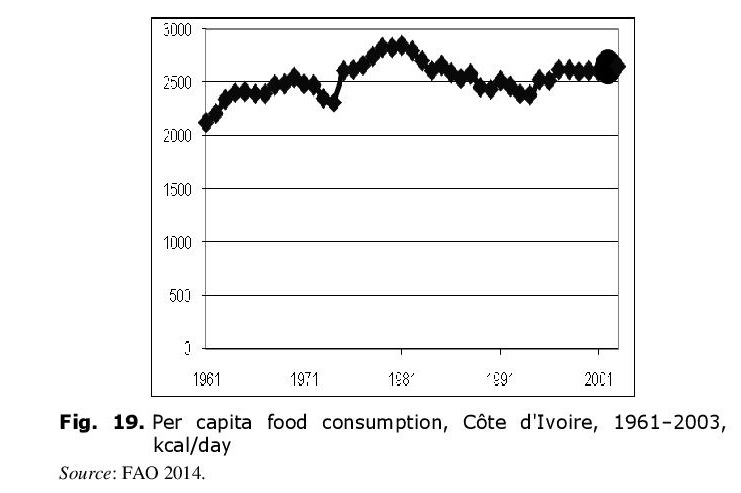
One of the most recent civil wars in Africa occurred in Côte d’Ivoire in 2002 (Akokpari 2007). Per capita food consumption dynamics thereby looked as follows (see Fig. 19):
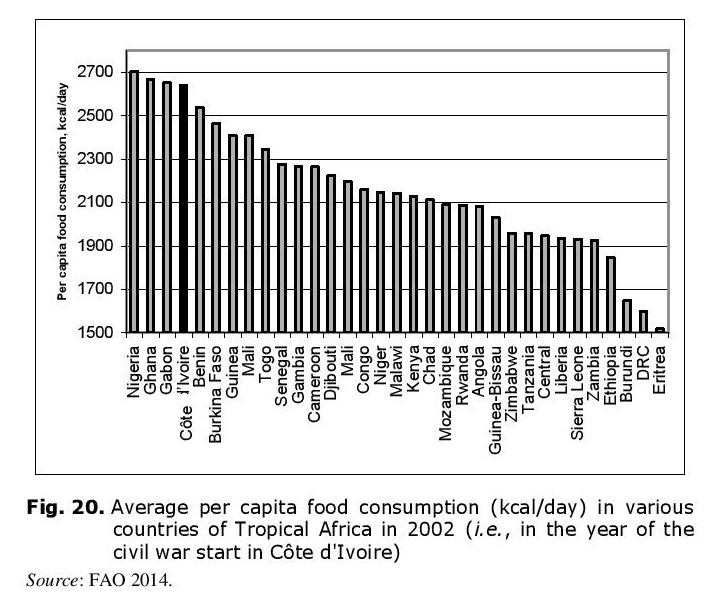
 Thus, undernourishment problem was solved in the 1960s, and at the civil war start per capita food consumption was stably higher than the WHO recommended norm. Besides, in the civil war start year Côte d’Ivoire rated among the top Tropical African countries according to per capita food consumption indicator (see Fig. 20).
Islamic Revolution in Iran
Against the background of the material considered above the dynamics of per capita food consumption in Iran in the years preceding the successful Islamic Revolution of 1979 in Iran should 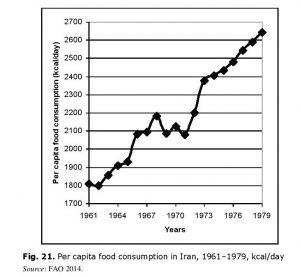 not look really surprising (see Fig. 21).
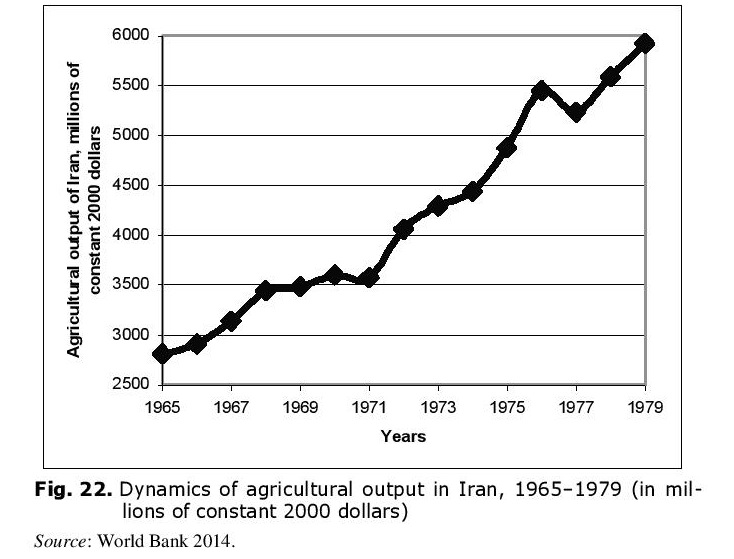
This diagram suggests that the system of socioeconomic reforms (the so-called ‘White Revolution’ [see, e.g., Abrahamian 2008: 123–154]) started by the last Iranian Shah Mohammad Reza Pahlavi in 1963 brought conspicuous positive results. Indeed, the Iranian population grew very rapidly in the years preceding the Iranian Revolution. For example, between 1965 and 1979 it grew from 25 to almost 38 million (see, e.g., Maddison 2001, 2010), that is by about 50 %. However, in the same period of time the agricultural output in Iran grew by more than 100 % (see Fig. 22).
 In the meantime Iranian GDP in this period grew by more than 150 %, as a result of which per capita GDP increased by 75 % (Maddison 2001; 2010). Hence, the salient positive trend of per capita food consumption dynamics in Iran reflects up to a rather high degree the real economic successes that were achieved by this country as Mohammad Reza Pahlavi’s administration was implementing the system of socioeconomic reforms known as the ‘White Revolution’.
Civil War in Algeria
Let us consider in some greater detail the structural-demographic dynamics of Algeria 1962–1991, that is in the period after independence and before the start
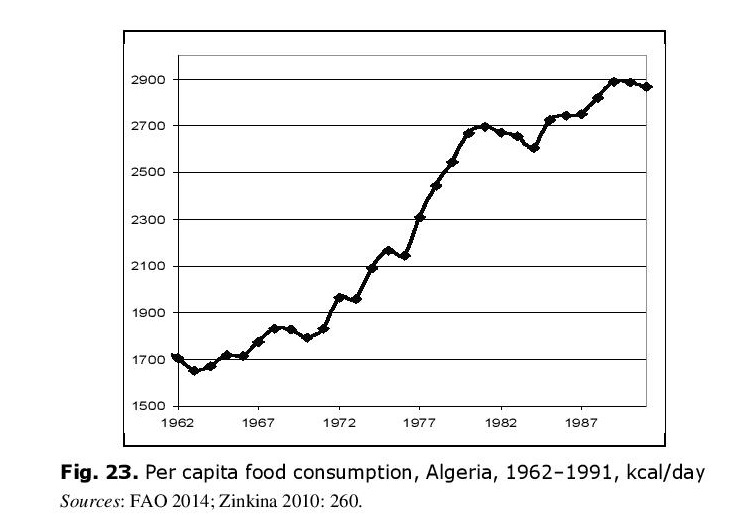
of the civil war (1992–2002) which can be characterized as a failed Islamic revolution (Kepel 2004: 164–180, 247–266). Per capita consumption dynamics in  Algeria during the two decades preceding the civil war looked as follows (see Fig. 23):
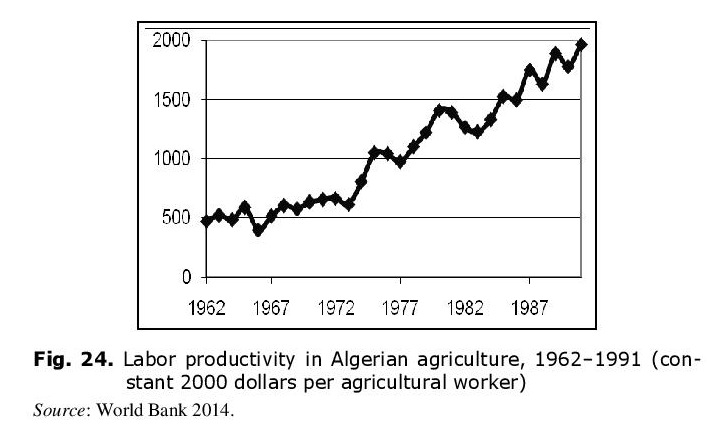
 Obviously, the dynamics observed is just contrary to the one that could be expected on the basis of the Malthusian trap assumption. Indeed, in the first years after independence the Algerian population was far below the WHO norm and greatly undernourished. Only in 1973 did it manage to go over the critical level of 1850 kcal/day. However, there was no unrest in this period. By the late 1970s Algeria exceeded the WHO 2300–2400 kcal/day recommended level and did not fall below this level any more. By the late 1980s it was more than 2800 kcal/day. This dynamics correlates very well with the rapid growth of agricultural labor productivity proving the significant success achieved by Algeria in the modernization of agriculture (see Fig. 24).
A Trap at the Escape from the Malthusian Trap:
Empirical Data
During the three decades preceding the start of the civil war Algeria successfully came out of the Malthusian trap; in fact, as we shall see below, this very escape to a large extent generated the forces that played a crucial role in the genesis of the Algerian civil war.
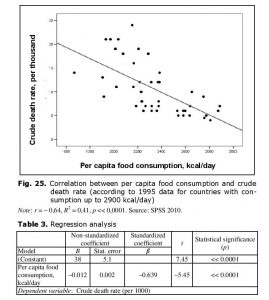 By definition, the escape from the Malthusian trap implies the solution of the famine problem, which in its turn implies a significant decrease in the death rates. Indeed, for countries with per capita consumption up to 2900 kcal/day there is a strong negative correlation observed between this indicator and the crude death rate (see Fig. 25 and Table 3).
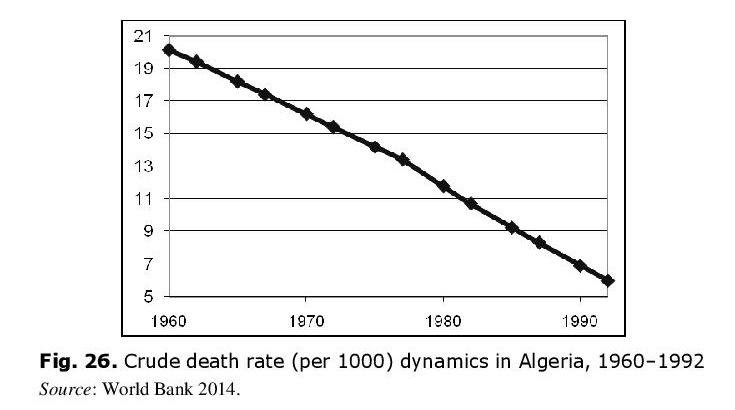
As escape from the Malthusian trap usually occurs at the first stage of demographic transition, the results of regression analysis imply that this escape (usually accompanied by more than 1000 kcal/day growth in per capita 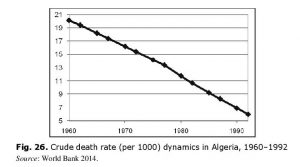 consumption) must be accompanied by population growth rates increase by not less than one per cent, which implies a very significant acceleration. This can be seen in Algeria. The escape from the Malthusian trap was accompanied by a dramatic fall in death rate (see Fig. 26).
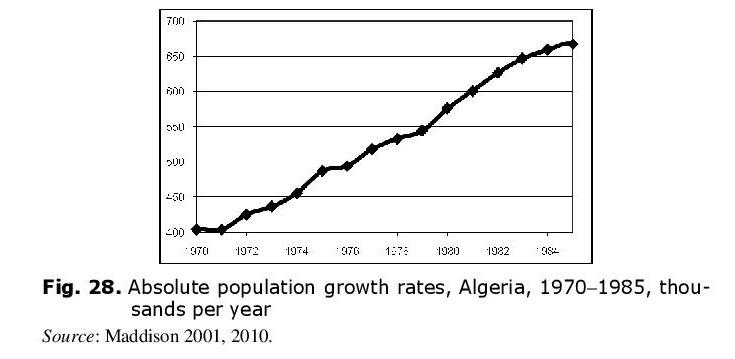
Thus, in three decades preceding the start of the civil war the Algerian death rates declined threefold! During the most of this period birth rate was stably high, so population growth rates were increasing and started 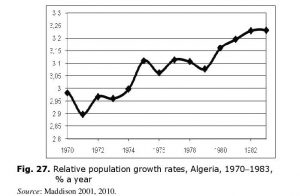
 to decline only in the mid-1980s, but in 1991 (civil war start) they were still very high (2.4 % or 600,000 a year) (see Figs 27 and 28).
Naturally, such an impetuous population growth would almost inevitably create serious structural strains in any social system. However, within the Algerian social system this was not the only generator of structural strains.

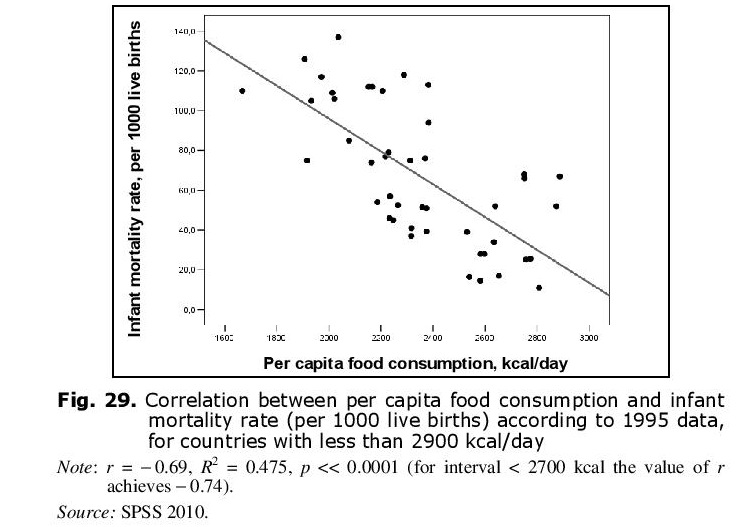
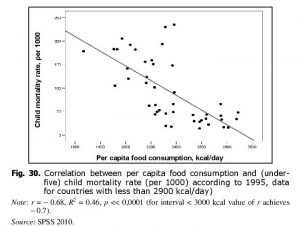 Within socioeconomic systems escaping from the Malthusian trap per capita consumption growth correlates in an especially strong way with the decrease of infant and child mortality (see Figs 29 and 30):
Predictably, Algerian escape from the Malthusian trap was also accompanied by a precipitous fall of infant and child mortality rates (Figs 31 and 32):
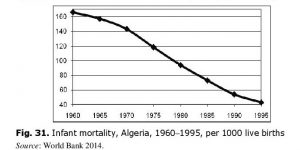 Thus, while crude death rate in Algeria in 1960–1995 decreased threefold, infant mortality declined almost fourfold during the same period, while child (under-five)
 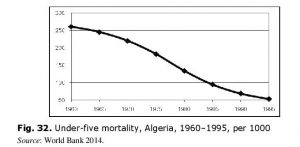 mortality fell almost fivefold!
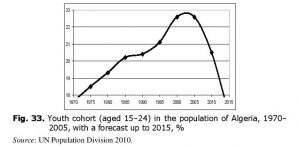
Thus, at the first phase of demographic transition (that tends to coincide with the escape from the Malthusian trap) death rate declines dramatically (Vishnevski 1976, 2005; Chesnais 1992; Korotayev, Malkov, and Khaltourina 2006a), the greatest decline occurring in infant and under-five mortality, while birth rates still remain high. Thus, out of six-seven children born by a woman, five-six children survive up to reproductive age, not two or three as earlier. This leads not only to the demographic explosion, but also to the formation of the ‘youth bulge’, as the generation of children turns out to be much larger in number than their parents’ generation. Thus, in Algeria the share of youth cohort in the total population greatly increased at the escape from the Malthusian trap (see Fig. 33).
 A number of researchers, first of all Goldstone (1991, 2002), regard the rapid growth of the youth share in population as a major factor of political instability.
For example, Goldstone maintains that ‘the rapid growth of youth can undermine existing political coalitions, creating instability. Large youth cohorts are often drawn to new ideas and heterodox religions, challenging older forms of authority. In addition, because most young people have fewer responsibilities for families and careers, they are relatively easily mobilized for social or political conflicts. Youth have played a prominent role in political violence throughout recorded history, and the existence of a ‘youth bulge’ (an unusually high proportion of youths aged 15–24 years relative to the total adult population) has historically been associated with times of political crisis. Most major revolutions … [including] most twentieth-century revolutions in developing countries – have occurred where exceptionally large youth bulges were present’ (Goldstone 2002: 10–11; see also Goldstone 1991; Moller 1968; Mesquida and Weiner 1999; Heinsohn 2003; Fuller 2004).
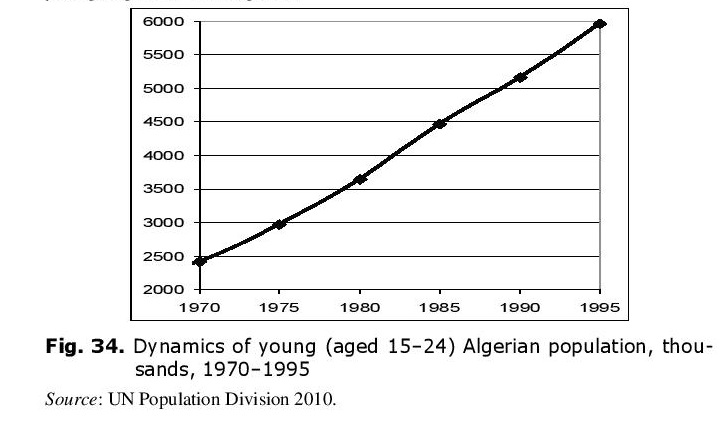
 Let us consider the ‘youth bulge’ factor in Algeria in more detail. This will allow specifying some other channels of this factor’s impact upon the political instability genesis. First of all consider the dynamics of absolute number of young Algerians (see Fig. 34).
Thus, number of Algerian youths was growing explosively at the eve of the civil war, more than doubling within 20 years (1970–1990). In 1980–1995 it grew by 65 %. Accordingly, in order to prevent catastrophic unemployment, new workplaces had to be created at a proportionate rate, which is difficult even for a fast-growing economy. If an economy is not growing as fast, unemployment rockets up (in Algeria it reached 40 % in the late 1980s: Haldane 1989; Zinkina 2010: 261), especially among the youth (i.e., among that very age cohort which is most inclined to aggression). Against such a background it usually becomes more and more difficult to prevent major political upheavals.
There is one more force generated by modernization in general (and the escape from the Malthusian trap, in particular) that can contribute to the genesis of political instability, namely urbanization (see, e.g., Grinin and Korotayev 2009; Grinin 2010). Indeed, the start of escape from the Malthusian trap leads to a stable decline in death rates, stipulating the first phase of demographic transition. The escape itself is achieved through agricultural labor productivity growth (as was mentioned above, in Algeria it grew fivefold during the two decades preceding the civil war).
In general, the escape from the Malthusian trap stimulates urban population growth in several ways. Death rate decline in conjunction with still high birth rates leads to a rapid increase of population growth rates, so excessive rural population appears. This population is pressed out of the rural areas, as labor productivity grows, and less workforce is required for agricultural work. This population may well be supplied with food resources as per capita food production and consumption increases at the escape from the Malthusian trap, so such escape strongly supports the rapid intensification of urbanization processes, allowing for the urbanization levels which could not be achieved in agrarian societies.
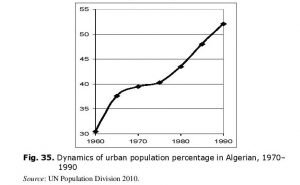 Let us consider this with respect to the Algerian case (see Fig. 35).
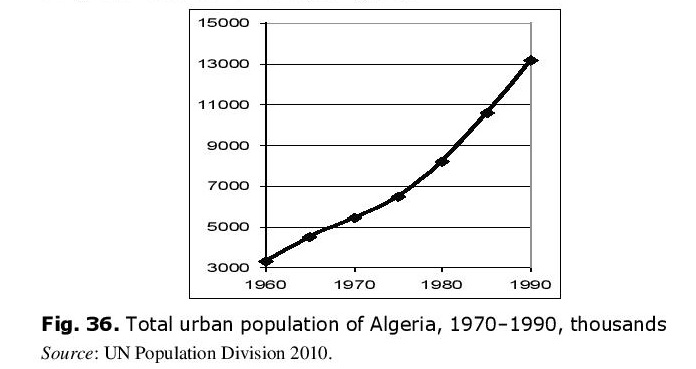
Thus, less than one-third of Algerians resided in cities at the eve of independence. At the eve of the civil war the urban population constituted more than a half of the whole population. This increase took place against the background of a very fast demographic growth. Thus, urban population was growing particularly fast in absolute numbers (see Fig. 36).
 Thus, during 30 years preceding the civil war start in Algeria the urban population grew fourfold, which evidently could serve as a major destabilizing factor.
The escape from the Malthusian trap engenders a rapid growth of urban population due to both natural increase and rural-urban migrations. This causes social tensions, as jobs and accommodation need to be supplied for the fast-growing mass of people. Besides, rural migrants usually have no skills appropriate for urban settings and can only find unqualified and low-paid jobs, which causes growing discontent among them.
The situation is exacerbated by the fact that most of the rural-urban migrants are usually young. The ‘youth bulge’ and intensive urbanization factors act together, making the number of young urban population rocket up.[6] For example, during 30 years of independence in Algeria its young population grew almost threefold, while its urban population increased fourfold, so the number of the urban youth increased by an order of magnitude (which was just a logical consequence of the country’s escape from the Malthusian trap). Thus, not only did the most radically inclined part of population rocket up in numbers, but it also got concentrated in cities (that, we should not forget, are centers of political system), which is a serious danger for political stability, especially if economic decline occurs.
It appears quite useful to consider the action of the above-described factors at the ‘grassroots’ level. For this we find it appropriate to reproduce Kepel’s description of the events in Algeria that preceded the October riots of 1988, which served as an omen of the forthcoming civil war:
…A population explosion had thrust the children of the fellahs (farmers) into the cities and their outskirts, where conditions were precarious… In 1989, 40 percent of Algeria’s population of 24 million were under 15 years of age; the urban population was in excess of 50 percent of the total population… The official unemployment rate was 18.1 percent of the working population, though in reality joblessness was much higher; in 1995 it rose – again officially – to 28 percent. The young urban poor of Algeria were mocked as hittistes – from the Arab word hit, ‘wall’. This jibe derived from the image of jobless young men with nothing to do all day but lean against a wall. The joke was that, in a socialist country where in theory everyone was supposed to have a job, the profession of a hittiste consisted in propping up walls that would otherwise collapse. The hittistes were assumed to be passive – unlike the Iranian ones, who were glorified by religious movements and hailed as the messengers of history and the Revelation.
At the time of the October 1988 riots, oil and gas represented 95 percent of the nation’s exports and supplied more than 60 percent of the government’s yearly budget… The Algerian state was a kind of popular democracy cum oil. The state used its oil revenues to buy social pacification… This balance of power, maintained by subsidies, socialism, repression, and official ideology, was ultimately dependent on the fragile economic equilibrium created by the high price of oil. In 1986, when oil prices collapsed, half of Algeria’s budget was wiped out and the whole structure fell down in ruins. Worse, the population explosion had created a demand for… urban infrastructure, housing, and employment that continued to increase… The construction industry in particular had failed spectacularly to keep pace with the housing demand; the result was the kind of slums and overcrowded urban conditions that invariably lead to social eruption.
It was in this deteriorating climate, punctuated by continual strikes, that riots broke out on October 4, 1988. Mobs of impoverished Algerian youths attacked such symbols of the state as buses, road signs, and Air Algeria agencies, along with any automobile that looked expensive… These days… marked the emergence of the young urban poor as a force to be reckoned with. The once ridiculed hittistes had shown that they could seize and hold power in the streets, shaking to its foundations a regime that had excluded them and whose legitimacy they scorned (Kepel 2006: 159–161).
A Trap at the Escape from the Malthusian Trap:
Logical and Mathematical Models
Thus, the emergence of major sociopolitical upheavals at the escape from the Malthusian trap is not an abnormal, but a regular phenomenon. So, a special explanation is rather needed for exceptions, when social systems managed to avoid such shocks.
Why should such upheavals be treated as a regular phenomenon? The answer may be summarized as follows:
1) Start of the escape from the Malthusian trap tends to bring about a precipitous death rate decline and, consequently, an explosive acceleration of the population growth rates (which in itself can lead to a certain increase in sociopolitical tensions).
2) The start of the escape is accompanied by especially strong decreases in infant and under-five mortality, which raises the proportion of the youth in the overall population (and especially in the adult population) – the so-called ‘youth bulge’.
3) This increases sharply the proportion of the part of population most inclined to radicalism.
4) The impetuous growth of the young population requires the creation of enormous numbers of new jobs, which is a serious economic problem, while the youth unemployment growth can have a particularly strong destabilizing effect, creating an ‘army’ of potential participants for various political upheavals, including civil wars, revolutions, and state breakdowns.
5) Escape from the Malthusian trap stimulates a vigorous growth of the urban population. Besides, excessive population is pressed out from the countryside by the growth of agricultural labor productivity. Massive rural-urban migration almost inevitably creates a significant number of those dissatisfied with their current position, as initially the rural-urban migrants mostly can only get unskilled low-paid jobs and low-quality accommodation.
6) Escape from the Malthusian trap is achieved through the development of new economic sectors and decline of the old ones. Such structural changes cannot proceed painlessly, as old qualification of workers loses its value and, not having necessary new skills, these workers are obliged to take up low-qualified jobs, which makes them socially discontent.
7) The young people make up the majority of rural-urban migrants, so the ‘youth bulge’ and intensive urbanization factors act together, producing a particularly strong destabilizing effect. Not only does the most radically inclined part of population rocket up in numbers, but it also gets concentrated in major cities / political centers.
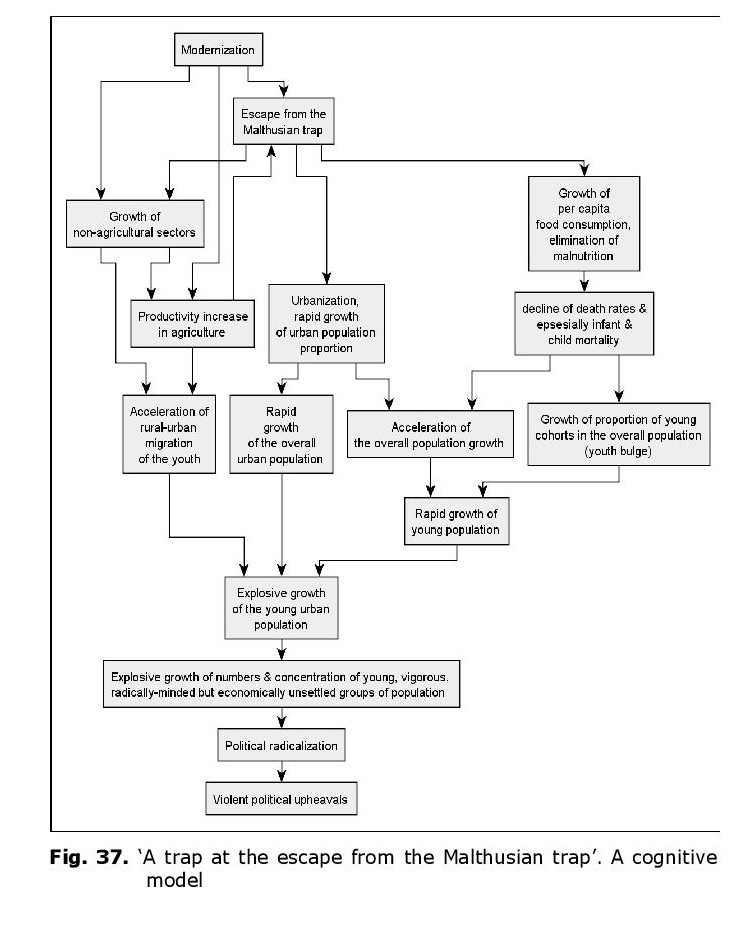
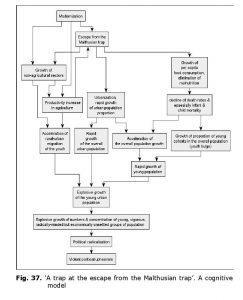
8) This can result in serious political destabilization even against the background of a rather stable economic growth (see Fig. 37). The probability of political destabilization naturally increases dramatically if an economic crisis occurs, or if the government loses its legitimacy due to any other causes (such as military defeats), though the recent ‘Arab Spring’ events have demonstrated once again in a rather salient way that even this is not really necessary (see, e.g., Korotayev and Zinkina 2011).
 As regards mathematical models describing the formation of the ‘youth bulge’ (that, in combination with some other factors, can lead to major sociopolitical upheavals even against the background of an apparently rather successful escape from the Malthusian trap), they are rather well-developed and are widely used in demographic research.
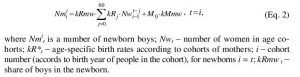
We can regard a model by Ototsky (2008) as an example. It uses component method (or cohort analysis) to describe mathematically the dynamics of society age structure. The method of components implies dividing the whole population into groups of people of one age, so-called ‘year cohorts’, which are divided into male and female ones for correct estimation of the population reproductive potential. For each cohort their own birth, death, and migration rates are determined. Birth year of people subsumed under the cohort is regarded as a serial number of this cohort. Number of males (or females) in a cohort is expressed in the following way:
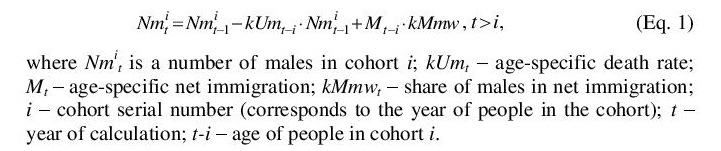
Number of newborn boys (and girls) is calculated with the following equation:
Number of the newborn in an age group is calculated in the following way:
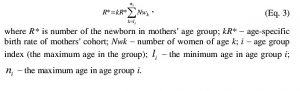
General number of the newborn by mother cohorts is calculated with the following equation:
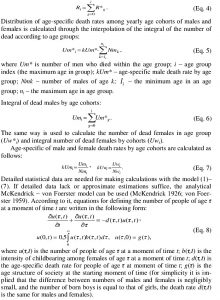
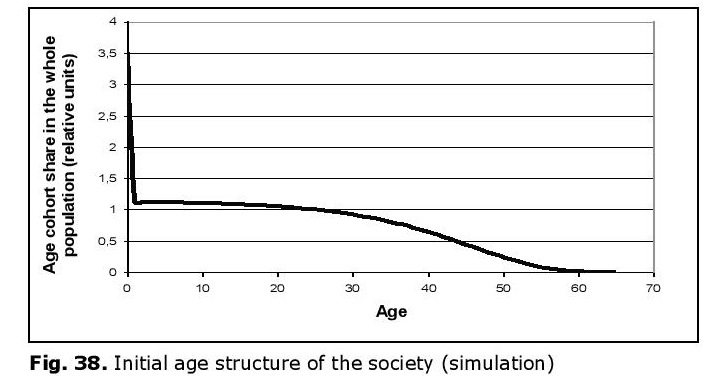
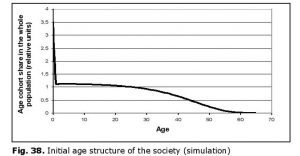
Model (8) is capable of describing the emergence of ‘youth bulge’ in a society escaping from the Malthusian trap. Assume that up to some moment of time t0 the society was demographically stable (its age structure did not change, see Fig. 38), while fertility rate was high (7 children per woman) and infant mortality was high, too.
If at moment t0 infant mortality starts declining and decreases fivefold in 30 years, then according to Eq. 8 society age structure will substantially change with the unchanged structure of birth rate (see Fig. 39, lines correspond to successive change of
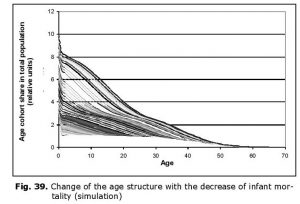 Obviously, infant mortality decline leads to an increase in proportion of the youth within total population. Thereby a ‘youth bulge’ emerges (see Fig. 40 reflecting the change of percentage of population aged 15–24 in the overall population starting from t0 + 20 years).
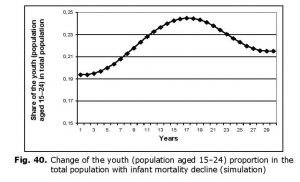 Obviously, despite their simulation character the results of calculations correlate with the empirical data rather well (see Fig. 33 above).Fig. 40. Change of the youth (population aged 15–24) proportion in the total population with infant mortality decline (simulation)
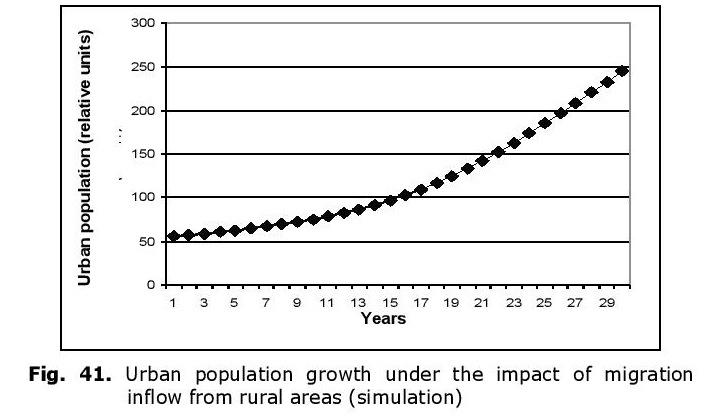
The excessive young population not required in the rural areas moves to cities searching for better life, which affects the development of socioeconomic and political processes in the society. The result of these processes depends on particular conditions. In any case, it is a critical period in the life of any society escaping from the Malthusian trap.
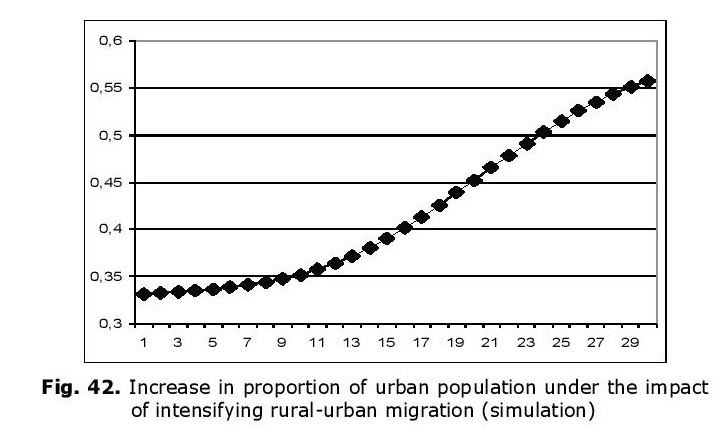
 Figs 41 and 42 represent the results of calculations on urban population growth and urban population percentage increase with an assumption that the increasing demographic pressure in rural areas presses the excessive population (and especially the young population) to move to the urban areas with probability about 0.5 (calculations are presented for the same conditions as in Figs 38–40 starting from t0 + 20 years).
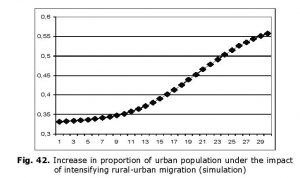
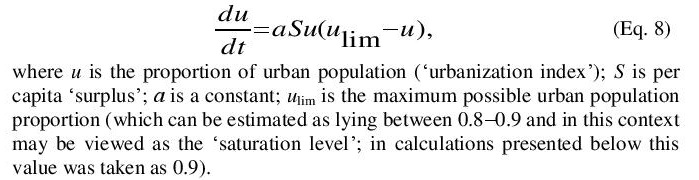
Naturally, mass rural-urban migration is possible only in conditions of general economic growth when some ‘surplus’ product appears which allows to feed the growing urban population. In order to account for this condition we can use the general dynamic urbanization equation developed in our earlier works (see, e.g., Korotayev 2006):

The sense of this equation is as follows: urbanization being low, the probability of a rural resident migrating to town is the higher, the greater urban population proportion. Indeed, the higher this proportion, the greater the probability of having some relative or acquaintance in town, who will be able to supply the rural migrant with the necessary information and initial support (an ordinary peasant will hardly decide to move ‘into nowhere’). However, urban population growth rates slow down when approaching the saturation level.
Besides, both in our equation and in real life urbanization rates depend also on the level of economic development, which in our equation is calculated through the per capita surplus. Indeed, if rural areas do not produce surplus, urbanization becomes impossible, while in order for it to start (and accelerate) significant economic growth is required. It also requires the labor productivity growth, for example, in agriculture, which would allow feeding the urban population, on the one hand, and creating a surplus of workforce in agriculture encouraging the rural residents to move to cities, on the other.
Uniting Eqs 1 and 8 into a system we obtain a mathematical description of the young urban population dynamics.
Correlation between Young Urban Population Growth Rates and Intensity of Internal Violent Conflicts: A Cross-National Test
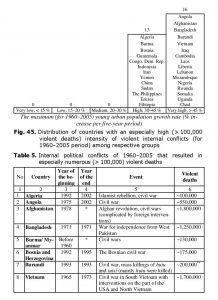
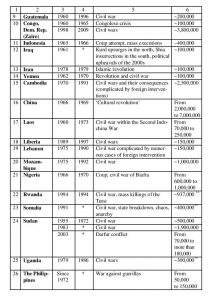
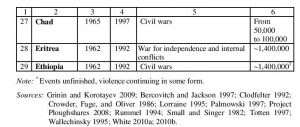
Our cross-national test indicates that violent internal conflicts should be expected in cases when the young urban population grows by more than 30 % during 5 years; if this indicator exceeds 45 % it turns out very difficult for corresponding countries to avoid such upheavals (see Table 4 and Figs 43–45):
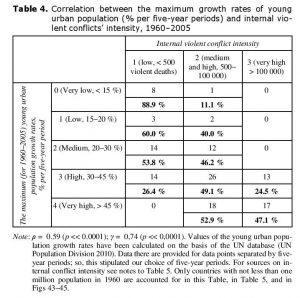
Fig. 43. Percentage of countries with low (< 500 violent deaths) intensity of internal violent conflicts (for 1960–2005 period) in respective groupsNote: ρ = 0.59 (p << 0.0001); γ = 0,74 (p << 0,0001). Values of the young urban population growth rates have been calculated on the basis of the UN database (UN Population Division 2010). Data there are provided for data points separated by five-year periods; so, this stipulated our choice of five-year periods. For sources on internal conflict intensity see notes to Table 5. Only countries with not less than one million population in 1960 are accounted for in this Table, in Table 5, and in
Figs 43–45.
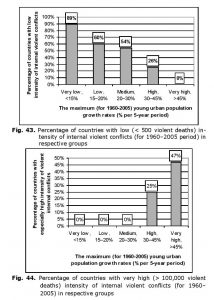 The research reveals that for 1960–2005 period the probability of major internal violent political conflicts in countries with very low (less than 15 % increase per five years) young urban population growth rates was very low. For countries with intermediate values of these rates (20–30 % increase per five years) the probability of such conflicts was close to 50 %, that is one chance out of two. However, even for this group of countries there was not a single occurrence of a particularly violent internal political upheaval in the given period. In countries with high (30–45 % increase per five years) young urban population growth rates the probability of avoiding the major internal political upheavals falls down to a very low level (about one chance out of four). Besides, the probability of particularly violent civil wars becomes very high in these countries (also about one chance out of four).
However, particularly deep internal political problems were encountered in those countries in which the young urban population growth rates were very high (> 45 % increase per five years) in the period under consideration. Out of 34 countries of this group NOT A SINGLE ONE managed to avoid major political shocks. Besides, the risk of particularly violent civil war occurrence was very high for these countries (about one chance out of two).
Forecasting the Dynamics of Sociopolitical Instability in the African Countries in 2020–2050
The results obtained in our research can well be used for predicting the risks of sociopolitical instability for the countries being on the verge of escaping from the Malthusian trap, in the process of escape, or having escaped from it recently.
Working out of such forecasts is currently made remarkably easier by the fact that UN Population Division has developed urbanization dynamics forecasts for all the African countries, as well as age structure dynamics forecasts up to 2050 (UN Population Division 2010). Synthesis of these predictions allowed us to make a synthetic forecast regarding the dynamics of structural-demographic instability for the African countries in this period.
It is noteworthy that in our prediction only ‘positive results’ are really significant (i.e. the results revealing the presence of high political instability risk in a certain country in a certain period). We are inclined to interpret such results as an evidence of a real risk of political instability in the given place at the given time (if, of course, respective governments do not undertake adequate measures in proper time). On the other hand, in our opinion, ‘negative results’ cannot be viewed as a guarantee of absence of political upheavals in the given country up to 2050 (as we do not claim that the reasons of violent political upheavals can be reduced to structural-demographic factors only).
 Our forecast has produced rather different results for different Subsaharan African countries.
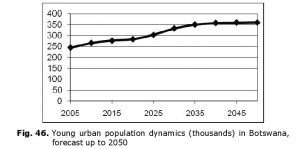
No serious demographic structural risks of the type in questions are forecasted after 2015 for some Subsaharan countries (especially in Southern Africa). Let us regard, for example, the forecast for Botswana (see Fig. 46):
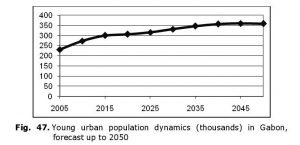
No serious structural-demographic risks of this type are forecasted for many countries of Tropical Africa, for example, Gabon (see Fig. 47):
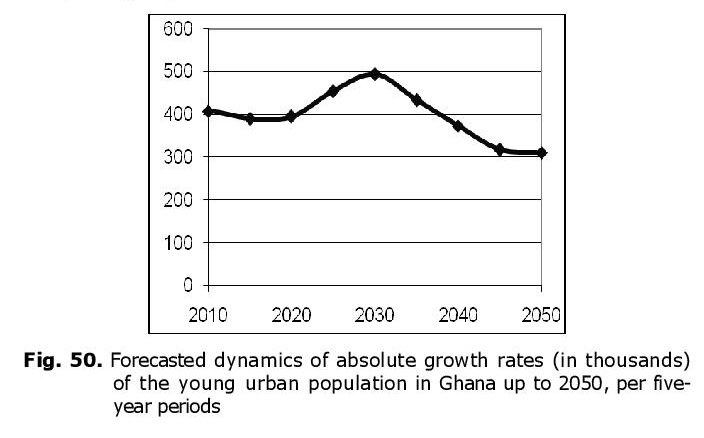
 While in the Gabon case the young urban population growth curve quite clearly demonstrates the absence of major structural-demographic risks, for some other Tropical African countries it is necessary (in order to detect it) to carry out an analysis of time series generated by our forecast. A bright example here is represented by the Ghana case (see Fig. 48).
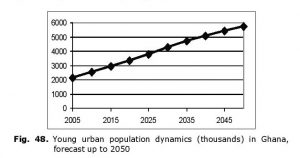 Indeed, in application to Ghana the forecasted situation may seem truly threatening, as by 2050 the young urban population there is likely to grow almost threefold (i.e., 200 %; while in the cases considered above this growth did not exceed 50 %).
However, a simple analysis of the corresponding time series shows that the situation is not so threatening. Indeed, the forecasted dynamics of relative growth rates of the young urban population has the following shape (Fig. 49).
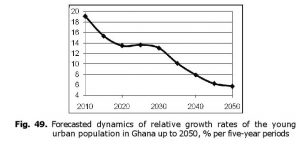
Thus, in the following decade urban youth relative growth rates are forecasted to be decreasing in Ghana up to a quite safe level of less than 14 % during
five years; in the 2020s these rates are going to stabilize (at the same rather safe level), while after 2030 they will decline further on. A similar dynamics is demonstrated by the absolute growth rates of the young urban population (see Fig. 50).
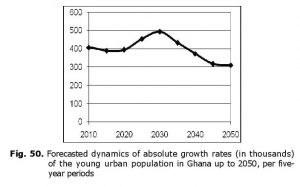
Thus, no increase in absolute growth rates of the young urban population is forecasted in Ghana for the next decade. According to the same forecast, a certain increase in these rates is expected in the 2020s, but it will be very moderate (25 % during ten years). After 2030 the absolute growth rates are forecasted to start declining, and by the 2040s they are expected to fall below the current level.
However, the forecast indicates the presence of high structural-demo-graphic risks for a wide range of Tropical African countries (see Table 6 below for a full list). Fortunately, in no case the urban youth growth rates are forecasted to exceed the critical level of 45 % per five years (let us remember that in the recent decades not a single country which crossed this level managed to avoid major internal sociopolitical conflicts, while in half of the cases particularly violent internal political upheavals occurred). Along with that, a number of tropical African countries are forecasted to get into a very dangerous zone of 30–45 % (let us remember that in the recent decades only a quarter of countries found in this zone managed to avoid major internal political conflicts, while in a quarter of cases particularly violent internal political upheavals were observed).
 Tanzania is among the countries of high structural-demographic risk.
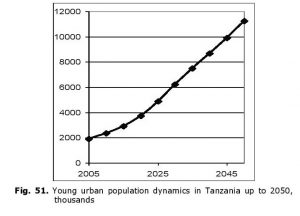
The general dynamics of the urban population in this country is forecasted as follows (see Fig. 51):
Thus, in 2005–2050 an almost six-fold increase in the young urban population is forecasted for Tanzania, while in the 2020s the relative growth rates of this indicator will exceed the critical level of 30 % per five years.
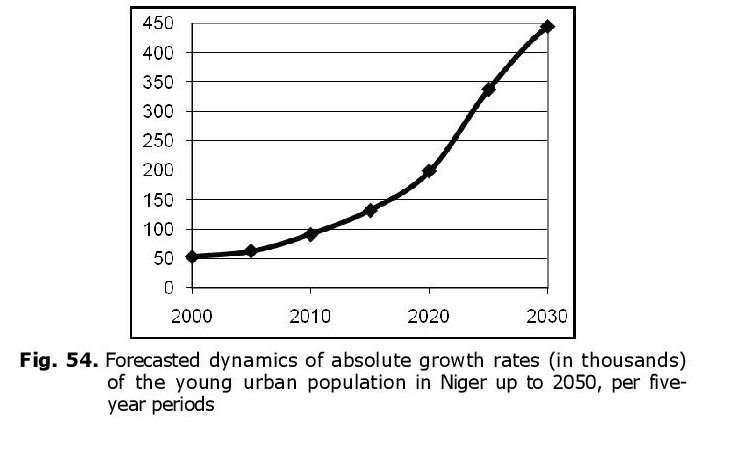
However, the most serious structural-demographic risks are predicted for Niger (see Fig. 52):
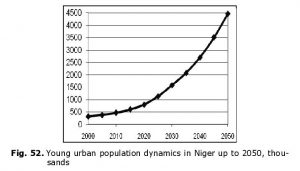
Thus, in 2000–2050 the young urban population of Niger will increase by an order of magnitude, while in the second half of the 2010s the relative growth rates of this indicator will exceed the critical level of 30 % per five years, while in the early 2020s they will exceed an even more dangerous level of 40 % during five years. These rates will decrease to relatively safe levels only in the late 2040s (see Fig. 53).
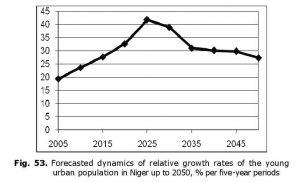
Besides, in Niger an increase by an order of magnitude (in comparison to 2000 level) in the absolute growth rates of the young urban population is forecasted by 2030 (see Fig. 54).

In conclusion, let us present a summary forecast of structural-demographic risks of political destabilization in the Subsaharan African countries up to 2050 (see Table 6).
| Country |
Years of maximum urban youth growth rates |
Urban youth growth rates (% in five years) in those years |
Period of particularly high structural-demographic risks of political destabilization |
Structural-demographic risk level |
| Niger |
2021–2025 |
41.8 |
2021–2030 |
Very high |
| Malawi |
2016–2020 |
39 |
2015–2025 |
High |
| Burkina Faso |
2021–2025 |
38.7 |
2021–2030 |
High |
| Uganda |
2021–2025 |
33.1 |
2021–2030 |
High |
| Eritrea |
2021–2025 |
32.5 |
2021–2030 |
High |
| Tanzania |
2021–2025 |
30.6 |
2021–2030 |
High |
| Kenya |
2021–2025 |
30.2 |
2021–2030 |
High |
| Rwanda |
2021–2025 |
29.6 |
2021–2030 |
Medium |
| Chad |
2016–2020 |
28.5 |
2016–2025 |
Medium |
| Burundi |
2026–2030 |
28.1 |
2026–2035 |
Medium |
| Congo, Dem. Rep. |
2016–2020 |
27.7 |
2016–2025 |
Medium |
| Mozambique |
2021–2025 |
27.4 |
2021–2030 |
Medium |
| Somalia |
2016–2020 |
27.4 |
2016–2025 |
Medium |
| Ethiopia |
2016–2020 |
26.7 |
2016–2025 |
Medium |
| Gambia |
2016–2020 |
26.5 |
2016–2025 |
Medium |
| Sierra Leone |
2016–2020 |
25.4 |
2016–2025 |
Medium |
| Madagascar |
2016–2020 |
25.2 |
2016–2020 |
Medium |
Table 6
NOTES
* This research has been supported by the Russian Science Foundation (Project No 14-11-00634).
[1] This is a modified and extended version of the article originally published in Cliodynamics (A Trap at the Escape from the Trap? Demographic-Structural Factors of Political Instability in Modern Africa and West Asia. Cliodynamics 2(2) (2011): 1–28. URL: http://escholarship.org/uc/item/ 79t737gt).
[2] Using the terminology of non-linear dynamics one can also denote it as the low-level equilibrium attractor (cf. Nelson 1956).
[3] This was already noticed, for example, by Mann: ‘The … decline in population growth during the nineteenth century owed much to a rise in female infanticide, itself a direct response to declining economic opportunity’ (Mann 2002: 451).
[4] Note that the colossal sweep of their rebellion was determined up to a very significant degree just by Malthusian factors.
[5] Naturally, the 1997 sociopolitical collapse led to a certain decline in the average per capita food consumption (below 2700 kcal per day), which was still above the level recommended by the WHO; whereas later the growth of this indicator resumed (FAO 2014).
[6] Note that, as these are young males (rather than females) that tend to migrate from the rural to urban areas, we have an especially explosive growth of young male urban population, which has a particularly destabilizing effect.
[7] General number of deaths in Ethiopia and Eritrea in 1962–1992.
[8] مشكلة السكان فى مصر، دراسة اجتماعية اقتصادية / تأليف صلاح الدين نامق. القاهرة: مكتبة النهضة المصرية، 1952.
References
Abrahamian E. 2008. A History of Modern Iran. Cambridge, UK: Cambridge University Press.
Adejumobi S. A. 2007. The History of Ethiopia. Westport, CT: Greenwood.
Akaev A. A. 2010. Modern Financial and Economic Crisis in the Light of the Theory of the Economy’s Innovative and Technological Development of Economy and Controlling of Innovative Process. System Monitoring of Global and Regional Development / Ed. by D. A. Khaltourina, and A. V. Korotayev, pp. 230–258. Moscow: Librokom. In Russian (Акаев А. А. Современный финансово-экономический кризис в свете теории инновационно-технологического развития экономики и управления инновационным процессом. Системный мониторинг глобального и регионального развития / Ред. Д. А. Халтурина, А. В. Коротаев, с. 230–258. М.: Либроком/URSS).
Akokpari J. 2007. ‘You Don’t Belong Here’: Citizenship and Africa’s Conflicts – Reflections on Ivory Coast. African Conflicts: Management, Resolution and Post-conflict Recovery and Development / Ed. by P. Zeleza, pp. 88–105. Oxford: James Currey.
Artzrouni M., and Komlos J. 1985. Population Growth through History and the Escape from the Malthusian Trap: A Homeostatic Simulation Model. Genus 41(3–4): 21–39.
Bray F. 1984. Biology and Biological Technology. Part 2, Agriculture. Science and Civilisation in China / ed. by J. Needham. vol. 6. p. 2. Cambridge, UK; New York: Cambridge University Press.
Bercovitch J., and Jackson R. 1997. International Conflict: A Chronological Encyclopedia of Conflicts and Their Management, 1945–1995. Washington: Congressional Quarterly.
Chao Kang. 1986. Man and Land in Chinese History. An Economic Analysis. Stanford, CA: Stanford University Press.
Chesnais J. C. 1992. The Demographic Transition: Stages, Patterns, and Economic Implications. Oxford: Clarendon Press.
Chu C. Y. C., and Lee R. D. 1994. Famine, Revolt, and the Dynastic Cycle: Population Dynamics in Historic China. Journal of Population Economics 7: 351–378.
Cleveland W. 1936. The Population Problem in Egypt. A Study of Population Trends and Conditions in Modern Egypt. Lancaster, PN: Science Press.
Clodfelter M. 1992. Warfare and Armed Conflict: A Statistical Reference to Casualty and Other Figures, 1618–1991. 2 vols. London: McFarland.
Craig J. I. 1917. The Census of Egypt. L’Egypte Contemporaine 8: 209–234.
Crowder M., Fage J. D., and Oliver R. (Eds.) 1986. The Cambridge History of Africa. Vol. 8. New York: Cambridge University Press.
Dikarev A. D. 1991. Some Problems of Growth and Records of Population in the Sin Epoch. Social-Economic and Political Problems of China in the New and Modern Ages / Ed. by G. D. Sukharchuk, pp. 58–91. Moscow: Nauka. In Russian (Дика-рев А. Д. Некоторые проблемы роста и учёта населения в эпоху Цин. Социально-экономические и политические проблемы Китая в новое и новейшее время / Ред. Г. Д. Сухарчук, с. 58–91. М.: Наука).
Fairbank J. K. 1992. China: A New History. Cambridge, MA: Belknap.
FAO (Food and Agriculture Organization of the United Nation). 2014. FAOSTAT. Food and Agriculture Organization Statistics. URL: http://faostat.fao.org/.
Fisk R. 1990. Pity the Nation. London: Touchstone.
Foerster H. von, Mora P., and Amiot L. 1960. Doomsday: Friday, 13 November, A.D. 2026. Science 132: 1291–1295.
Frenkel M. Yu. 1999. History of Liberia in the Modern and Contemporary Era. Moscow: Vostochnaya literatura. In Russian (Френкель М. Ю. История Либерии в новое и новейшее время. М.: Восточная литература).
Friedman T. 1998. From Beirut to Jerusalem. London: HarperCollins.
Fuller G. E. 2004. The Youth Crisis in Middle Eastern Society. Clinton Township, MI: Institute for Social Policy and Understanding.
Goldstone J. 1991. Revolution and Rebellion in the Early Modern World. Berkeley, CA: University of California Press.
Goldstone J. 2002. Population and Security: How Demographic Change Can Lead to Violent Conflict. Journal of International Affairs 56(1): 3–22.
Goldstone J. A., Gurr T. R., Harff B., Levy M. A., Marshall M. G., Bates R. H., Epstein D. L., Kahl C. H., Surko P. T., Ulfelder J. C., Unger Jr., and Unger A. N. 2000. State Failure Task Force Report: Phase III Findings. McLean, VA: Science Applications International Corporation (SAIC). URL: http://www.cidcm.umd.edu/ inscr/stfail/.
Grinin L. E. 2006. Productive Forces and Historical Process. 4th ed. Moscow: URSS. In Russian (Гринин Л. Е. Производительные силы и исторический процесс. 4-е изд. М.: УРСС).
Grinin L. E. 2007. Some Reflections Concerning the Nature of Laws Connected with Demographic Cycles (Raising the Question of Common Methodological Approaches to the Analysis of Demographic Cycles). History and Mathematics: Conceptual Space and Courses of Search / P. V. Turchin, L. E. Grinin, S. Yu. Malkov, and A. V. Korotayev (eds.), pp. 219–246. Moscow: LKI/URSS. In Russian (Гринин Л. Е. Некоторые размышления по поводу природы законов, связанных с демографическими циклами (к постановке проблемы определения общих методологических подходов к анализу демографических циклов). История и математика: Концептуальное пространство и направления поиска / Ред. П. В. Турчин, Л. Е. Гринин, С. Ю. Малков, А. В. Коротаев, c. 219–246. М.: ЛКИ/URSS).
Grinin L. E. 2010. Malthusian-Marxian Trap and the Russian Revolutions. History and Mathematics. On the Causes of the Russian Revolution / Ed. by L. E. Grinin, A. V. Korotayev, S. Yu. Malkov, pp. 368–427. Moscow: LKI/URSS. In Russian. (Гринин Л. Е. Мальтузианско-марксова «ловушка» и русские революции. История и математика. О причинах Русской революции / Ред. Л. Е. Гринин, А. В. Коротаев, С. Ю. Малков, c. 198–224. М.: ЛКИ/URSS).
Grinin L. E., and Korotayev A. V. 2009. Urbanization and Political Instability: Working out Mathematical Models of Political Processes. Polis 4: 34–52. In Russian (Гринин Л. Е., Коротаев А. В. Урбанизация и политическая нестабильность: к разработке математических моделей политических процессов. Политические исследования 4: 34–52).
Grinin L., and Korotayev A. 2012. Does ‘Arab Spring’ Mean the Beginning of World System Reconfiguration? World Futures 68(7): 471–505.
Grinin L. E., Korotayev A. V., and Malkov S. Yu. 2008. Mathematical Models of Socio-Demographic Cycles and Escape from the Malthusian Trap. Problems of Mathematical History: Mathematical Modeling of Historical Processes / Ed. by G. G. Malinetsky and A. V. Korotayev, pp. 78–117. Moscow: URSS. In Russian (Гринин Л. Е., Коротаев А. В., Малков С. Ю. Математические модели социально-демографических циклов и выхода из мальтузианской ловушки. Проблемы математической истории. Математическое моделирование исторических процессов / Ред. Г. Г. Малинецкий, А. В. Коротаев, с. 78–117. М.: URSS).
Grinin L. E., Malkov S. Yu., Gusev V. A., and Korotayev A. V. 2009. Possible Directions for Further Development of Socio-Demographic Cycle Theory and Mathematical Models of the Escape from the Malthusian Trap. History & Mathematics: Processes & Models / Ed. by S. Yu. Malkov, L. E. Grinin, and A. V. Korotayev (eds.), pp. 134–210. Moscow: URSS. In Russian (Гринин Л. Е., Малков С. Ю., Гусев В. А., Коротаев А. В. Некоторые возможные направления развития теории социально-демографических циклов и математические модели выхода из мальтузианской ловушки. История и Математика: процессы и модели / Ред. С. Ю. Малков, Л. Е. Гринин, А. В. Коротаев, с. 134–210. М.: URSS).
Haldane J. T. 1989. Weak Oil Market Hampering Arab Development Efforts. Washington Report on Middle East Affairs January: 39.
Heijdra M. 1998. The Socio-Economic Development of Rural China during the Ming. Twitchett, D., and Mote, F. W. (eds.), The Cambridge History of China. Vol. 8. The Ming Dynasty, 1368–1644. Part II, pp. 417–578. Cambridge: Cambridge University Press.
Heinsohn G. 2003. Söhne und Weltmacht. Terror im Aufstieg und Fall der Nationen. Zürich: Orell Füssli Verlag.
Hirst D. 1977. How High Life and Scandal Rocked Sadat. MERIP Reports 54: 19–20.
Ho Ping-ti. 1955. The Introduction of American Food Plants into China. American Anthropologist 57: 191–201.
Ho Ping-ti. 1959. Studies on the Population of China, 1368–1953. Cambridge, MA: Harvard University Press.
Huang P. C. C. 2002. Development or Involution in Eighteenth-Century Britain and China? The Journal of Asian Studies 61: 501–538.
Huband M. 1998. The Liberian Civil War. London: Frank Cass.
Ilyushechkin V. P. 1967. The Taipings’ Peasant War. Moscow: Nauka. In Russian (Илюшечкин В. П. Крестьянская война тайпинов. М.: Наука).
Jarvis C. 1999. The Rise and Fall of the Pyramid Schemes in Albania. IMF Working Paper 99/98.Washington: International Monetary Fund.
Jomard E. F. 1818. Mémoire sur la population contemporaine de l’Egypte ancienne et moderne. Description de l’Égypte, ou, Recueil de observations et des recherches qui ont été faites en Égypte pendant l’éxpédition de l’armée française / Ed. E. F. Jomard. Vol. II–1, pp. 87–142. Paris: Imprimerie impériale.
Kepel G. 2004. The Jihad. The Expansion and Decline of Islam. Moscow: Ladomir. In Russian (Кепель, Ж. Джихад. Экспансия и закат исламизма. М.: Ладомир).
Kepel G. 2006. Jihad: The Trail of Political Islam. 4th ed. London: Tauris.
van Kessel-Hagesteijn R. 2009. Dynamics in Political Centralization Processes – The Various Faces of ‘Decline’. International Symposium on Early State Formation Handbook, pp. 46–63. Peking: National Academy of China.
Kögel T., and Prskawetz A. 2001. Agricultural Productivity Growth and Escape from the Malthusian Trap. Journal of Economic Growth 6: 337–357.
Komlos J., and Artzrouni M. 1990. Mathematical Investigations of the Escape from the Malthusian Trap. Mathematical Population Studies 2: 269–287.
Komlos J., and Nefedov S. 2002. A Compact Macromodel of Pre-industrial Population Growth. Historical Methods 35: 92–94.
Korotayev A. 2006. The World System Urbanization Dynamics: A Quantitative Analysis. History & Mathematics: Historical Dynamics and Development of Complex Societies / Ed. by P. Turchin, L. Grinin, A. Korotayev, and V. C. de Munck, pp. 44–62. Moscow: KomKniga/URSS.
Korotayev A., and Khaltourina D. 2006. Introduction to Social Macrodynamics: Secular Cycles and Millennial Trends in Africa. Moscow: KomKniga/URSS.
Korotayev A. V., Khaltourina D. A., Malkov A. S., Bogevolnov J. V., Kobzeva S. V., and Zinkina J. V. 2010. Laws of History: Mathematical Modeling and Forecasting World and Regional Development. Moscow: URSS. In Russian (Коротаев А. В., Халтурина Д. А., Малков А. С., Божевольнов Ю. В., Кобзева С. В., Зинькина Ю. В. Законы истории. Математическое моделирование и прогнозирование мирового и регионального развития. 3rd ed. М.: URSS).
Korotayev A., Malkov A., and Khaltourina D. 2006a. Introduction to Social Macrodynamics: Compact Macromodels of the World System Growth. Moscow: URSS.
Korotayev A., Malkov A., and Khaltourina D. 2006b. Introduction to Social Macro-dynamics: Secular Cycles and Millennial Trends. Moscow: KomKniga/URSS.
Korotayev A. V., Komarova N. L., and Khaltourina D. A. 2007. Laws of History: Secular Cycles and Millennial Trends. Moscow: URSS. In Russian (Коротаев А. В., Комарова Н. Л., Халтурина Д. А. Законы истории. Вековые циклы и тысячелетние тренды. М.: URSS).
Korotayev A., and Zinkina J. 2011. Egyptian Revolution: A Demographic Structural Analysis. Entelequia. Revista Interdisciplinar 13: 139–169.
Kuhn P. A. 1978. The Taiping Rebellion. The Cambridge History of China. Vol. 1. Late Ch’ing, 1800 – 1911. Part 1 / Ed. by D. Twitchett, and J. K. Fairbank, pp. 264–317. Cambridge, UK: Cambridge University Press.
Kulpin E. S. 1990. Man and Nature in China. Moscow: Nauka. In Russian (Кульпин Э. С. Человек и природа в Китае. М.: Наука).
Larin V. L. 1986. Rebellion of Peoples of Southwestern China in the 1850s – 1870s. Moscow: Nauka. In Russian (Ларин В. Л. Повстанческая борьба народов Юго-Западного Китая в 50–70-х годах XIX века. М.: Наука).
Lavely W., and Wong R. B. 1998. Revising the Malthusian Narrative: The Comparative Study of Population Dynamics in Late Imperial China. The Journal of Asian Studies 57: 714–748.
Lee J. 1982. Food Supply and Population Growth in South-West China, 1250–1850. Journal of Asian Studies 41: 711–746.
Lee J., Campbell C., and Guofu Tan. 1992. Infanticide and Family Planning in Late Imperial China: The Price and Population History of Rural Liaoning, 1774–1873. Chinese History in Economic Perspective / Ed. by T. G. Rawski, L. M. Li, pp. 145–176. Berkeley, CA: University of California Press.
Lee J., and Wang Feng. 1999. One Quarter of Humanity: Malthusian Mythology and Chinese Realities, 1700–2000. Cambridge, MA: Harvard University Press.
Lewis L. S. 2002. Laying Claim to the Memory of May: A Look Back at the 1980 Kwangju Uprising. Honolulu, HI: University of Hawaii Press.
Liu Kwang-Ching. 1978. The Ch’ing Restoration. The Cambridge History of China. Vol. 10. Part 1. Late Ch’ing, 1800 –1911 / Ed. by D. Twitchett, J. K. Fairbank, pp. 409–490. Cambridge, UK: Cambridge University Press.
Lorraine G. (Ed.) 1995. Our Times: The Illustrated History of the 20th Century. New York: Turner.
Maddison A. 2001. Monitoring the World Economy: A Millennial Perspective. Paris: OECD.
Maddison А. 2010. World Population, GDP and Per Capita GDP, A.D. 1–2003. URL: www.ggdc.net/maddison.
Malkov S. Yu. 2002. Mathematical Modeling of Historical Processes. The New Ideas in Synergetics. Vision of the Third Millennium / Ed. by G. G. Malinetsky, and S. P. Kurdyumov, pp. 291–323. Moscow: Nauka. In Russian (Малков С. Ю. Математическое моделирование исторических процессов. Новое в синергетике. Взгляд в третье тысячелетие / Ред. Г. Г. Малинецкий, С. П. Курдюмов, с. 291–323. М.: Наука).
Malkov S. Yu. 2003. Mathematical Modeling of Social Processes Dynamics. Links of Times / Ed. by I. L. Zherebtsov. Vol. 2, pp. 190–214. Moscow: MGVP KOKS. In Russian (Малков С. Ю. Математическое моделирование динамики общественных процессов. Связь времен / Ред. И. Л. Жеребцов. Т. 2, с. 190–214. М.: МГВП КОКС).
Malkov S. Yu. 2004. Mathematical Modeling of the Historical Dynamics: Approaches and Models. Modeling the Socio-political and Economic Dynamics / Ed. by M. G. Dmitriyev, pp. 76–188. Moscow: Russian State University for Social Studies. In Russian (Малков С. Ю. Математическое моделирование исторической динамики: подходы и модели. Моделирование социально-политической и экономической динамики / Ред. М. Г. Дмитриев, с. 76–188. М.: РГСУ).
Malkov S. Yu. 2009. Social Self-Organization and Historical Process: Potentials of Mathematical Modelling. Moscow: Librokom/URSS. In Russian (Малков С. Ю. Социальная самоорганизация и исторический процесс: возможности математического моделирования. М.: Либроком/URSS).
Malkov S. Yu., Kosse Yu. V., Bakulin V. N., and Sergeyev A. V. 2002. Social-Economic and Demographic Dynamics in Agrarian Societies. Matematicheskoye modelirovaniye 14(9): 103–108. In Russian (Малков С. Ю., Коссе Ю. В., Баку-лин В. Н., Сергеев А. В. Социально-экономическая и демографическая динамика в аграрных обществах. Математическое моделирование 14(9): 103–108).
Malkov S. Yu., Kovalyov V. I., and Malkov A. S. 2000. The History of Mankind and Stability (Mathematical Modelling). Strategicheskaya stabilnost 3: 53–66. In Russian (Малков С. Ю., Ковалев В. И., Малков А. С. История человечества и стабильность (опыт математического моделирования). Стратегическая стабильность 3: 52–66).
Malkov S. Yu., and Malkov A. S. 2000. History in the Context of Mathematical Modelling. History For and Against History / Ed. by Yu. M. Osipov, I. V. Bestuzhev-Lada, E. S. Zotova, and G. R. Naumova. Vol. 2, pp. 54–76. Moscow: Centre for Social Sciences. In Russian (Малков С. Ю., Малков А. С. История в свете математического моделирования. История за и против истории / Ред. Ю. М. Осипов, И. В. Бестужев-Лада, Е. С. Зотова, Г. Р. Наумова. кн. 2, с. 54–76. М.: Центр общественных наук).
Malkov S. Yu., Selunskaya N. B., and Sergeyev A. V. 2005. Socioeconomic and Demographic Processes in Agrarian Society as an Object of Mathematical Modeling. History and Synergetics: Mathematical Modeling of Social Dynamics / Ed. by S. Yu. Malkov, and A. V. Korotayev, pp. 70–87. Moscow: URSS. In Russian (Малков С. Ю., Селунская Н. Б., Сергеев А. В. Социально-экономические и демографические процессы в аграрном обществе как объект математического моделирования. История и синергетика: Математическое моделирование социальной динамики / Ред. С. Ю. Малков, А. В. Коротаев, c. 70–87. М.: КомКнига/ URSS).
Malkov S. Yu., and Sergeyev A. V. 2002. Mathematical Modeling of Social Economic Stability of Developing Society. Strategucheskaya stabilnist 4: 54–61. In Russian (Малков С. Ю., Сергеев А. В. Математическое моделирование социально-экономической устойчивости развивающегося общества. Стратегическая стабильность 4: 54–61).
Malkov S. Yu., and Sergeyev A. V. 2004a. Mathematical Modeling of Economic and Demographic Processes in Agrarian Societies. Moscow: Keldysh Institute of Applied Mathematics. In Russian (Малков С. Ю., Сергеев А. В. Математическое моделирование экономико-демографических процессов в аграрном обществе. М.: Институт прикладной математики им. М. В. Келдыша РАН).
Malkov S. Yu., and Sergeyev A. V. 2004b. Assessment of Stability of Social Systems Based on Economic-Demographical Modeling. The Problems of Complex Systems Safety Management / Ed. by N. I. Arkhipova, V. V. Kulba, pp. 356–359. Moscow: RGGU. In Russian (Малков С. Ю., Сергеев А. В. Оценка устойчивости социальных систем на основе экономико-демографического моделирования. Проблемы управления безопасностью сложных систем / Ред. Н. И. Архипова, В. В. Кульба, c. 356–359. М.: РГГУ).
Malthus T. 1798. An Essay on the Principle of Population, as It Affects the Future Improvement of Society, with Remarks on the Speculations of Mr Godwin, M. Condorcet and Other Writers. London: J. Johnson.
Malthus T. 1978 [1798]. Population: The First Essay. Ann Arbor, MI: University of Michigan Press.
Mann S. 2002. Women, Families, and Gender Relations. The Cambridge History of China. Vol. 9. Part 1. The Ch’ing Empire to 1800 / Ed. by W. J. Peterson, pp. 428–472. Cambridge, UK: Cambridge University Press.
McCarthy J. A. 1976. Nineteenth-Century Egyptian Population. Middle Eastern Studies 12(3): 1–39.
McKendrick A. G. 1926. Applications of Mathematics to Medical Problems. Proceedings of the Edinburgh Mathematical Society 44: 98–130.
Mesquida C. G., and Weiner N. I. 1999. Male Age Composition and Severity of Conflicts. Politics and the Life Sciences 18: 113–117.
Moller H. 1968. Youth as a Force in the Modern World. Comparative Studies in Society and History 10: 238–260.
Montgomery T. S. 1995. Revolution in El Salvador: From Civil Strife to Civil Peace. Boulder, CO: Westview Press.
Mote F. W. 1999. Imperial China 900–1800. Cambridge, MA: Harvard University Press.
Murguzin A. S. 1986. Role of Natural and Demographical Factors in Dynamics of Medieval China’s Agrarian Sector (on the Problem of Cyclicity of Precapitalist Reproduction). Historical Factors of Social Reproduction in the Eastern Countries / ed. by L. I. Reisner, B. I. Slavnyi, pp. 11–44. Moscow: Nauka. In Russian (Муг-рузин А. С. Роль природных и демографических факторов в динамике аграрного сектора средневекового Китая (к вопросу о цикличности докапиталистического воспроизводства). Исторические факторы общественного воспроизводства в странах Востока / Ред. Л. И. Рейснер, Б. И. Славный, c. 11–44. М.: Наука).
Murguzin A. S. 1994. The Agrarian-Peasant Problem in China. Moscow: Nauka. In Russian (Мугрузин А. С. Аграрно-крестьянская проблема в Китае. М.: Наука).
Myers R. H., and Wang Yeh-chien. 2002. Economic Developments, 1644–1800. The Cambridge History of China. Vol. 9. Part 1. The Ch’ing Empire to 1800 / Ed. by W. J. Peterson, pp. 563–645. Cambridge, UK: Cambridge University Press.
Naiken L. 2002. FAO methodology for estimating the prevalence of undernourishment. Paper presented at International Scientific Symposium on Measurement and Assessment of Food Deprivation and Undernutrition, Rome, Italy. URL: www.fao.org.
Nāmiq Ṣalāḥ al-Dīn. 1952. Mushkilat al-sukkān fī Miṣr: dirāsah ijtimā‘iyyah iqtiṣādiyyah. al-Qāhirah: Maktabat al-Nahḍah al-Miṣriyyah.[8]
Nefedov S. A. 1999a. The Method of Demographic Cycles in Research of Socio-Economic History of Pre-industrial Society. PhD Thesis (history). Ekaterinburg: Ural State University. In Russian (Нефедов С. А. Метод демографических циклов в изучении социально–экономической истории допромышленного общества. Автореферат дис. … канд. ист. наук. Екатеринбург: Уральский государственный университет).
Nefedov S. A. 1999b. On Demographic Cycles in Babylonia’s History. Manuscript. Moscow. URL: http://www.hist1.narod.ru/ Science/ Babilon/Vavilon.html. In Russian (Нефедов С. А. О демографических циклах в истории Вавилонии. Рукопись (#54930), депонированная в ИНИОН РАН, М. URL: http://www.hist1.narod.ru/ Science/ Babilon/Vavilon.html).
Nefedov S. A. 1999c. On Demographic Cycles in Ancient Egypt’s History. Manuscript. Moscow. URL: http://www.hist1.narod.ru/ Science/ Egipt/Egipt.html. In Russian (Нефедов С. А. О демографических циклах в истории Древнего Египта. Рукопись (#54931), депонированная в ИНИОН РАН, М. URL: http://www.hist1. narod.ru/ Science/ Egipt/Egipt.html).
Nefedov S. A. 1999d. On Demographic Cycles in Medieval China’s History. Manuscript. Moscow. URL: http://www.hist1.narod.ru/ Science/ China/China.html. In Russian (Нефедов С. А. О демографических циклах в средневековой истории Китая. Рукопись (#54932), депонированная в ИНИОН РАН, М. URL: http://www.hist1.narod.ru/ Science/ China/China.html).
Nefedov S. A. 1999e. An Attempt of Imitation Modeling Demographic Cycles. Manuscript. Moscow. URL: http://www.hist1.narod.ru/ Science/Cycle/Cycle.html. In Russian (Нефедов С. А. Опыт имитационного моделирования демографического цикла. Рукопись (#54933), депонированная в ИНИОН РАН, М. URL: http://www.hist1.narod.ru/ Science/Cycle/Cycle.html).
Nefedov S. A. 2000a. On Demographic Cycles in China’s History (XVI–XIX Centuries). Manuscript. Moscow. URL: http://www.hist1.narod.ru/ Science/China/China1.html. In Russian (Нефедов С. А. О демографических циклах в истории Китая (XIV–XIX вв.). Рукопись (#128367), депонированная в ИНИОН РАН, М. URL: http://www.hist1.narod.ru/ Science/China/China1.html).
Nefedov S. A. 2000b. On History Laws and Mathematical Models. Izvestiya Uralskogo gosudarstvennogo universiteta 15: 15–23. In Russian (Нефедов С. А. О законах истории и математических моделях. Известия Уральского государственного университета 15: 15–23).
Nefedov S. A. 2001a. Method of Demographic Cycles. Uralski istoricheski vestnik 7: 93–107. In Russian (Нефедов С. А. Метод демографических циклов. Уральский исторический вестник 7: 93–107).
Nefedov S. A. 2001b. On Demographic Cycles in India’s History. Manuscript. Moscow. URL: http://www.hist1.narod.ru/Science/India/india.html. In Russian (Нефедов С. А. О демографических циклах в истории Индии. Рукопись (#556324), депонированная в ИНИОН РАН, М. URL: http://www.hist1.narod.ru/Science/ India/india.html).
Nefedov S. A. 2002a. An attempt of Modeling a Demographic Cycle. Informatsionny byulleten assotsiatsii ‘Istoriya I kompyuter’ 29: 131–142. In Russian (Нефе-дов С. А. Опыт моделирования демографического цикла. Информационный бюллетень ассоциации ‘История и компьютер’ 29: 131–142).
Nefedov S. A. 2002b. On the Theory of Demographic Cycles. Ekonomicheskaya istoriya 8: 116–121. In Russian (Нефедов С. А. О теории демографических циклов. Экономическая история 8: 116–121).
Nefedov S. A. 2003. The Theory of Demographic Cycles and Social Evolution of Ancient and Medieval Eastern Societies. Vostok 3: 5–22. In Russian (Нефедов С. А. Теория демографических циклов и социальная эволюция древних и средневековых обществ Востока. Восток 3: 5–22).
Nefedov S. A. 2004. A Model of Demographic Cycles in Traditional Societies: The Case of Ancient China. Social Evolution & History 3(1): 69–80.
Nefedov S. A. 2005. Demographic-Structural Analysis of Socioeconomic History of Russia. The Late 15th – the Early 20th Centuries. Ekaterinburg: Izdatelstvo UGGU. In Russian (Нефедов С. А. Демографически-структурный анализ социально-экономической истории России. Конец XV – начало XX века. Екатеринбург: Издательство УГГУ).
Nefedov S. A. 2007. The Concept of Demographic Cycles. Ekaterinburg: Izdatelstvo UGGU. In Russian (Нефедов С. А. Концепция демографических циклов. Екатеринбург: Издательство УГГУ).
Nefedov S. A. 2008. The Factor Analysis of the Historical Process. Moscow: Territoriya buduschego. In Russian (Нефедов С. А. Факторный анализ исторического процесса. М.: Территория будущего).
Nefedov S. A. 2010. On the Causes of the Russian Revolution. On the Causes of the Russian Revolution / ed. by L. E. Grinin, A. V. Korotayev, and S. Yu. Malkov, pp. 25–60. Moscow: LKI/URSS. In Russian (Нефедов С. А. О причинах Русской революции. О причинах Русской революции / Ред. Л. Е. Гринин, А. В. Коротаев, С. Ю. Малков, c. 25–60. М.: ЛКИ/URSS).
Nefedov S. A., and Turchin P. V. 2007. An Attempt of Modeling Demographic-Structural Cycles. History and Mathematics: Macrohistorical Dynamics of the Society and State / ed. by S. Yu. Malkov, L. E. Grinin, and A. V. Korotayev, pp. 153–167. Moscow: KomKniga/URSS. In Russian (Нефедов С. А., Турчин П. В. Опыт моделирования демографически-структурных циклов. История и Математика: макроисторическая динамика общества и государства / Ред. С. Ю. Малков, Л. Е. Гринин, А. В. Коротаев, c. 153–167. М.: КомКнига/URSS).
Nelson R. R. 1956. A Theory of the Low Level Equilibrium Trap in Underdeveloped Economies. American Economic Review 46: 894–908.
Nepomnin O. E. 2005. History of China: Qing Epoch. The XVII – Early XX Centuries. Moscow: Vostochnaya literatura. In Russian (Непомнин О. Е. История Китая: Эпоха Цин. XVII – начало XX века. М.: Восточная литература).
Ototsky P. L. 2008. A Mathematical Model of the Regional Socio-Economic System Based on External Disturbance Effects. PhD Dissertation (Physics and Mathematics). Moscow. In Russian (Отоцкий П. Л. Математическая модель социально-экономической системы региона с учетом внешних возмущающих воздействий: дис. … канд. физ.-мат. наук. М.).
Palmowski J. 1997. Dictionary of Twentieth Century World History. Oxford: Oxford University Press.
Panzac D. 1987. The Population of Egypt in the Nineteenth Century. Asian and African Studies 21: 11–32.
Perkins D. H. 1969. Agricultural Development in China 1368–1968. Chicago, IL: Aldine.
Project Ploughshares. 2008. Armed Conflicts Report. URL: http://www.ploughshares. ca/ libraries/ ACRText/ACR-TitlePage.html.
Rowe W. T. 2002. Social Stability and Social Change. The Cambridge History of China. Vol. 9. Part 1. The Ch’ing Empire to 1800 / Ed. by W. J. Peterson, pp. 473–562. Cambridge, UK: Cambridge University Press.
Rummel R. J. 1994. Death by Government. New Brunswick, NJ: Transaction Publishers.
Sandstrom P., Sjöberg Ö. 1991. Albanian Economic Performance: Stagnation in the 1980s. Soviet Studies 43(5): 931–947.
Sarkees M. R. 1997. The ‘Correlates of War’ Data on War: An Update to 1997. Conflict Management and Peace Science 18: 123–144.
Small M., and Singer J. D. 1982. Resort to Arms: International and Civil Wars 1816–1980. Beverly Hills, CA: Sage Publications.
SPSS. 2010. World95 Database. Chicago, IL: SPSS Inc.
Steinmann G., and Komlos J. 1988. Population Growth and Economic Development in the Very Long Run: A Simulation Model of Three Revolutions. Mathematical Social Sciences 16: 49–63.
Steinmann G., Prskawetz A., and Feichtinger G. 1998. A Model on the Escape from the Malthusian Trap. Journal of Population Economics 11: 535–550.
Turchin P. 2003. Historical Dynamics: Why States Rise and Fall. Princeton, NJ: Princeton University Press.
Turchin P. 2005a. Dynamical Feedbacks between Population Growth and Sociopolitical Instability in Agrarian States. Structure and Dynamics 1.
Turchin P. 2005b. War and Peace and War: Life Cycles of Imperial Nations. New York: Pi Press.
Turchin P., and Korotayev А. 2006. Population Density and Warfare: A Reconsideration. Social Evolution & History 5(2): 121–158.
Turchin P., and Nefedov S. 2009. Secular Cycles. Princeton, NJ: Princeton University Press.
U.S. Bureau of the Census. 2010. World Population Information. URL: http:// www.census.gov/ipc/www/idb/worldpopinfo.php.
Totten S. (Ed.) 1997. Century of Genocide: Eyewitness Accounts and Critical Views. New York: Garland Publishing.
Turchin P. V. 2007. Historical Dynamics. Towards Theoretical History. Moscow: LKI/URSS. In Russian (Турчин П. В. Историческая динамика. На пути к теоретической истории. М.: ЛКИ/УРСС).
United Nations. 2005. Statistic Division of the United Nations. Topic 3660, ‘Nutrition, Minimum Energy Requirement, Kcal per Capita, per Day’ (FAO/WHO Estimates). New York: UN.
UN Population Division. 2010. United Nations. Department of Economic and Social Affairs. Population Division Database. URL: http://www.un.org/esa/population.
Usher D. 1989. The Dynastic Cycle and the Stationary State. The American Economic Review 79: 1031–1044.
Vasilyev A. M. (Ed.) 1990. The Arab Republic of Egypt. Moscow: Nauka. In Russian (Васильев А. М. (Ред.) Арабская Республика Египет. М.: Наука).
Vishnevski A. G. 1976. Demographic Revolution. Moscow: Statistika. In Russian (Вишневский А. Г. Демографическая революция. М.: Статистика).
Vishnevski A. G. 2005. Selected Works on Demography. Vol. 1. Demographic Theory and Demographic History. Moscow: Nauka. In Russian (Вишневский А. Г. Избранные демографические труды. Т. 1. Демографическая теория и демографическая история. М.: Наука).
Wallechinsky D. 1995. Twentieth Century: History with the Boring Parts Left Out. New York: Little Brown.
Weinbaum M. G. 1985. Egypt’s ‘Infitah’ and the Politics of US Economic Assistance. 21(2): 206–222.
White M. 2010a. Death Tolls for the Man-Made Megadeaths of the Twentieth Century. URL: http://users.erols.com/mwhite28/warstatx.htm.
White M. 2010b. Historical Atlas of the Twentieth Century. URL: http://users.erols. com/mwhite28/20century.htm.
Wiedl K. N. 2006. The Hama Massacre – Reasons, Supporters of the Rebellion, Consequences. München: GRIN Verlag.
Williams G. I. H. 2006. Liberia: The Heart of Darkness. Victoria: Trafford Publishing.
Wood J. W. 1998. A Theory of Preindustrial Population Dynamics: Demography, Economy, and Well-Being in Malthusian Systems. Current Anthropology 39: 99–135.
World Bank. 2014. World Development Indicators Online. Washington: World Bank, Electronic version. URL: http://data.worldbank.org/indicator.
Zelin M. 2002. The Yung-cheng Reign. The Cambridge History of China. Vol. 9. Part 1. The Ch’ing Empire to 1800 / Ed. by W. J. Peterson, pp. 183–229. Cambridge, UK: Cambridge University Press.
Zhao Wenlin and Xie Shujun-zhu. 1988. History of Chinese Population. Peking: People’s Publisher (in Chinese).
Zinkina Yu. V. 2010. Trends of Political-Demographic Dynamics and Perspectives of Maintenance of Political Stability in the Countries of Near and Middle East and East Africa in the Context of Structural-Demographic Theory. Systemic Monitoring of Global and Regional Risks / Ed. by D. A. Khaltourina, A. V. Korotayev, Yu. V. Zinkina, pp. 141–283. Moscow: Librokom/URSS. In Russian (Зинькина Ю. В. Тенденции политико-демографической динамики и перспективы сохранения политической стабильности в странах Ближнего и Среднего Востока и Восточной Африки с точки зрения структурно-демографической теории. Системный мониторинг глобальных и региональных рисков / Ред. Д. А. Халтурина, А. В. Коротаев, Ю. В. Зинькина, c. 141–283. М.: Либроком/URSS).
 The Black Archives is a unique historical archive for inspiring conversations, activities and literature from Black and other perspectives that are often overlooked elsewhere.