ISSA Proceedings 2006 – The Effects Of Textual And Graphical -Textual Argumentation Software As Cognitive Tools On The Development Of Argumentation Skills
 1. Introduction
We live in a complex world full with the problems and conflicts. Whether the problem or the conflict exist for an hour, for a year or more; whether the problem at hand is a professional one or totally an individual one; people have to comprehend the complexity, solve problems, make decisions to be able to live in a society. In solving problems, making decisions, formulating opinions, people are required to have developed argumentation skills. Thus, teaching students to be rational thinkers and good problem solvers becomes an important function of school curricula in a complex society. Despite its importance, even high school or university students are not skillfull at constructing reliable, cogent arguments (Kuhn, 1991; Cerbin, 1988; Woods, 1989; Applebee, Langer, ve Mullis, 1986; Bereiter and Scardamalia, 1982; Aldağ, 2005). While Kuhn is signaling a change from learning with hands-on activities to learning with argumentation in science (Kuhn, 1991); the question of how to teach argumentation skills in educational settings is still a topic of disscussion. Until 1960’s, traditional logic courses is offered to students for mastering argumentation skills (Johnson & Blair, 1994). However, criticizing that the traditional logic is incomplete as a tool of rationality, Toulmin published “Uses of Argument” in 1958.
1.1 Toulmin Model of Argumentation
Toulmin suggests that Aristotelian logic with mathematical syllogisms, simply doesn’t fit for the daily arguments. Claiming that the theoretical argument is irrelevant to the assessment of practical argument, he distinguishes between “practical and analytic arguments (Toulmin, 1958). In analytic arguments, arguers ground their claims on abstract, unchanging and universal principles; thus, the conclusion of an analytic argument such as “Socrates is mortal”, is limited only with the premises of “All men are mortal and Socrates is a man.”. Our interest in analyzing argument in traditional logic is to decide whether we have a valid argument or not on the basis of premises.
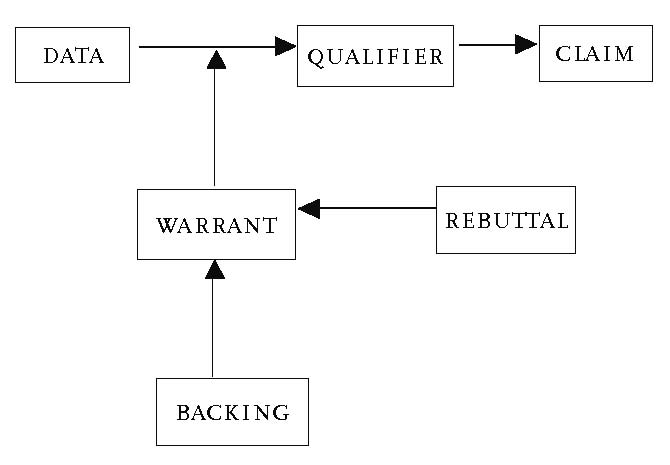
In practical arguments, arguers ground their claims in the context of a particular situation. A practical argument involves mostly an inference from some data to the conclusion of the argument. While arguer implicitly states warrant, audience have to consider how warrant applies to this inference. Therefore, we do not have to limit our arguments to universally acceptable knowledge, rules or conclusions; on the contrary, we even use our beliefs, opinions or the conditions of that particular situation to make a decision on how valid the argument is. Thus, in daily life we counter not with the valid or invalid arguments, but we counter with more or less reliable argument on which we could decide to some extent. Thus, Toulmin developed an explicit model of argumentation for practical purposes (Toulmin, 1958). Toulmin’ model of argumentation has six interactive components: Claim, data and warrant are primary; backing, rebuttal and qualification are secondary parts of the model (Toulmin, 1958; Toulmin, Reieke & Janik, 1984). (Fig.1)
 Teaching directly with the support of different medium is another method to be researched. Martunen and Laurinen (2001) compared direct instruction groups in electronic mail and face to face environment and a control group. They reported electronic environment supported the identifying and selection of data while face to face environment stipulates counter argument use. They concluded different study environments might foster different argumentation skills and the necessity of argumentation teaching.
An alternative approach to direct teaching of argumentation skills is suggested that scaffolding students’ thinking through the use of cognitive tools such as graphical argumentation tool, Belvedere, Quest-Map, Athena, Reason!Able etc. during problem solving or decision making task. Belvedere and similar graphical systems aims to manipulate students thinking to consider and use the argumentation structures while developing their arguments in various problems, subjects or conditions. These tools have the advantage of visualizing their abstract or tacit thinking as well as facilitating group discussion by providing them with the opportunity to track down each others opinions (van Gelder, 2001; Tan, 2000). Most of these software combines visual clues such as different colour, different shapes for different argumentation structures with the verbal argumentation content to ease understanding.
Veerman, Andriessen & Kanselaar (1999) compared Netmeeting chatting tool, Belvedere CSCA tool, Allaire BBS system. They reported that Belvedere is better to support an argumentation since students in this group, control and counter more frequently each others’ statement than students in other groups. Carr (1999) researched Quest-Map in problem-solving context. The researcher found no significant difference between groups in developing argumentation skills. He explained the participants were law students and had already developed argumentation skills. Tan (2000) researched Quest-Map, a constraint-based CSCA conversation systems, (scaffolding by pre-structured forms of conversation systems) in problem-solving context. The researcher concluded that students in Quest-Map performed significantly better in stating grounds (data) in Toulmin’s model of argumentation. Cho (2001) used BBS and Belvedere in his research about problem solving, and found that graphical group is better than textual in use of data and claim.
In Turkey, researches in critical thinking is dated mostly in last ten years. It is more difficult to find publications in argumentation or in teaching argumentation, except classical logic. No research is found related to argumentation software use.
There are many unresolved issues left by the limited amount of researches in teaching and learning argumentation.
2. Purpose of the study
This study is conducted to understand whether teaching an explicit model of argumentation structures will be effective on learning the structures, and how effective will be if the graphical cognitive tool is combined with the direct instruction. Thus, the purpose of this research is defined as “Covariating pre-argumentation scores, is there a significant difference between textual, textual-graphical and control groups’ scores of post-argumentation structures?”.
3. Method
3.1 Participants
The pilot study with the prospective teachers showed computer literacy can be confounding variable considering treatment results. Thus, participants are selected from Department of Computers and Instructional Technology, Faculty of Education, Çukurova University-Turkey since they have the computer literacy skills.
112 undergraduate students signed up; 102 students from Computers and Instructional Technology Department are voluntarily joined in the study. Two students participated in the beginning of study, but were absent following classes. Thus, research completed with a total of 100 students. Among the participants 63 is male and 37 is female. There was no significant difference between groups in terms of sex (X2= .328, P> .05). Table1 shows the distribution of students in terms of sex and groups. Students of control group were 3rd and 4th year undergraduates, while students of experimental groups 2nd year undergraduates. Students of experimental group were registered for Learning Theories course. Participation was voluntary. Registered students were free to choose alternative assignments or grading other than joining to study. None registered student choose the alternative assignment. Students were assured of confidentiality. (Table 1)
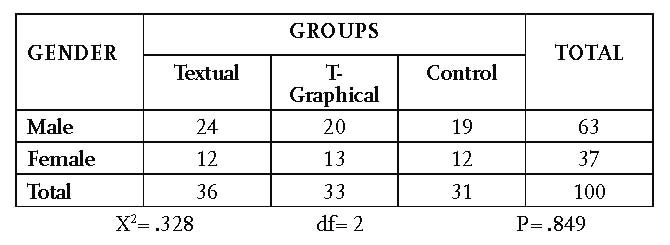
Table 1. Distribution of participants in terms of gender and groups
3.2 Research Design
Non-equivalent control-group design is the most common method used in quasi-experimental research (Gall, Borg and Gall, 1996). This research design is appropriate when researcher has no control over when or to whom they might apply treatment (Campbell and Stanley, 1963 in Cohen, Manion and Morrison, 2000). The difference between nonequivalent control group design and experimental design is that participants is not selected randomly to the groups (Borg etc., 1996). In this research there are two experimental groups and a control group. Participants in experimental groups are selected randomly from second year students of Instructional Technology Department according to their pre-argumentation scores. They were very close to each other in terms of learning background, age and sex distribution. Beside, participants from the second year students were registered for a class; therefore, they were the most appropriate participants for the experimental treatment. However, control group is chosen from the third year and forth year voluntary students. They were not registered for the course, but they agreed to join learning theories seminars for this study. Students in the control group were direct instructed only about the learning theories. Thus, nonequivalent control-group design is selected as research design since control group is not selected randomly. Table2. shows nonequivalent control-group design for this study. (Table 2)

Table 2. Nonequivalent design for the study
E1: Textual experimental group
E2: Textual-Graphical experimental group
C: Control group
R: Randomly assignment to the groups
O1.1, O2.1, O3.1: Pre-argumentation scores
X1: Only textual software use, arguing with word processor
X2: Textual and graphical software use, arguing by Belvedere mapping and word processor
O1.2, O2.2, O3.2: Post-argumentation scoresTreatments are applied only to experimental groups while no treatment applied to the control group. Dependent variables are claim, data, data support, warrant, warrant support, probability qualifier, condition of strength, condition of constraint, rebuttal, counter-rebuttal and total score for the analytic level. Holistic argumentation level is also identified as dependent variable.3.3 Teaching Instruments
First teaching instrument, argumentation courseware in Turkish is developed to support direct instruction of argumentation components to textual and textual-graphical groups. Students were able to reach to courseware trough internet connection (Figure1). Second teaching instrument, Belvedere is a graphical argumentation tool developed by Pittsburg University (http://advlearn/Irde.pitt.edu/belvedere/). This tool aims to provide an opportunity for arguers to establish or to examine the relationship among argumentation structures. Belvedere is selected since it is an appropriate tool for functionalizing argumentation structures of Toulmin model. Belvedere is used only in textual graphical group for organizing group argument before writing it in textual form in this study. Figure 2 gives an example of students’ argumentation in Turkish about learning theories.
Books and articles about theories are provided to each group.
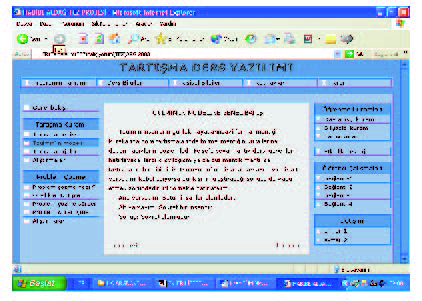
Figure 2. Illustration of Argumentation Components Teaching Tool
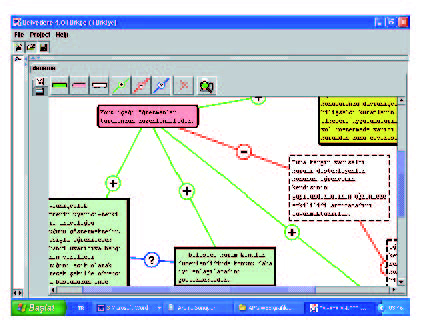
Figure 3. Illustration of Argumentation in Graphical Tool Belvedere
3.4 Assessment Instruments
A holistic and analytic rubric (1. and 2. appendix) developed for the analysis of argumentation based on argumentation components model shown below. Rubric defines the students’ performance level or learning goals which students are accepted to attain during learning process. Rubrics designed to assess learning (McColskey & O’Sullivan, 1993, p.41) can be classified as holistic or analytic rubrics in terms of how criteria or performance level are constructed (Luft, 1997; 1999). The performance level of learning skill is defined holistically in holistic rubrics whereas learning skill is divided into subskills and these subskills are the ones defined for the performance level in analytic rubric.Holistic and analytic argumentation rubrics are developed to measure students’ use of argumentation structures before and after treatment in this study. The researcher has six years of experience in developing rubrics as an instructional designer and instructor. Argumentation rubrics are developed based on Toulmin model of argumentation structures. This model with the field independent quality is applied to many different fields of study (Crammond, 1998) for teaching argumentation skills. Toulmin model also shed light into developing rubrics to assess argumentation skills. The results of persuasive writing studies show this model is appropriate for analyzing arguments (Connor & Lauer, 1985, 1988; Knudson, 1992; McCann, 1989; Scardamalia & Paris, 1985, Lunsford, 2002). However, model is criticized for its shortcomings in analysis (for example Driver etc., 2000; van Eemeren etc., 1996; Simosi, 2003). For this reason, Toulmin model of argumentation structures is adapted based on purposes in this research. Figure 4 shows the argumentation components model with additional structures to Toulmin model which is used for developing rubrics in this study.
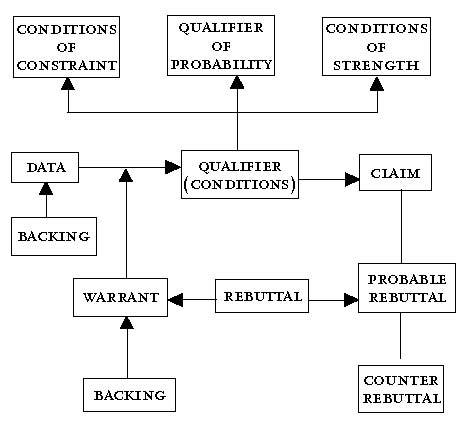
Figure 4. An Argumentation Components Model Based on Toulmin’s Conceptual Model of Argumentation Structures
First draft of rubrics and argumentation components model were developed based on Toulmin model of argumentation structures, related literature and trial composition analysis. Then, first drafts is tested in a pilot study with the participants whose background similar to participants of this study. Second draft of the model and rubrics for the study was organized based on pilot study results. Then, two experts are asked for their opinions on the model and whether the rubrics were able to functionalize the structures of the model for analysis. The experts were experienced in instructional design and teaching thinking. The argumentation component model given below was the conceptual base on which argumentation structures are functionalized for assessment purposes in the final version of holistic and analytic rubrics.Definitions of argumentation structures in argumentation component model:
• Claim is the position being argued for; the conclusion of the argument.
• Warrant is defined as principles of the theory supported in the claim.
• Warrant support is defined as generalizations about the theory of the claim and not the principles.
• Data is defined as examples, event or explanations related to warrant; a connection between warrant and claim.
• Data support is additional information on the context of data.
• Rebuttal is defined as acceptance of deficiencies of the supported theory in claim.
• Counter-rebuttal is an attack of alternative theory to the claim of theory which an author of the claim ready to defense.
• Strength qualifier is about conditions of strenght about the claim. Constraint qualifier is about weakening conditions of claim.
• Probability qualifiers show the authors belief in strenght of his/her claim.
• Clarity, reliabilty, persuasiveness, validity, relevance, tone of language, consistency, importance, supportiveness, and sufficiency are the qualities to measure argumentation structures.A paper would have a score of 1 to 8 coded by holistic rubric. In analytic rubrics, there are ten argumentation structures; claim, warrant, warrant support, data, data support, rebuttal, counter-rebuttal, strength qualifier, and constraint qualifier.Thus a paper analyzed by the analytic rubric would have a score of 1 to 8 for each of these structures, plus a combined score of these structures (an example of analytic coding is given in appendix3). Coders took into consideration the qualities of clarity, reliabilty, persuasiveness, validity, relevance, tone of language, consistency, importance, supportiveness, and sufficiency during scoring level of argumentation structures use. However, papers are not scored quantitatively for these qualities. Instead, these qualities are used to define the level of argumentation structure use.
Pre-argumentation scores prior to argumentation instruction and post-argumantation scores after argumentation instructions and group studies were gathered through the persuasive writings. Open-ended questions similar in structures, asked before and after the treatment is given below.
Pre-Argumentation question is asked to define students’s level in argumentation structure use on Cognitive Development Theories:
You are invited to The Learning and Teaching Conference at the Çukurova University. You are supposed to present a persuasive article on the application of Piaget’s and Vygotsky’s theories on cognitive development. Explain which theory that you support in terms of the advantages and disadvantages in the application based on the problems that we have in school system.
Post-Argumentation question for persuasive writing about Learning Theories to be scored with rubrics:
You are invited to The Learning and Teaching Conference at the Çukurova University. You are supposed to present a persuasive article on the application of behavioral, cognitive and constructivist learning theories. Explain which theory that you support in terms of the advantages and disadvantages in the application based on the problems that we have in school system.All papers were coded independently by two coders. First coder was one of the researcher. Second coder was trained on rubric use prior to pilot study and after pilot study. Both coders are academicians in instructional design and they are familiar with analyzing content for instructional purposes. However, they have no official training in argumentation or informal logic.
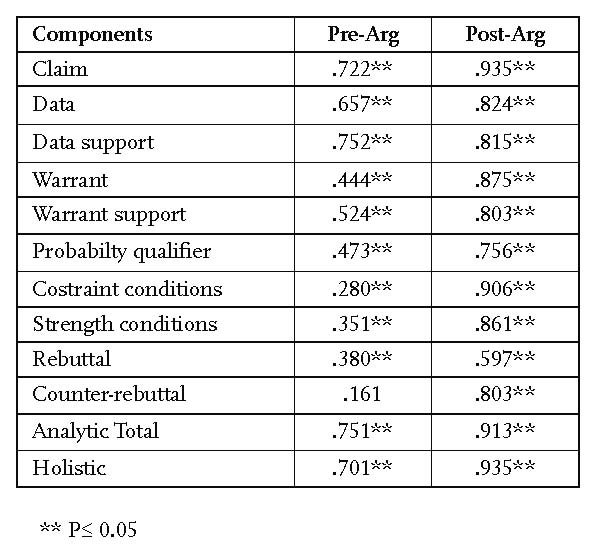
Table 3. Reliability between I. and II. coders
on pre-argumentation level and post-argumentation level
Inter-rater reliability between I. and II. coders on holistic pre-argumentation level was .70. Inter-rater reliability between I. and II. coders on holistic post-argumentation level was .94. Students were not provided with the rubrics during instruction since the effect of direct teaching of argumentation and use of graphical argumentation software were to be researched. The structure of claim in holistic rubric and analytic rubrics and an example of analysis is given in appendix.3.5 Procedure
After, students were taught on the alternative theories of cognitive development by direct instruction; they were asked to write a persuasive writing about the appropriateness of theory that they choose for application considering educational problems and applications in an exam condition. Data about level of the participants’ use of argumentation structures were gathered prior to argumentation instruction by analyzing these papers. Papers were coded by two independent coders with the analytic and holistic scoring rubric.Experimental groups were selected randomly. Students in experimental groups were classified into A, B and C classes based on their holistic scores of pre-argumentation. A symbolizes the participants with the highest level of pre-argumentation structures use, while C symbolizes the lowest level of pre-argumentation structures use. Then students from the each classification group are assigned into a study group. Each study group consisted of three students from A, B and C classification. An example of students selection is given at the Table4. Teaching process of experimental and control group on weekly basis is given in Table 5.
There were 12 study groups in textual, 11 group in textual-graphical group. Except two groups, there were one female and two male in each experimental group. Experimental groups were homogenous in terms of pre-argumentation level as well as sex. There were no study groups in control group.
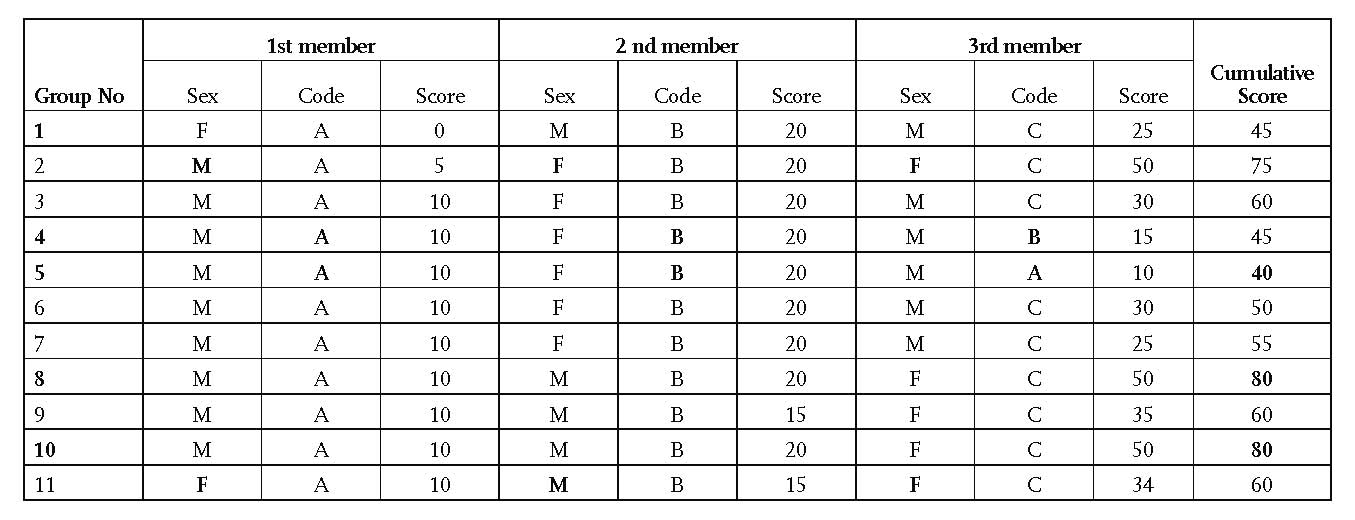
Table 4. Textual-graphical experimental groups based on level of pre-argumentation structures use
Code: Student’s score of pre-argumentation structure based on persuasive writing paper prior to argumentation instruction; Sex: F: Female, M: Male; Score: A: The lowest score, B:Avarage score, C: The highest score

Table 5. Teaching Process
After defining the experimental groups, students are taught in argumentation components, utilizing the courseware. In addition T-graphical group learned how to use Belvedere software in developing argumentation. Control group did not have any treatment. Then, groups in textual treatment are asked to develop an argumentation paper, considering educational problems. The groups in T-Graphical treatment were asked to develop their argumentation first in Belvedere, then to organize as a paper. After being sure that the students understood what they were expected to do, they were taught directly on the theory; then they were asked to study in their fixed group to write the paper about the theory considering educational applications. Teachers met with each group to guide students in selecting a problem, thinking alternatives or overcoming obstacles such as disagreements or finding resources. However, teacher did not interfere with the direct decisions of study groups. Following 9 weeks experimental groups submitted three persuasive writing. T-Graphical groups also submitted three Belvedere map of their argumentation. No treatment applied to the control group. They were only taught about learning theories. They did not submit any assignment.4. Analysis
Pre-argumentation and post-argumentation questions are given to the all groups. The responses given to the pre-argumentation and post-argumentation questions analyzed to have the scores on argumentation structures. However, statistical differences found between experimental and control groups in some argumentation structures even in the pre-argumentation scores.
Basic limitation of nonequivalent control-group design is that there is a possibility the meaningful difference found in post-test might be the result of pre-test differences and not the result of treatment. To overcome this limitation statistically covariance analysis is suggested (Borg and Gall, 1989). Following this suggestion, covariance analysis is selected as analysis technique to overcome the limitation of the research design. Covariating pre-argumentation scores for the post argumentation scores, researchers looked for the meaningful differences which might be a result of experimental treatment. 5. Results
After holistic scoring, each paper was coded again for each component in analytic rubrics by two coders. Covariating the pre-argumentation structures, meaningful differences are found among the post-argumentation level of experimental groups and a control group. Results of ANCOVA and Bonferroni test analysis on claim is given in Table 6.
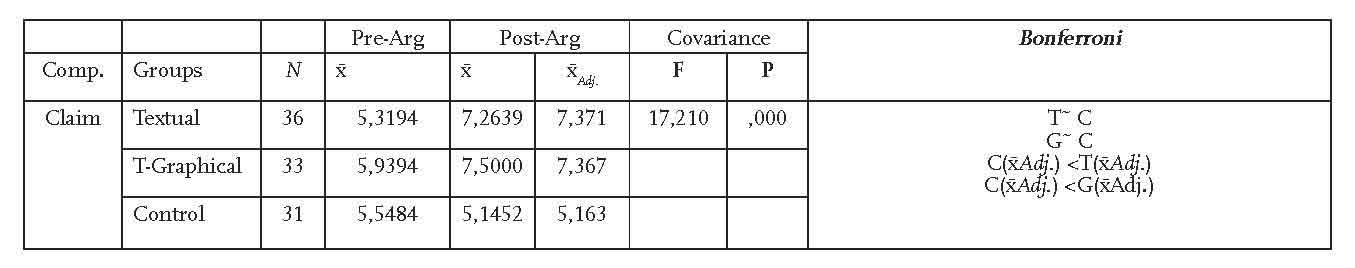
Table 6. Results of ANCOVA and Bonferroni test analysis on claim
Table 6. shows that covariating the pre-argumentation claim structure, meaningful differences favouring experimental groups are found among the post-argumentation claim level of experimental groups and a control group (F(2-96) =17.210, p=.000). The mean of control group (Adj.=5.16) is lower than both experimental groups. There is no significant differences found between the textual (TAdj=7.37) and textual-graphical ( GAdj.=7.37) groups on claim. Results of ANCOVA and Bonferroni test analysis on data is given in Table 7.
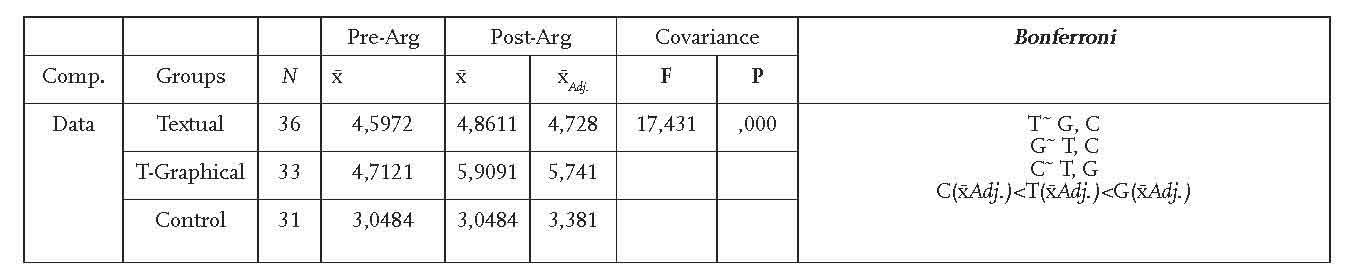
Table 7. Results of ANCOVA and Bonferroni test analysis on data
Table 7. shows that covariating the level of pre-argumentation data component, meaningful differences favouring experimental groups are found among the post-argumentation data level of experimental groups and a control group (F(2-96) =17.431, p=.000). The mean of control group (xˉAdj.=3.04) is lower than both experimental groups. Statistically significant differences favouring textual-graphical group is also found between the experimental groups. The adjusted mean of textual-graphical (xˉAdj.=5.74) is higher than the textual group (xˉAdj.=4.73). Results of ANCOVA and Bonferroni test analysis on data support is given in Table 8.
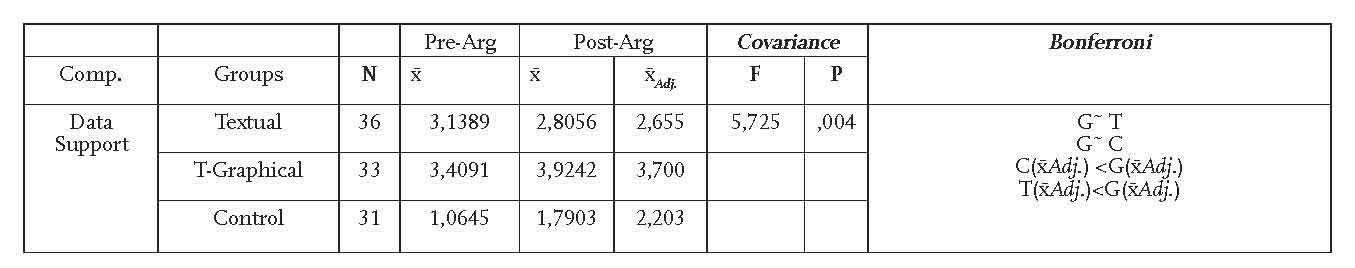
Table 8. Results of ANOVA and Bonferroni test analysis on data support
Table 8. shows that covariating the pre-argumentation data support structure, meaningful differences favouring textual-graphical group against other groups are found on the post-argumentation data level F(2-96) =5.725, p=.004). Adjusted mean of textual-graphical (Adj.=3.70) group is higher than adjusted mean of textual group (xˉAdj.=2.66) and adjusted mean of control group (xˉAdj.=2.20). Results of ANCOVA and Bonferroni test analysis on warrant structure is given in Table 9.

Table 9. Results of ANOVA and Bonferroni test analysis on warrant
Table 9. shows that covariating the pre-argumentation warrant structure, meaningful differences favouring experimental groups are found among the post-argumentation data level of experimental groups and a control group (F(2-96) =27.805, p=.000 ). The mean of control group (xˉAdj. =2.48) is lower than both experimental groups. Statistically significant differences favouring textual-graphical group is also found between the experimental groups. The adjusted mean of textual-graphical (xˉAdj.=5.66) is higher than the textual group (xˉAdj.=3.82). Results of ANCOVA and Bonferroni test analysis on warrant support is given in Table 10.
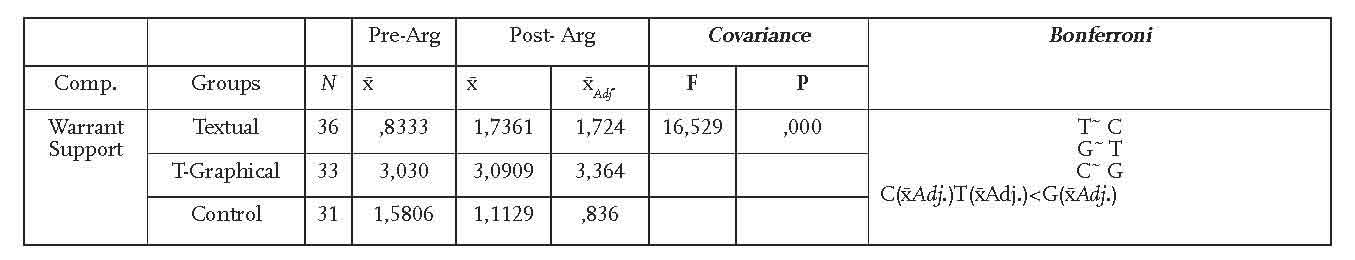
Table 10. Results of ANOVA and Bonferroni test analysis on warrant support
Table 10. shows that covariating the pre-argumentation data structures, meaningful differences favouring experimental groups are found among the post-argumentation data level of experimental groups and a control group F(2-96) =16.529, p=.000). The mean of control group (xˉAdj. =.836) is lower than both experimental groups. Statistically significant differences favouring textual-graphical group is also found between the experimental groups. The adjusted mean of textual-graphical (xˉAdj. =3.364) is higher than the textual group (xˉAdj. =1.724). Results of ANCOVA and Bonferroni test analysis on probabilty qualifier is given in Table 11.
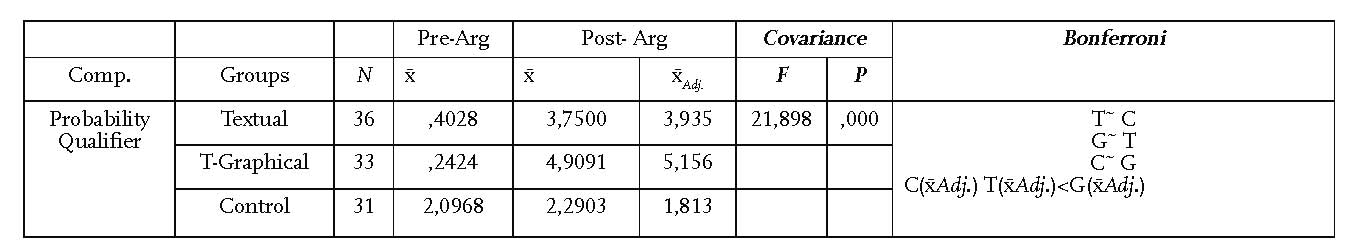
Table 11. Results of ANOVA and Bonferroni test analysis on probability qualifier
Table 11. shows that covariating the pre-argumentation probability qualifier structure, meaningful differences favouring experimental groups are found among the post-argumentation data level of experimental groups and a control group (F(2-96) =21.898, p=.000). The mean of control group is lower than both experimental groups (xˉAdj. =1.813). Statistically significant differences favouring textual-graphical group is also found between the experimental groups. The adjusted mean of textual-graphical (xˉAdj. =5.156) is higher than the textual group (xˉd =3.935). Results of ANCOVA and Bonferroni test analysis on on constraint conditions is given in Table 12.

Table 12. Results of ANOVA and Bonferroni test analyses on constraint conditions
Table 12. shows that covariating the pre-argumentation constrait structure, meaningful difference favouring textual group is found between the textual and the control group (F(2-96)=6,005, p=.003). The adjusted mean of control group (xˉAdj. =,363) is lower than textual group (xˉAdj. =2,061). Although adjusted mean of textual group is higher than the adjusted mean of textual-graphical (xˉAdj. =1,335); there is no statistically significant differences between the experimental groups. Results of ANCOVA and Bonferroni test analysis on conditions of strenght is given in Table 13.

Table 13. Results of ANOVA and Bonferroni test analysis on conditions of strength
Table 13. shows that covariating the level of pre-argumentation component of strength condition, meaningful differences favouring experimental groups are found among the post-argumentation data level of experimental groups and a control group (F(2-96)= 19,823, p=.000). The adjusted mean of control group (xˉAdj. =.657) is lower than both experimental groups’s adjusted mean scores. Statistically significant differences favouring textual-graphical group is also found between the experimental groups. The adjusted mean of textual-graphical (xˉAdj. =3.517) is higher than the textual group (xˉAdj. =1.988). Results of ANCOVA and Bonferroni test analysis on rebuttal is given in Table 14.
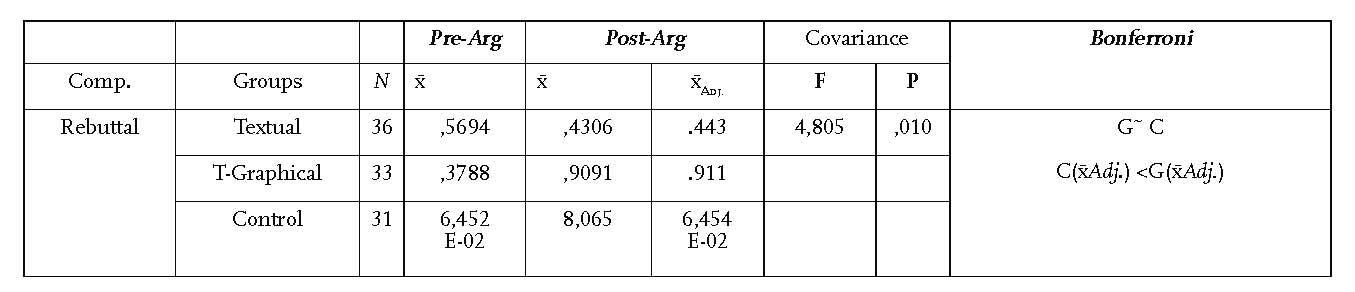
Table 14. Results of ANOVA and Bonferroni test analysis on rebuttal
Table 14. shows that covariating the pre-argumentation rebuttal structure, meaningful difference favouring textual group is found between the textual-graphical and the control group (F(2-96)=4,805, p=.010). The adjusted mean of control group (xˉAdj. =6.454E-02) is lower than textual group (xˉAdj. =2,061). Although adjusted mean of textual-graphical group (xˉAdj. =.911) is higher than the adjusted mean of textual (xˉAdj. =.443); there is no statistically significant differences between the experimental groups. Results of ANCOVA and Bonferroni test analysis on counter-rebuttal is given in Table 15.
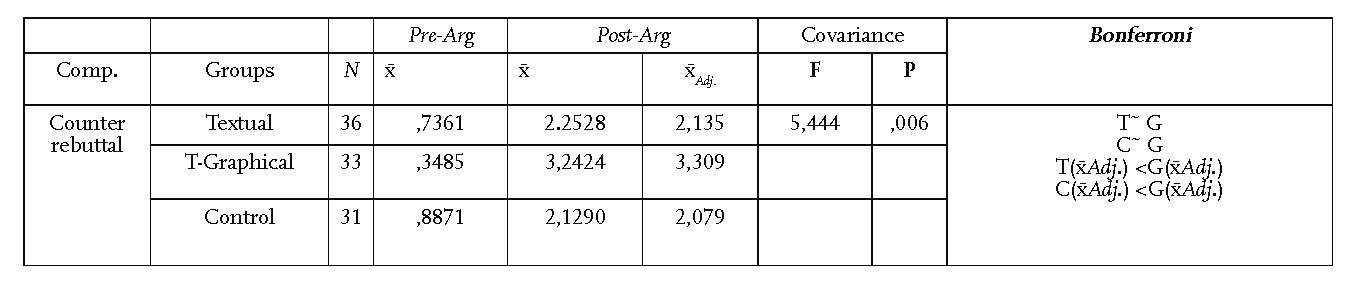
Table 15. Results of ANOVA and Bonferroni test analysis on counter-rebuttal
Table 15. shows that covariating the pre-argumentation counter-rebuttal structure, meaningful difference favouring graphical-textual group is found between the textual-graphical and other groups (F(2-96)= 5,444, p=.006). The adjusted mean of garphical-textual group is higher than adjusted mean of control group(xˉAdj. =2,079 and textual group (xˉAdj. =2,135). There is no statistically significant differences between the adjusted means of textual and control group. Results of ANCOVA and Bonferroni test analysis on analytic total is given in Table 16.
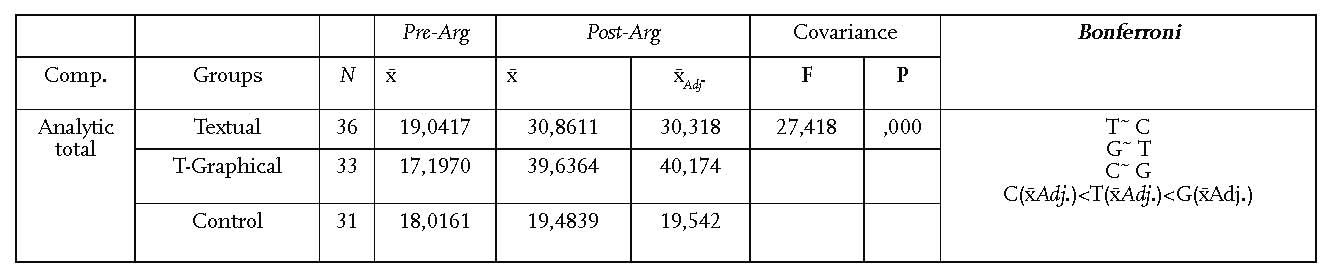
Table 16. Results of ANOVA and Bonferroni test analysis on analytic total
Table 16. shows that covariating the total of analytic pre-argumentation structures, meaningful differences favouring experimental groups are found among the total of analytic post-argumentation structures of experimental groups and a control group (F(2-96)= 27,418, p=.000). The adjusted mean of control group (xˉAdj.=19,542) is lower than both experimental groups. Statistically significant differences favouring textual-graphical group is also found between the experimental groups. The adjusted mean of textual-graphical (xˉAdj. =40,174) is also higher than the textual group (xˉAdj. =30,318). Results of ANCOVA and Bonferroni test analysis on holistic scores is given in Table 17.
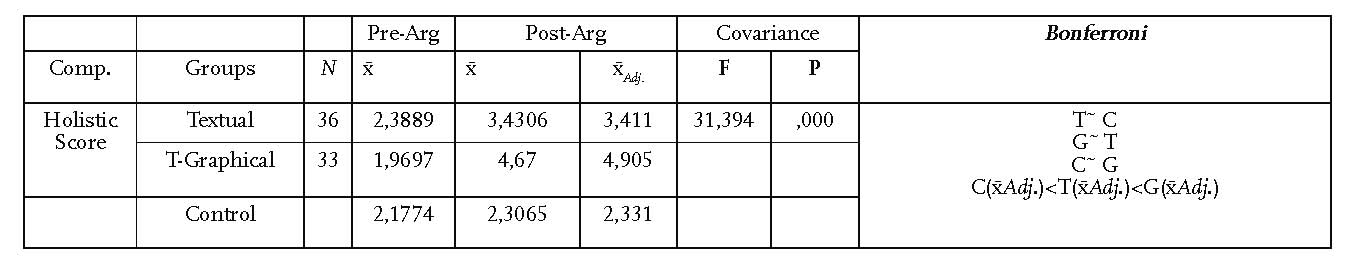
Table 17. Results of ANOVA and Bonferroni test analysis on holistic score
Table 17. shows that covariating the pre-argumentation holistic analysis level, meaningful differences favouring experimental groups are found among the post-argumentation holistic analysis level of experimental groups and a control group (F(2-96)= 31,394, p=.000). The adjusted mean of control group (xˉAdj. =2,331) is lower than both experimental groups. Statistically significant differences favouring textual-graphical group is also found between the experimental groups. The adjusted mean of textual-graphical (xˉAdj. =4,905) is higher than the textual group (xˉAdj. =3,411).
6. Conclusion and discussion
Significant differences are found on the component of data, data support, warrant, warrant support, probability qualifier, conditions of strength, and counter-rebuttal between textual-graphical and textual group; whereas no significant difference is observed the components of claim, conditions of constraint, and rebuttal between textual-graphical and textual group. Textual-graphical is also better than control group on the structures of claim, data, data support, warrant, warrant support, probability qualifier, conditions of strength, rebuttal, counter rebuttal. Significant differences are not observed only on conditions of constraint component between textual-graphical and control groups.
Textual group also seems to produce better results than control group on claim, data, warrant, warrant support, probability qualifier, conditions of constraint, conditions of strength. However, there is no significant difference on the components of data support, rebuttal, and counter-rebuttal between textual and control groups. Caution must be taken into consideration for generalizing the research result on conditions of strength, conditions of constraint, rebuttal and counter-rebuttal since inter-rater reliability seems to be lower than expected in pre-argumentation analysis. The result on data structure seems to be consistent with the research result of Cho (2001), and Tan (2000). However, we have to take into consideration that Tan applied QUESTMAP as graphical software, and Cho compared the Belvedere group with BBS.
In sum, the research results shows that the textual-graphical group is produced better argument comparing to textual and control group based on holistic and analytic total analysis. Beside, covariating the pre-argumentation components level, textual group also seems to produce better arguments comparing control group.
Based on the success of textual group over control group, we can advise the use of argumentation method in study groups and direct teaching about argument components. Using argumentation as an instructional method and instructing students on the argumentation structure use was successful to have students’ attention to the argumentation structures in this study.
Using argumentation software also has a positive effect on learning or developing argumentation components. Considering textual-graphical group is more successful on the use of argumentation structures than only textual group, we can conclude that using Belvedere software prior to writing an argumentation to shape group thinking were a useful classroom application. Mapping effort might help students to develop or organize their thoughts before writing it down. This might help also to gain the skills of applying argument components.
Another advantage of using the graphical tools is that graphical form supports study in groups. Students in groups would not only be able to realize each others thought about the topic, but also be able to recognize the differences in them. Developing argumentation with graphical tools might have a role of advance organizer for the group study. Being able to see the argumentation in graphical form may support the holistic view of the argumentation which is being developed. Therefore, arguers might track the components easier and be able to relate components with each other easier.
This must also be related to cognitive load. First presenting the structures on a graphical form may take the cognitive load off, creating the germane load. Then, after studying with graphical form, writing group argument in textual form might be easier. The students opinions not mentioned in this study were also supportive for this explanation. Using graphical tools might have additive effect with direct instruction in argumentation in this study.
In sum, direct instruction in argumentation and use of graphical argumentation tools are advocated in addition to teaching content at the university level within the limitations of this study.
REFERENCES
Aldağ, H. (2005). Problems in argumentative writing and text analysis. International Biltek Conference, Eskişehir, Turkey.
Applebee, A. N., J. A. Langer, and J. V. N. Mullis (1986). The Writing Report Card: Writing Achievement in American School. Princeton: Educational Testing Service.
Bereiter, C. and M. Scardamalia (1982). From conversation to composition: The role of instruction in developmental process. In: R. Glaser (Ed.), Advances in Instructional Psychology, Vol. 2, Hillsdale, NJ: Lawrence Erlbaum.
Carr, C. S. (1999). The effect of computer-supported collaborative argumentation (CSCA) on argumentation skills in second-year law student. Unpublished Doctoral Dissertation, The Pennsylvania State University, Pennsylvania.
Cerbin, B. (1988). The nature and development of informal reasoning skills in college student. Eric-EDRS NO: ED 298 805.
Cho, Kyoo-Lak (2001). The effects of argumentation scaffols on argumentation and problem solving in an online colloborative problem solving environment. Unpublished Doctoral Dissertation. The Pennsylvania State University, Pennsylvania.
Campbell, D. T., Stanley J. (1963). Experimental and quasi experimental designs for research on teaching. In N. Gage (Ed.) Handbook on Research on Teaching, Chicago, Rand McNally, 171-246. Cited in Cohen, L., L. Manion, K. Morrison (2000), Research Methods in Education (5th ed.), London etc.: Taylor an Francis Group, Routledge, Falmer.
Connor, U. and J. Lauer (1985). Understanding persuasive essay writing: Linguistic/rhetorical approach. Text, 5, 309-26.
Connor, U. and J. Lauer (1988). Cross-cultural variation in persuasive student writing. In Writing Across Languages and Cultures (Alan C. Purves ed.). Newbury Park: Sage, 138-59.
Crammond, J. G. (1998) “The uses and complexity of argument structures in expert and student persuasive writing,” Written Communication, 230-68.
Driver, R., J. Leach, R. Millar, and P. Scott (1996), Young’s People Images Of Science, Buckingham: Open University Pres.
Driver, R., P. Newton, and J. Osborne (2000). Establishing the norms of scientific argumentation in classroom. Science Education, 20, 1059-1073.
Duschl, R. A., K. Ellenbogen, and S. Erduran (1997). Promoting argumentation in middle school science classrooms: A Project SEPIA evaluation. The Annual Meeting of the National Association of Reserch in Science Teaching.
Eemeren, F. H. van, R. Grootendorst, A. F. Snoeck Henkemans, J. A. Blair, R. H. Johnson, E. C. W. Krabbe, C. Plantin, D. N. Walton, C. A. Willard, J. Woods, and D. Zarefsky (1996). Fundamentals of Argumentation Theory: A Handbook of Historical Backgrounds and Contemporary Developments, Mahwah: Lawrence Erlbaum Associates.
Epstein R.L. (2002). Critical Thinking. Wadsworth/Thomson Learning, CA, USA.
Gall, M.D., W.R. Borg and J.P. Gall (1996). Educational Research. Longman, NY, USA.
Gass, R. H., J. A. Sanders and R. L. Wiseman (1990), “Warrant, argument dimensions, perceived argument effectiveness, and the influence of critical thinking instruction,” Paper presented to The Annual Convention of the Speech Communication Association, Sacremento, CA, February.
Gelder, T.J. van (2001). How to improve critical thinking using educational technology. In: G. Kennedy, M. Keppell, C. McNaught & T. Petrovic (Eds.), Meeting at the Crossroads. Proceedings of the 18th Annual Conference of the Australasian Society for Computers in Learning in Tertiary Education. (pp. 539-548). Melbourne: Biomedical Multimedia Unit, The University of Melbourne.
Johnson, R. H. and J. A. Blair. (1994a). Informal Logic: Past and Present. In: R. Johnson (ed.), New Essays in Informal Logic, 32-51. Newport News: Vale Press.
Johnson, R. H. and J. A. Blair (1994b). Logical Self-Defense. McGraw-Hill, Inc. : USA Kelly, G. J., S. Druker, and C. Chen, (1998). Students’ reasoning about electiricity: combining performance assessments with argumentation analysis. International Journal of Science Education, 20, 849-872.
Knudson, R. E. (1991). Effects of instructional strategies, grade and sex on students’ persuasive writing. Journal of Experimental Education, 59,2, 141-142.
Knudson, R. E. (1992). The development of writing argumentation: An analysis and comparision of argumentative writing at for grade levels. Child Study Journal, 22,3, 167-184.
Kuhn, D. (1991). The Skills of Argument. Cambridge: Cambridge University Press.
Leeman, R. W. (1987). Taking Perspectives: Teaching Critical Thinking in The Argumentation Course. EDRS No. ED 292 147.
Luft, J. (1997). Design your own rubric. Science Scope, 20,5, 25-27.
Luft J. A. (1999). Rubrics: design and use in science teacher education. Journal of Science Teacher Education 10, 2,107-121.
Lunsford, K. J. (2002). Contextualizing Toulmin’s model in the writing classroom: a case study. Written Communication 19,1, 76-109.
Marttunen, M., and L. Laurinen, (2001). Learning of argumentation skills in networked and face-to-face environments. Instructional Science, 29,2, 127–153.
McCann, T. M. (1989). Student argumentative writing knowledge and ability at three grade levels. Research in the Teaching of English, 23,1, 62-76
McColskey, W., and R. O’Sullivan, (1993). How to assess student performance in science: Going beyond multiple-choice test. Greensboro: SouthEastern Regional Vision for Education, University of North Carolina.
Rottenberg, A.T. (2000). Elements of Argument. Bedford/St. Martin’s, Boston MA, USA.
Russell, T. L. (1983). Analyzing arguments in science classroom discourse: Can teachers’ questions distort scientific authority,” Journal of Research in Science Teaching, 20, 27-45.
Sanders, J. A., R.L. Wiseman, and R. H. Gass, (1994). Does teaching argumentation facilitate critical thinking?. Communication Reports, 7,1, 27-35.
Sauders, K. M. (1994). Law as rhetoric, rhetoric as argument. Journal of Legal Education, 44,4, 566-578.
Scardamalia, M., P. Paris (1985). The function of explicit discourse knowledge in the development of text representations and composing strategies. Cognition & Instruction, 2,1, 1-39.
Simosi, M. (2003). Using Toulmin’s framework for the analysis of everyday argumentation: some methodological considerations. Argumentation, 17, 2, 185-202.
Tan, S. C. (2000). Supporting collaborative problem solving trough computer-supported collaborative argumentation. Unpublished Doctoral Dissertation. The Pennsylvania State University, Pennsylvania.
Toulmin, S. (1958). The Uses of Argument. Cambridge, UK: Cambridge University Press.
Toulmin, S. E., R. D. Rieke, and A. Janik (1984). An Introduction to Reasoning (2. Ed.), New York, NY: Macmillan.
Veerman, A.L., J. Andriessen and G. Kanselear (1999). Collaborative learning through computer-mediated argumentation. The Conference On Computer Supported Collaborative Learning (CSCL December 99), San Francisco, CA.
Woods, D.R. (1989). Teaching thinking and ideas about assessment. Journal of College Science Teaching, 18, 5, 338-40.
Yeh, S. S. (1998a). Empowering education: Teaching argumentative writing to culturally minority middle-school students. Research in the Teaching of English, 33,1, 49-83.
Yeh, S.S. (1998b).Validation of a scheme for assessing writing of middle school students. Assessing Writing, 5,1, 123-150.
Yerrick, R.K. (2000). Lower tarch science students’ argumentation and open inquiry instruction. Journal of Research in Science Teaching, 37, 807-838.
Appendix 1: Holistic Argumentation Rubric for 0 SCORE of 0-8
A persuasive writing paper is scored between 0 to 8 with holistic argumentation rubric. The writing with score of 0 is not considered as argumentation paper. Author might have a claim but does not have any effort in persuasing anybody. Either there is no primary structure or it is impossible to classify them. The paper is more about knowledge transfer than argumentation. Most probably there are many mistakes even in the knowledge presented. It is too difficult for the reader to understand the author. The attributes are:
• No solid claim.
• No central or supporting components.
• Explanation is not possible to be classified into any structures.
• Transferred knowledge unrelated to the argumentation.
• Undeveloped or to informal writing tone.
• No effort in persuasing.
Appendix 2: Analytic Argumentation Rubric for the structure of Claim
• 8 Consistent with each other, convincing number of important main and sub-claims presented eloboratively in an organized form, easier for the reader to understand.
• 6 A couple important main claims which will support a central claim is forgotten. It resembles the writing of score 8 in terms of other attributes.
• 4 There are some important claims are presented generally in a comprehensible manner. From time to time, it is possible to have contradictions. There might be some problems in organization of claims. Some claims left to the audience to figure out.
• 2 Most of the important claims is overlooked. Presented claims are meaningless. It is very difficult for the reader to understand the connection between claims and sub-claims. There might be even contradictions between some of them.
• 0 There is no claim or unclear for the reader.
Appendix 3: An Example of Written Argumentation Analysis
First papers is analyzed for holistic scoring. Then, each paper is analyzed again for each structure. Coders asked questions to locate the structure and to define the quality of structure in writings.
Primary Structures of Argument
• Claim: Combine or choose learning theories for application based on circumstances
• Data: Why we combine or choose?
• Data D1.1. Context of learning always different. Individual differences, number of students, time, content, learning environment… etc.
• Data support: Do we have an example of different circumstances?
• Data support Ds1.1. BTE-208 ED-psychology with 30 student, OO) ED-psychology with 300 students
• Warrant: What are the circumstances of combining and choosing?
• Warrant AW.1. Choose when prior knowledge of content is high
• Warrant AW.2. Combine when prior knowledge of content is low but content is strictly sequential and challenging.
• Warrant support Do we have an example of the warrant?
• Warrant support AWs.2.1 To do personality analysis, students in BTE Psych has to know fundamental concepts and the principles of defense.
• Warrant support Why combining is appropriate when prior knowledge of content is low but content is strictly sequential and challenging?
• Warrant support AWs.2.2.: We can deal with low level of knowledge, sequential and challenging content when combining deductive and inductive approaches.
Secondary Structures Of Argument
• Rebuttal A (acceptance of shortcoming of the claim): If you will choose or combine learning theory on the basis of current circumstances, you have to put more time and work into planning.
• Probable rebuttal B to A (An attack to the data: A rebuttal of attacker which the defender of claim will refute): We can’t combine or choose learning theories just because context of learning is changing. Context might change but the content to be learned will be the same.
• Counter rebuttal A to B (Defender of A is refuting the attack to the data of A from B): Context is everything. You can not teach personality analysis to the prospective psychiatrist and to the prospective teachers.
• Probable rebuttal A: An attack to the warrant (A rebuttal of attacker which the defender of claim will refute):
• Constraint qualifier (Conditions): If teachers have the freedom to plan what, how, and when to teach
• Strength qualifier (Conditions): Choosing or combining the appropriate theories is especially important when the target group is heterogonous.
• Probability qualifier (Conditions): It works always.