Biosocial Evolution, Ecological Aspects, And Consciousness ~ Modeling Of Biological And Social Phases Of Big History
 Abstract
In the first part of this article we survey general similarities and differences between biological and social macroevolution. In the second (and main) part, we consider a concrete mathematical model capable of describing important features of both biological and social macroevolution. In mathematical models of historical macrodynamics, a hyperbolic pattern of world population growth arises from non-linear, second-order positive feedback between demographic growth and technological development. Based on diverse paleontological data and an analogy with macrosociological models, we suggest that the hyperbolic character of biodiversity growth can be similarly accounted for by non-linear, second-order positive feedback between diversity growth and the complexity of community structure. We discuss how such positive feedback mechanisms can be modelled mathematically. ~ This research has been supported by the Russian Science Foundation (Project No 14-11-00634).
Keywords: social evolution, biological evolution, mathematical model, biodiversity, population growth, positive feedback, hyperbolic growth.
Introduction
The present article represents an attempt to move further in our research on the similarities and differences between social and biological evolution (see Grinin, Markov, and Korotayev 2008, 2009a, 2009b, 2011, 2012). We have endeavored to make a systematic comparison between biological and social evolution at different levels of analysis and in various aspects. We have formulated a considerable number of general principles and rules of evolution, and worked to develop a common terminology to describe some key processes in biological and social evolution. In particular, we have introduced the notion of ‘social aromorphosis’ to describe the process of widely diffused social innovation that enhances the complexity, adaptability, integrity, and interconnectedness of a society or social system (Grinin, Markov, and Korotayev 2008, 2009a, 2009b). This work has convinced us that it might be possible to find mathematical models that can describe important features of both biological and social macroevolution. In the first part of this article we survey general similarities and differences between the two types of macroevolution. In the second (and main) part, we consider a concrete mathematical model that we deem capable of describing important features of both biological and social macroevolution.
The comparison of biological and social evolution is an important but (unfortunately) understudied subject. Students of culture still vigorously debate the applicability of Darwinian evolutionary theory to social/cultural evolution. Unfortunately, the result is largely a polarization of views. On the one hand, there is a total rejection of Darwin’s theory of social evolution (see, e.g., Hallpike 1986). On the other hand, there are arguments that cultural evolution demonstrates all of the key characteristics of Darwinian evolution (Mesoudi et al. 2006).
We believe that, instead of following the outdated objectivist principle of ‘either – or’, we should concentrate on the search for methods that could allow us to apply the achievements of evolutionary biology to understanding social evolution and vice versa. In other words, we should search for productive generalizations and analogies for the analysis of evolutionary mechanisms in both contexts. The Universal Evolution approach aims for the inclusion of all mega-evolution within a single paradigm (discussed in Grinin, Carneiro, et al. 2011). Thus, this approach provides an effective means by which to address the above-mentioned task.
It is not only systems that evolve, but also mechanisms of evolution (see Grinin, Markov, and Korotayev 2008). Each sequential phase of macroevolution is accompanied by the emergence of new evolutionary mechanisms. Certain prerequisites and preadaptations can, therefore, be detected within the previous phase, and the development of new mechanisms does not invalidate the evolutionary mechanisms that were active during earlier phases. As a result, one can observe the emergence of a complex system of interaction composed of the forces and mechanisms that work together to shape the evolution of new forms.
Biological organisms operate in the framework of certain physical, chemical and geological laws. Likewise, the behaviors of social systems and people have certain biological limitations (naturally, in addition to various social-structural, historical, and infrastructural limitations). From the standpoint of Universal Evolution, new forms of evolution that determine phase transitions may result from activities going in different directions. Some forms that are similar in principle may emerge at breakthrough points, but may also result in evolutionary dead-ends. For example, social forms of life emerged among many biological phyla and classes, including bacteria, insects, birds, and mammals. Among insects, in particular, one finds rather highly developed forms of socialization (see, e.g., Robson and Traniello 2002; Ryabko and Reznikova 2009; Reznikova 2011). Yet, despite the seemingly common trajectory and interrelation of social behaviors among these various life forms, the impacts that each have had on the Earth are remarkably different.
Further, regarding information transmission mechanisms, it appears possible to speak about certain ‘evolutionary freaks’. Some of these mechanisms were relatively widespread in the biological evolution of simple organisms, but later became less so. Consider, for example, the horizontal exchange of genetic information (genes) among microorganisms, which makes many useful gene-
tic ‘inventions’ available in a sort of ‘commons’ for microbe communities. Among bacteria, the horizontal transmission of genes contributes to the rapid development of antibiotic resistance (e.g., Markov and Naymark 2009). By contrast, this mechanism of information transmission became obsolete or was transformed into highly specialized mechanisms (e.g., sexual reproduction) in the evolution of more complex organisms. Today, horizontal transmission is mostly confined to the simplest forms of life.
These examples suggest that an analysis of the similarities and differences between the mechanisms of biological and social evolution may help us to understand the general principles of megaevolution[1] in a much fuller way. These similarities and differences may also reveal the driving forces and supra-phase mechanisms (i.e., mechanisms that operate in two or more phases) of megaevolution. One of our previous articles was devoted to the analysis of one such mechanism: aromorphosis, the process of widely diffused social innovation that enhances the complexity, adaptability, integrity, and interconnectedness of a society or social system (Grinin, Markov, and Korotayev 2011; see also Grinin and Korotayev 2008, 2009a, 2009b; Grinin, Markov, and Korotayev 2009a, 2009b).
It is important to carefully compare the two types of macroevolution (i.e., biological and social) at various levels and in various aspects. This is necessary because such comparisons often tend to be incomplete and deformed by conceptual extremes. These limitations are evident, for example, in the above-referenced paper by Mesoudi et al. (2006), which attempts to apply a Darwinian method to the study of social evolution. Unfortunately, a failure to recognize or accept important differences between biological and social evolution reduces the overall value of the method that these authors propose. Christopher Hallpike’s rather thorough monograph, Principles of Social Evolution (1986), provides another illustration of these limitations. Here, Hallpike offers a fairly complete analysis of the similarities and differences between social and biological organisms, but does not provide a clear and systematic comparison between social and biological evolution. In what follows, we hope to avoid similar pitfalls.
Biological and Social Evolution: A Comparison at Various Levels
There are a few important differences between biological and social macroevolution. Nonetheless, it is possible to identify a number of fundamental similarities, including at least three basic sets of shared factors. First, we are discussing very complex, non-equilibrium, but stable systems whose function and evolution can be described by General Systems Theory, as well as by a number of cybernetic principles and laws. Second, we are not dealing with isolated systems, but with the complex interactions between organisms and their external environments. As a result, the reactions of systems to ‘external’ challenges can be described in terms of general principles that express themselves within a biological reality and a social reality. Third (and finally), a direct ‘genetic’ link exists between the two types of macroevolution and their mutual influence.
We believe that the laws and forces driving the biological and social phases of Big History can be comprehended more effectively if we apply the concept of biological and social aromorphosis (Grinin, Markov, and Korotayev 2011). There are some important similarities between the evolutionary algorithms of biological and social aromorphoses. Thus, it has been noticed that the basis of biological aromorphosis is usually formed by some partial evolutionary change that… creates significant advantages for an organism, puts it in more favorable conditions for reproduction, multiplies its numbers and its changeability…, thus accelerating the speed of its further evolution. In those favorable conditions, the total restructurization of the whole organization takes place afterwards (Shmal’gauzen 1969: 410; see also Severtsov 1987: 64–76).
During the course of adaptive radiation, such changes in organization diffuse more or less widely (frequently with significant variations).
A similar pattern is observed within social macroevolution. An example is the invention and diffusion of iron metallurgy. Iron production was practiced sporadically in the 3rd millennium BCE, but regular production of low-grade steel did not begin until the mid-2nd millennium BCE in Asia Minor (see, e.g., Chubarov 1991: 109). At this point, the Hittite kingdom guarded its monopoly over the new technology. The diffusion of iron technology led to revolutionary changes in different spheres of life, including a significant advancement in plough agriculture and, consequently, in the agrarian system as a whole (Grinin and Korotayev 2006); an intensive development of crafts; an increase in urbanism; the formation of new types of militaries, armed with relatively cheap but effective iron weapons; and the emergence of significantly more developed systems of taxation, as well as information collection and processing systems, that were necessary to support these armies (e.g., Grinin and Korotayev 2007a, 2007b). Ironically, by introducing cheaply made weapons and other tools into the hands of people who might resist the Hittite state, this aromorphosis not only supported the growth of that kingdom, it also laid the groundwork for historical phase shifts.
Considering such cases through the lens of aromorphosis has helped us to detect a number of regularities and rules that appear to be common to biological and social evolution (Grinin, Markov, and Korotayev 2011). Such rules and regularities (e.g., payment for arogenic progress, special conditions for the emergence of aromorphosis, etc.) are similar for both biological and social macroevolution. It is important to emphasize, however, that similarity between the two types of macroevolution does not imply commonality. Rather, significant similarities are frequently accompanied by enormous differences. For example, the genomes of chimpanzees and the humans are 98 per cent similar, yet there are enormous intellectual and social differences between chimpanzees and humans that arise from the apparently ‘insignificant’ variations between the two genomes (see Markov and Naymark 2009).
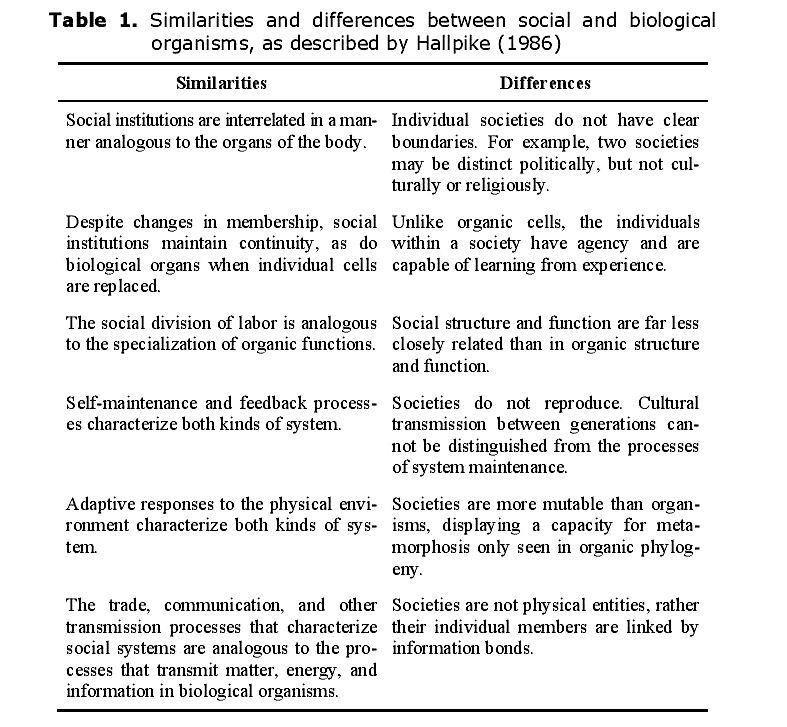
Despite its aforementioned limitations, it appears reasonable to continue the comparison between the two types of macroevolution following the analysis offered by Hallpike (1986). Therefore, it may prove useful to revisit the pertinent observations of this analysis here. Table 1 summarizes the similarities and differences that Hallpike (Ibid.: 33–34) finds between social and biological organisms.
While we do not entirely agree with all of his observations – for example, the establishment of colonies could be seen as a kind of social reproduction akin to organic reproduction – we do feel that Hallpike comes to a sound conclusion: that similarities between social and biological organisms are, in general, determined by similarities in organization and structure (we would say similarities between different types of systems). As a result, Hallpike believes that one can use certain analogies in which institutions are similar to some organs. In this way, cells may be regarded as similar to individuals, central government similar to the brain, and so on. Examples of this kind of thinking can be found in the classic texts of social theory (see, e.g., Spencer 1898 and Durkheim 1991 [1893]), as well as in more recent work (see, e.g., Heylighen 2011).
When comparing biological species and societies, Hallpike (1986: 34) singles out the following similarities:
(1) that, like societies, species do not reproduce;
(2) that both have phylogenies reflecting change over time; and
(3) that both are made up of individuals who compete against one another.
Importantly, he also indicates the following difference: ‘[S]ocieties are organized systems, whereas species are simply collections of individual organisms’ (Hallpike 1986: 34).
Hallpike tries to demonstrate that, because of the differences between biological and social organisms, the very idea of natural selection does not appear to apply to social evolution. However, we do not find his proofs very convincing on this account, although they do make sense in certain respects. Further, his analysis is confined mainly to the level of the individual organism and the individual society. He rarely considers interactions at the supra-organism level (though he does, of course, discuss the evolution of species). His desire to demonstrate the sterility of Darwinian theory to discussions of social evolution notwithstanding, it seems that Hallpike involuntarily highlights the similarity between biological and social evolution. As he, himself, admits, the analogy between the biological organism and society is quite noteworthy.
Just as he fails to discuss interactions and developments at the level of the supra-organism in great detail, Hallpike does not take into account the point in social evolution where new supra-societal developments emerge (up to the level of the emergence of the World System [e.g., Korotayev 2005, 2007, 2008, 2012; Grinin and Korotayev 2009b]). We contend that it is very important to consider not only evolution at the level of a society but also at the level above individual societies, as well as the point at which both levels are interconnected. The supra-organism level is very important to understanding biological evolution, though the differences between organisms and societies make the importance of this supra-level to understanding social evolution unclear. Thus, it might be more productive to compare societies with ecosystems rather than with organisms or species. However, this would demand the development of special methods, as it would be necessary to consider the society not as a social organism, but as a part of a wider system, which includes the natural and social environment (cf., Lekevičius 2009, 2011).
In our own analysis, we seek to build on the observations of Hallpike while, at the same time, providing a bit more nuance and different scales of analysis. Viewing each as a process involving selection (natural, social, or both), we identify the differences between social and biological evolution at the level of the individual biological organism and individual society, as well as at the supra-organismic and supra-societal level.
Natural and Social Selection
Biological evolution is more additive (cumulative) than substitutive. Put another way: the new is added to the old. By contrast, social evolution (especially over the two recent centuries) is more substitutive than additive: the new replaces the old (Grinin, Markov, and Korotayev 2008, 2011).
Further, the mechanisms that control the emergence, fixation, and diffusion of evolutionary breakthroughs (aromorphoses) differ between biological and social evolution. These differences lead to long-term restructuring in the size and complexity of social organisms. Unlike biological evolution, where some growth of complexity is also observed, social reorganization becomes continuous. In recent decades, societies that do not experience a constant and significant evolution look inadequate and risk extinction.
In addition, the size of societies (and systems of societies) tends to grow constantly through more and more tightly integrative links (this trend has become especially salient in recent millennia), whereas the trend towards increase in the size of biological organisms in nature is rather limited and far from general. At another level of analysis, one can observe the formation of special suprasocietal systems that also tend to grow in size. This is one of the results of social evolution and serves as a method of aromorphosis fixation and diffusion.
The Individual Biological Organism and the Individual Society
It is very important to note that, although biological and social organisms are significantly (actually ‘systemically’) similar, they are radically different in their capacities to evolve. For example, as indicated by Hallpike (see above), societies are capable of rapid evolutionary metamorphoses that were not observed in the pre-human organic world. In biological evolution, the characteristics acquired by an individual are not inherited by its offspring; thus, they do not influence the very slow process of change.
There are critical differences in how biological and social information are transmitted during the process of evolution. Social systems are not only capable of rapid transformation, they are also able to borrow innovations and new elements from other societies. Social systems may also be transformed consciously and with a certain purpose. Such characteristics are absent in natural biological evolution.
The biological organism does not evolve by itself: evolution may only take place at a higher level (e.g., population, species, etc.). By contrast, social evolution can often be traced at the level of the individual social organism (i.e., society). Moreover, it is frequently possible to trace the evolution of particular institutions and subsystems within a social organism. In the process of social evolution the same social organism or institution may experience radical transformation more than once.
The Supra-organic and Supra-societal Level
Given the above-mentioned differences, within the process of social evolution we observe the formation of two types of special supra-societal entity:
(1) amalgamations of societies with varieties of complexity that have analogues in biological evolution, and (2) elements and systems that do not belong to any particular society and lack many analogues in biological evolution.
The first type of amalgamation is rather typical, not only in social but also in biological evolution. There is, however, a major difference between the two kinds of evolution. Any large society usually consists of a whole hierarchy of social systems. For example, a typical agrarian empire might include nuclear families, extended families, clan communities, village communities, primary districts, secondary districts, and provinces, each operating with their own rules of interaction but at the same time interconnected. This kind of supra-societal amalgamation can hardly be compared with a single biological organism (though both systems can still be compared functionally, as is correctly noted by Hallpike [1986]). Within biological evolution, amalgamations of organisms with more than one level of organization (as found in a pack or herd) are usually very unstable and are especially unstable among highly organized animals. Of course, analogues do exist within the communities of some social animals (e.g., social insects, primates). Neither should we forget that scale is important: while we might compare a society with an individual biological organism, we must also consider groups of organisms bound by cooperative relationships (see, e.g., Boyd and Richerson 1996; Reeve and Hölldobler 2007). Such groups are quite common among bacteria and even among viruses. These caveats aside, it remains the case that within social evolution, one observes the emergence of more and more levels: from groups of small sociums to humankind as a whole.
The multiplication of these levels rapidly produces the second kind of amalgamation. It is clear that the level of analysis is very important for comparison of biological and social evolution. Which systems should be compared? Analogues appear to be more frequent when a society (a social organism) is compared to a biological organism or species. However, in many cases, it may turn out to be more productive to compare societies with other levels of the biota’s systemic organization. This might entail comparisons with populations, ecosystems and communities; with particular structural elements or blocks of communities (e.g., with particular fragments of trophic networks or with particular symbiotic complexes); with colonies; or with groups of highly organized animals (e.g., cetaceans, primates, and other social mammals or termites, ants, bees and other social insects).
Thus, here we confront a rather complex and rarely studied methodological problem: which levels of biological and social process are most congruent? What are the levels whose comparison could produce the most interesting results? In general, it seems clear that such an approach should not be a mechanical equation of ‘social organism = biological organism’ at all times and in every situation. The comparisons should be operational and instrumental. This means that we should choose the scale and level of social and biological phenomena, forms, and processes that are adequate for and appropriate to our intended comparisons.
Again, it is sometimes more appropriate to compare a society with an individual biological organism, whereas in other cases it could well be more appropriate to compare the society with a community, a colony, a population, or a species. At yet another scale, as we will see below, in some cases it appears rather fruitful to compare the evolution of the biosphere with the evolution of the anthroposphere.
 Mathematical Modeling of Biological and Social Macroevolution
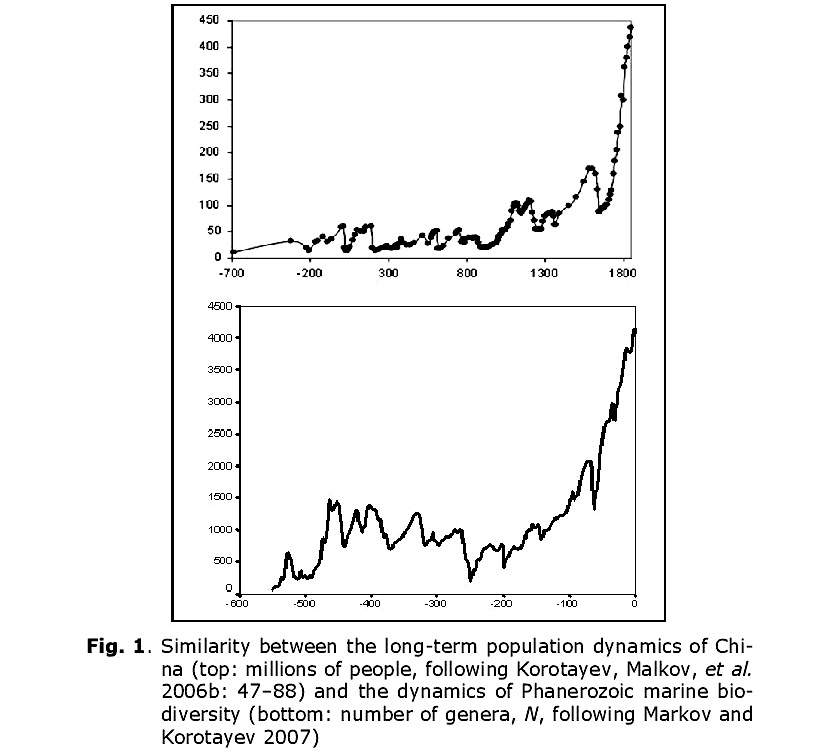
The authors of this article met for the first time in 2005, in the town of Dubna (near Moscow), at what seems to have been the first ever international conference dedicated specifically to Big History studies. Without advance knowledge of one another, we found ourselves in a single session. During the course of the session, we presented two different diagrams. One illustrated population dynamics in China between 700 BCE and 1851 CE, the other illustrated the dynamics of marine Phanerozoic biodiversity over the past 542 million years (Fig. 1).
The similarity between the two diagrams was striking. This, despite the fact that they depicted the development of very different systems (human population vs. biota) at different time scales (hundreds of years vs. millions of years), and had been generated using the methods of different sciences (historical demography vs. paleontology) with different sources (demographic estimates vs. paleontological data). What could have caused similarity of developmental dynamics in very different systems?
* * *
In 1960, von Foerster et al. published a striking discovery in the journal Science. They showed that between 1 and 1958 CE, the world’s population (N) dynamics could be described in an extremely accurate way with an astonishingly simple equation:[2]
![]()
where Nt is the world population at time t, and C and t0 are constants, with t0 corresponding to an absolute limit (‘singularity’ point) at which N would become infinite. Parameter t0 was estimated by von Foerster and his colleagues as 2026.87, which corresponds to November 13, 2026; this made it possible for them to supply their article with a title that was a public-relations masterpiece: ‘Doomsday: Friday, 13 November, A.D. 2026’.
Of course, von Foerster and his colleagues did not imply that the world population on that day could actually become infinite. The real implication was that the world population growth pattern that operated for many centuries prior to 1960 was about to end and be transformed into a radically different pattern. This prediction began to be fulfilled only a few years after the ‘Doomsday’ paper was published as World System growth (and world population growth in particular) began to diverge more and more from the previous blow-up regime. Now no longer hyperbolic, the world population growth pattern is closer to a logistic one (see, e.g., Korotayev, Malkov et al. 2006a; Korotayev 2009).
 Fig. 2 presents the overall correlation between the curve generated by von Foerster et al.‘s equation and the most detailed series of empirical estimates of world population (McEvedy and Jones 1978, for the period 1000–1950; U.S. Bureau of the Census 2013, for 1950–1970). The formal characteristics are:
R = 0.998; R2 = 0.996; p = 9.4 × 10⁻¹⁷ ≈ 1 × 10–16. For readers unfamiliar with mathematical statistics: R2 can be regarded as a measure of the fit between
the dynamics generated by a mathematical model and the empirically observed situation, and can be interpreted as the proportion of the variation accounted for by the respective equation. Note that 0.996 also can be expressed as 99.6 per cent.[3] Thus, von Foerster et al.‘s equation accounts for an astonishing
99.6 per cent of all the macrovariation in world population, from 1000 CE through 1970, as estimated by McEvedy and Jones (1978) and the U.S. Bureau of the Census (2013).[4] Note also that the empirical estimates of world population find themselves aligned in an extremely neat way along the hyperbolic curve, which convincingly justifies the designation of the pre-1970s world population growth pattern as ‘hyperbolic’.
The von Foerster et al.’s equation, , is the solution for the following differential equation (see, e.g., Korotayev, Malkov et al. 2006a: 119–120):
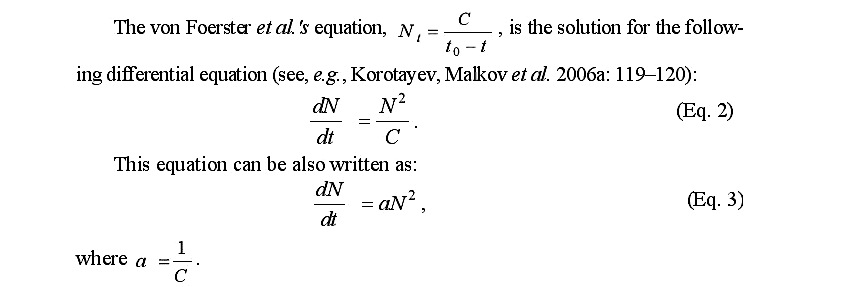
What is the meaning of this mathematical expression? In our context, dN/dt denotes the absolute population growth rate at a certain moment in time. Hence, this equation states that the absolute population growth rate at any moment in time should be proportional to the square of world population at this moment. This significantly demystifies the problem of hyperbolic growth. To explain this hyperbolic growth, one need only explain why for many millennia the world population’s absolute growth rate tended to be proportional to the square of the population.
The main mathematical models of hyperbolic growth in the world population (Taagapera 1976, 1979; Kremer 1993; Cohen 1995; Podlazov 2004; Tsirel 2004; Korotayev 2005, 2007, 2008, 2009, 2012; Korotayev, Malkov et al. 2006a: 21–36; Golosovsky 2010; Korotayev and Malkov 2012) are based on the following two assumptions:
‘the Malthusian (Malthus 1978 [1798]) assumption that population is limited by the available technology, so that the growth rate of population is proportional to the growth rate of technology’ (Kremer 1993: 681–682),[5] and
the idea that ‘[h]igh population spurs technological change because it increases the number of potential inventors… In a larger population there will be proportionally more people lucky or smart enough to come up with new ideas’, thus, ‘the growth rate of technology is proportional to total population’(Kremer 1993: 685).[6]
Here Kremer uses the main assumption of Endogenous Technological Growth theory (see, e.g., Kuznets 1960; Grossman and Helpman 1991; Aghion and Howitt 1998; Simon 1977, 2000; Komlos and Nefedov 2002; Jones 1995, 2005).
The first assumption looks quite convincing. Indeed, throughout most of human history the world population was limited by the technologically determined ceiling of the carrying capacity of land. For example, with foraging subsistence technologies the Earth could not support more than 8 million people because the amount of naturally available useful biomass on this planet is limited. The world population could only grow over this limit when people started to apply various means to artificially increase the amount of available biomass that is with the transition from foraging to food production. Extensive agriculture is also limited in terms of the number of people that it can support. Thus, further growth of the world population only became possible with the intensification of agriculture and other technological improvements (see, e.g., Turchin 2003; Korotayev, Malkov et al. 2006a, 2006b; Korotayev and Khaltourina 2006). However, as is well known, the technological level is not constant, but variable (see, e.g., Grinin 2007a, 2007b, 2012), and in order to describe its dynamics the second basic assumption is employed.
As this second supposition was, to our knowledge, first proposed by Simon Kuznets (1960), we shall denote the corresponding type of dynamics as ‘Kuznetsian’. (The systems in which the Kuznetsian population-technological dynamics are combined with Malthusian demographic dynamics will be denoted as ‘Malthusian-Kuznetsian’.) In general, we find this assumption rather plausible – in fact, it is quite probable that, other things being equal, within a given period of time, five million people will make approximately five times more inventions than one million people.
This assumption was expressed mathematically by Kremer in the following way:
![]()
This equation simply says that the absolute technological growth rate at a given moment in time (dT/dt) is proportional to the technological level (T) observed at this moment (the wider the technological base, the higher the number of inventions that can be made on its basis). On the other hand, this growth rate is also proportional to the population (N): the larger the population, the larger the number of potential inventors.[7]
When united in one system, Malthusian and Kuznetsian equations account quite well for the hyperbolic growth of the world population observed before the early 1990s (see, e.g., Korotayev 2005, 2007, 2008, 2012; Korotayev, Malkov et al. 2006a). The resultant models provide a rather convincing explanation of why, throughout most of human history, the world population followed the hyperbolic pattern with the absolute population growth rate tending to be proportional to N2. For example, why would the growth of population from, say, 10 million to 100 million, result in the growth of dN/dt 100 times? The above mentioned models explain this rather convincingly. The point is that the growth of world population from 10 to 100 million implies that human subsistence technologies also grew approximately 10 times (given that it will have proven, after all, to be able to support a population ten times larger). On the other hand, the tenfold population growth also implies a tenfold growth in
the number of potential inventors, and, hence, a tenfold increase in the relative technological growth rate. Thus, the absolute technological growth rate would expand 10 × 10 = 100 times as, in accordance with Eq. 4, an order of magnitude higher number of people having at their disposal an order of magnitude wider technological base would tend to make two orders of magnitude more inventions. If, as throughout the Malthusian epoch, the world population (N) tended toward the technologically determined carrying capacity of the Earth, we have good reason to expect that dN/dt should also grow just by about 100 times.
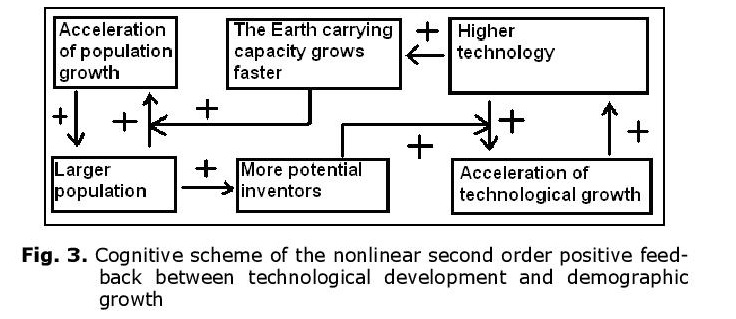 In fact, it can be shown (see, e.g., Korotayev, Malkov et al. 2006a, 2006b; Korotayev and Khaltourina 2006) that the hyperbolic pattern of the world’s population growth could be accounted for by a nonlinear second-order positive feedback mechanism that was long ago shown to generate just the hyperbolic growth, also known as the ‘blow-up regime’ (see, e.g., Kurdyumov 1999). In our case, this nonlinear second-order positive feedback looks as follows: more people – more potential inventors – faster technological growth – faster growth of the Earth’s carrying capacity – faster population growth – more people allow for more potential inventors – faster technological growth, and so on (see Fig. 3).
Note that the relationship between technological development and demographic growth cannot be analyzed through any simple cause-and-effect model, as we observe a true dynamic relationship between these two processes – each of them is both the cause and the effect of the other.
The feedback system described here should be identified with the process of ‘collective learning’ described, principally, by Christian (2005: 146–148). The mathematical models of World System development discussed in this article can be interpreted as models of the influence that collective learning has on global social evolution (i.e., the evolution of the World System). Thus, the rather peculiar hyperbolic shape of accelerated global development prior to the early 1970s may be regarded as a product of global collective learning. We have also shown (Korotayev, Malkov et al. 2006a: 34–66) that, for the period prior to the 1970s, World System economic and demographic macrodynamics, driven by the above-mentioned positive feedback loops, can simply and accurately be described with the following model:

The world GDP (G) can be calculated using the following equation:
| G = mN + SN, | (Eq. 7) |
where G is the world GDP, N is population, and S is the produced surplus per capita, over the subsistence amount (m) that is minimally necessary to reproduce the population with a zero growth rate in a Malthusian system (thus, S = g – m, where g denotes per capita GDP); a and b are parameters.
The mathematical analysis of the basic model (not described here) suggests that up to the 1970s, the amount of S should be proportional, in the long run, to the World System’s population: S = kN. Our statistical analysis of available empirical data has confirmed this theoretical proportionality (Korotayev, Malkov et al. 2006a: 49–50). Thus, in the right-hand side of Eq. 6, S can be replaced with kN, resulting in the following equation:
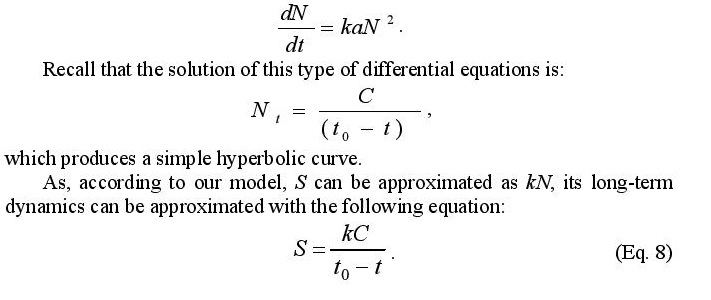
Thus, the long-term dynamics of the most dynamic component of the world GDP, SN, the ‘world surplus product’, can be approximated as follows:
![]()
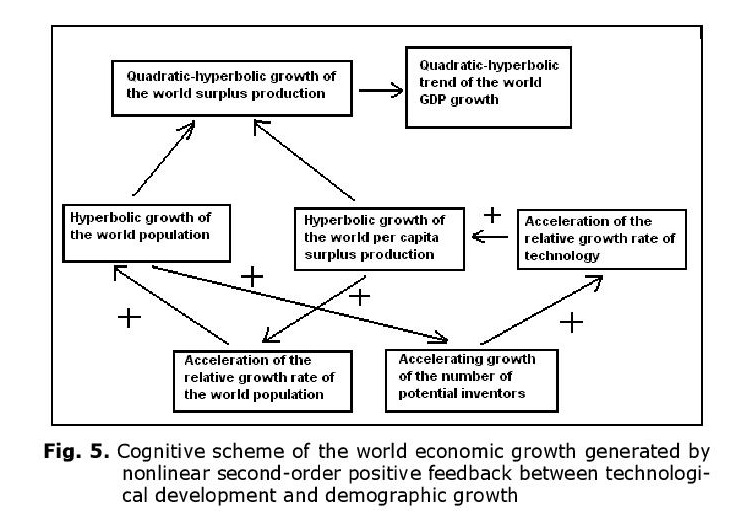
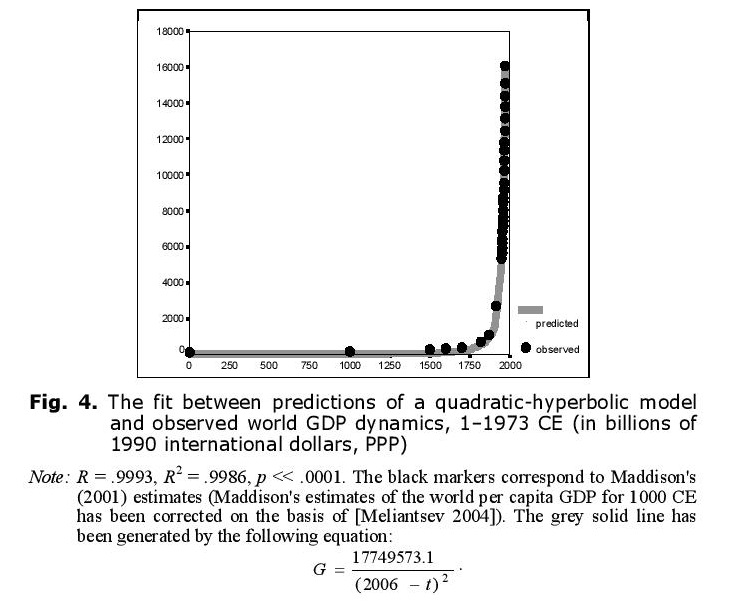 Thus, up to the 1970s the hyperbolic growth of the world population was accompanied by the quadratic-hyperbolic growth of the world GDP, as suggested by our model. Note that the hyperbolic growth of the world population and the quadratic-hyperbolic growth of the world GDP are very tightly connected processes, actually two sides of the same coin, two dimensions of one process propelled by nonlinear second-order positive feedback loops between the technological development and demographic growth (see Fig. 5).
We have also demonstrated (Korotayev, Malkov et al. 2006a: 67–80) that the World System population’s literacy (l) dynamics are rather accurately described by the following differential equation:
![]()
where l is the proportion of the population that is literate, S is per capita surplus, and a is a constant. In fact, this is a version of the autocatalytic model. Literacy growth is proportional to the fraction of the population that is literate,
l (potential teachers), to the fraction of the population that is illiterate, (1 – l) (potential pupils), and to the amount of per capita surplus S, since it can be used to support educational programs. (Additionally, S reflects the technological level T that implies, among other things, the level of development of educational technologies.) From a mathematical point of view, Eq. 9 can be regarded as logistic where saturation is reached at literacy level l = 1. S is responsible for the speed with which this level is being approached.
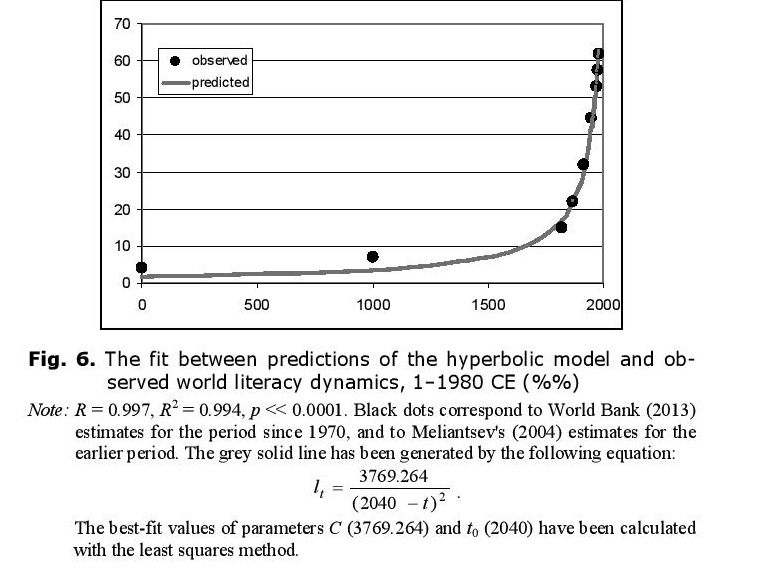 It is important to stress that with low values of l (which correspond to most of human history, with recent decades being the exception), the rate of increase in world literacy generated by this model (against the background of hyperbolic growth of S) can be approximated rather accurately as hyperbolic (see Fig. 6).
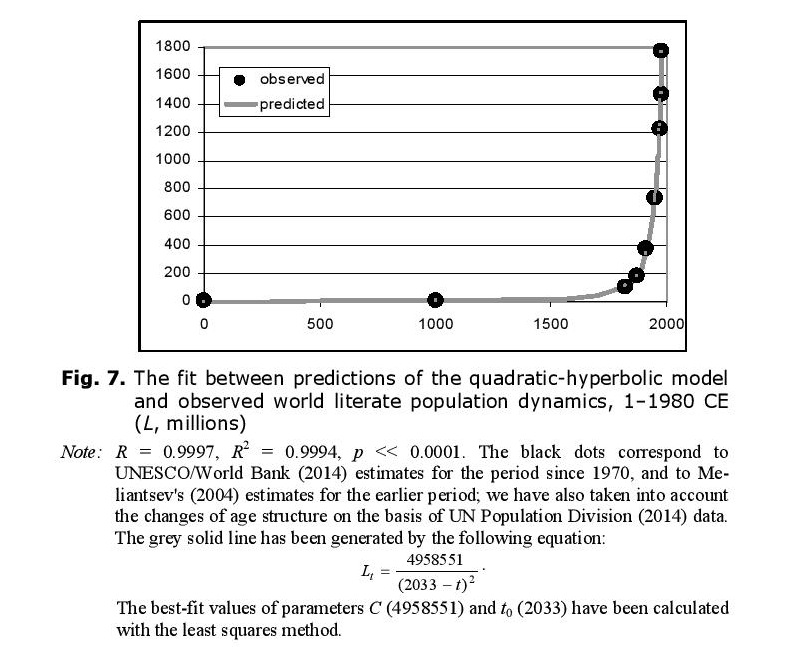
The overall number of literate people is proportional both to the literacy level and to the overall population. As both of these variables experienced hyperbolic growth until the 1960s/1970s, one has sufficient grounds to expect that until recently the overall number of literate people in the world (L)[8] was growing not just hyperbolically, but rather in a quadratic-hyperbolic way (as was world GDP). Our empirical test has confirmed this – the quadratic-hyperbolic model describes the growth of the literate population of this planet with an extremely good fit indeed (see Fig. 7).
Similar processes are observed with respect to world urbanization, the macrodynamics of which appear to be described by the differential equation:
![]()
where u is the proportion of the population that is urban, S is per capita surplus produced with the given level of the World System’s technological development, b is a constant, and ulim is the maximum possible proportion of the population that can be urban. Note that this model implies that during the Malthusian-Kuznetsian era of the blow-up regime, the hyperbolic growth of world urbanization must have been accompanied by a quadratic-hyperbolic growth of the urban population of the world, as supported by our empirical tests (see Figs 8–9).


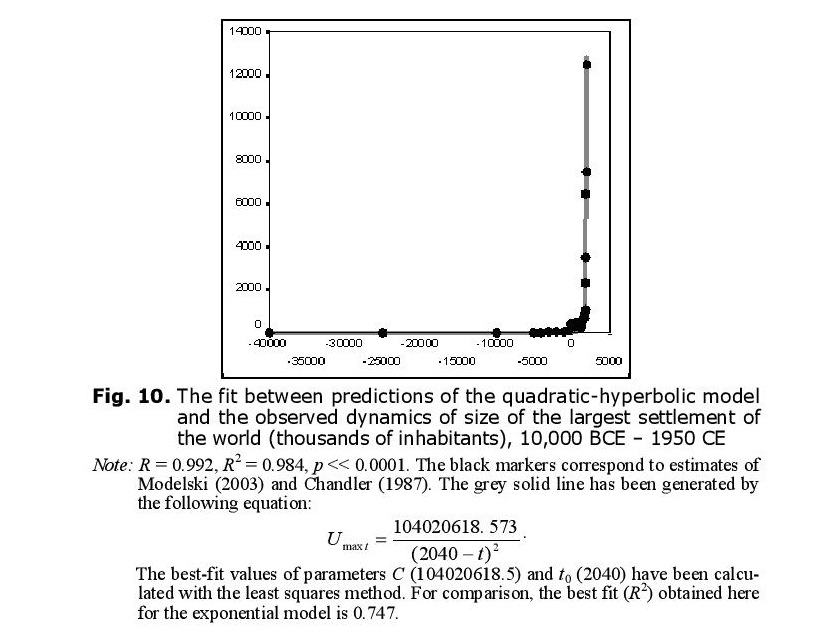
Within this context it is hardly surprising to find that the general macrodynamics of largest settlements within the World System are also quadratic-hyperbolic (see Fig. 10).
As has been demonstrated by socio-cultural anthropologists working across cultures (see, e.g., Naroll and Divale 1976; Levinson and Malone 1980: 34), for pre-agrarian, agrarian, and early industrial cultures the size of the largest settlement is a rather effective indicator of the general sociocultural complexity of a social system. This, of course, suggests that the World System’s general sociocultural complexity also grew, in the Malthusian-Kuznetsian era, in a generally quadratic-hyperbolic way.
 Turning to a more concrete case study, as suggested at the beginning of this section, the hyperbolic model is particularly effective for describing the long-term population dynamics of China, the country with the best-known demographic history. The Chinese population curve reflects not only a hyperbolic trend, but also cyclical and stochastic dynamics. These components of long-term population dynamics in China, as well as in other complex agrarian societies, have been discussed extensively (see, e.g., Braudel 1973; Abel 1980; Usher 1989; Goldstone 1991; Chu and Lee 1994; Komlos and Nefedov 2002; Turchin 2003, 2005a, 2005b; Nefedov 2004; Korotayev 2006; Korotayev and Khaltourina 2006; Korotayev, Malkov et al. 2006b; Turchin and Korotayev 2006; Korotayev, Komarova et al. 2007; Grinin, Korotayev et al. 2008; Grinin, Malkov et al. 2009; Turchin and Nefedov 2009; van Kessel-Hagesteijn 2009; Korotayev, Khaltourina, Malkov et al. 2010; Korotayev, Khaltourina et al. 2010; Grinin and Korotayev 2012).
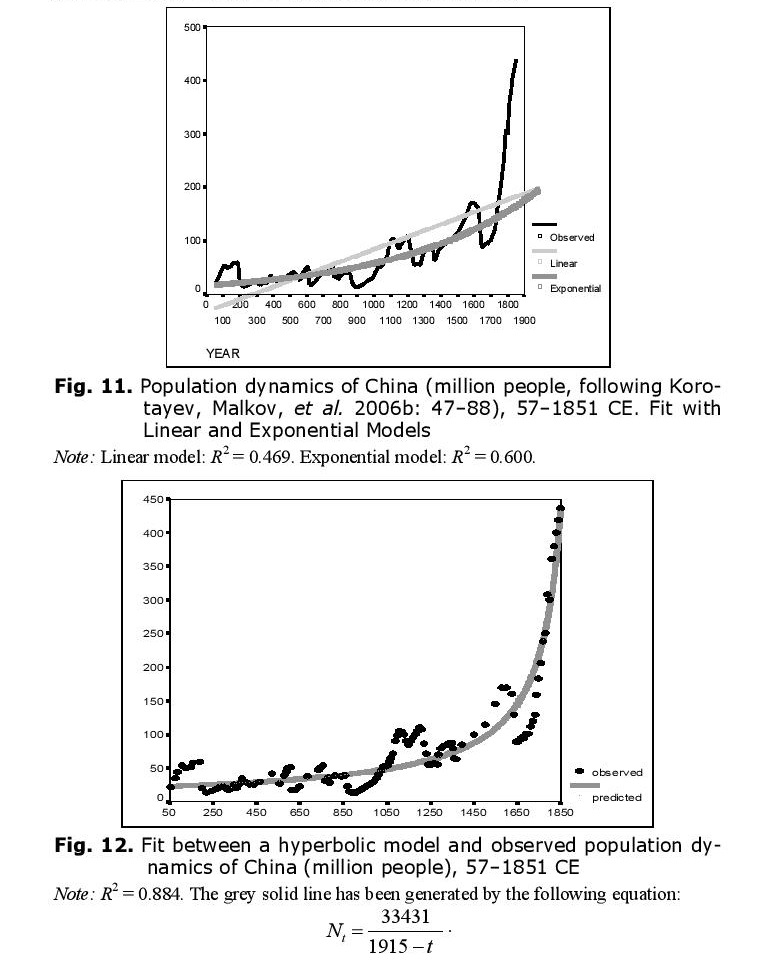
As we have observed with respect to world population dynamics, even before the start of its intensive modernization, the population dynamics of China were characterized by a pronounced hyperbolic trend (Figs 11 and 12).
The hyperbolic model describes traditional Chinese population dynamics much more accurately than either linear or exponential models.
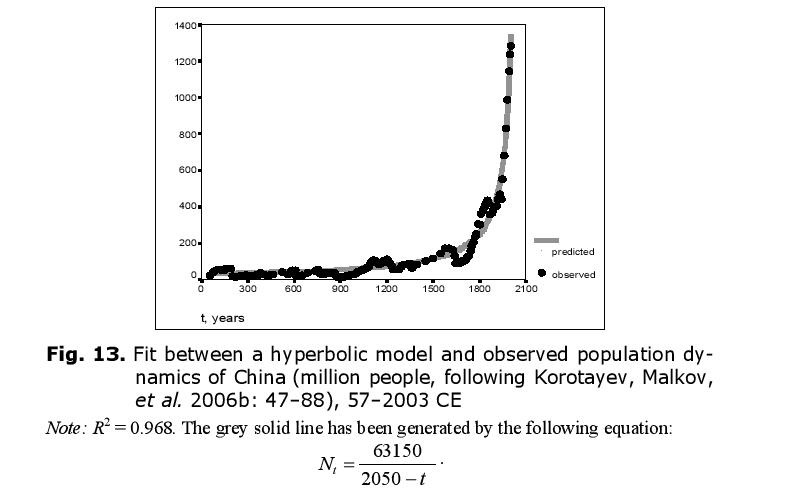
The hyperbolic model describes the population dynamics of China in an especially accurate way if we take the modern period into account (Fig. 13).
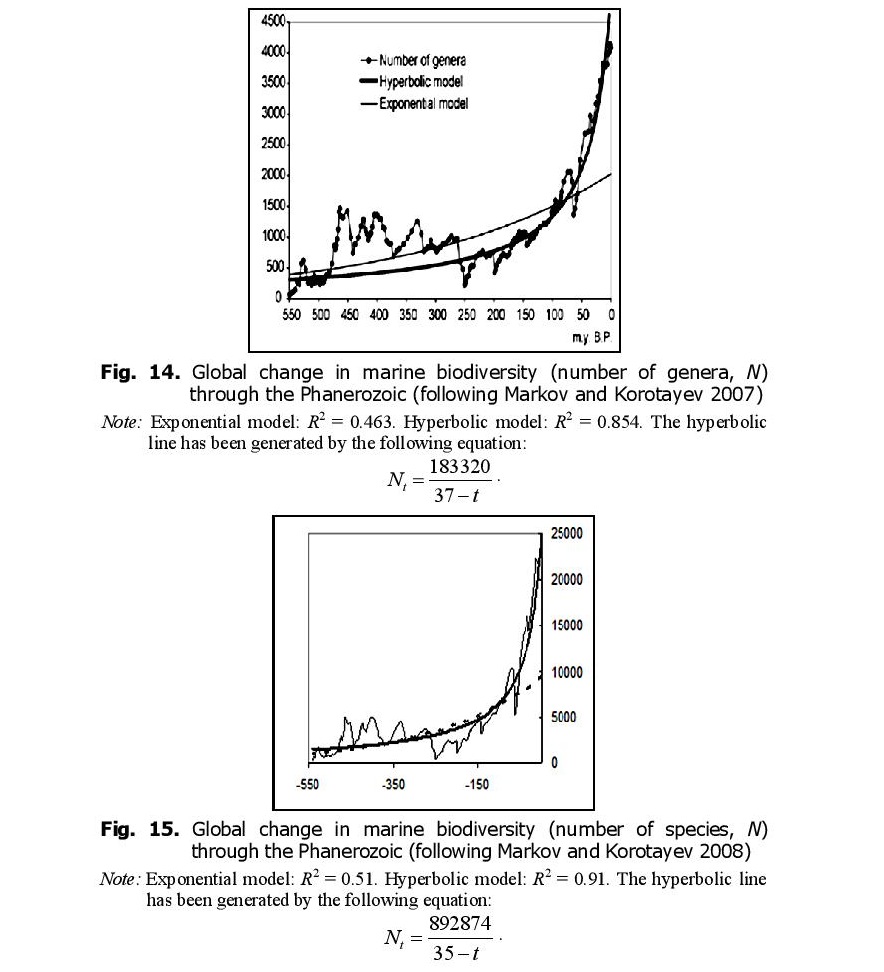
It is curious that, as we noted above, the dynamics of marine biodiversity are strikingly similar to the population dynamics of China. The similarity probably derives from the fact that both curves are produced by the interference of the same three components (the general hyperbolic trend, as well as cyclical and stochastic dynamics). In fact, there is a lot of evidence that some aspects of biodiversity dynamics are stochastic (Raup et al. 1973; Sepkoski 1994; Markov 2001; Cornette and Lieberman 2004), while others are periodic (Raup and Sepkoski 1984; Rohde and Muller 2005). In any event, the hyperbolic model describes marine biodiversity (measured by number of genera) through the Phanerozoic much more accurately than an exponential model (Fig. 14).
When measured by number of species, the fit between the empirically observed marine biodiversity dynamics and the hyperbolic model becomes even better (Fig. 15).
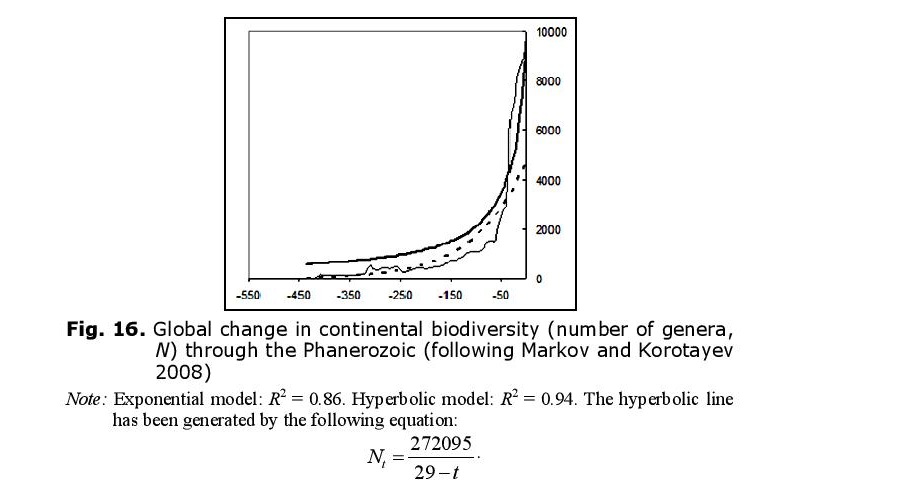 Likewise, the hyperbolic model describes continental biodiversity in an especially accurate way (Fig. 16).
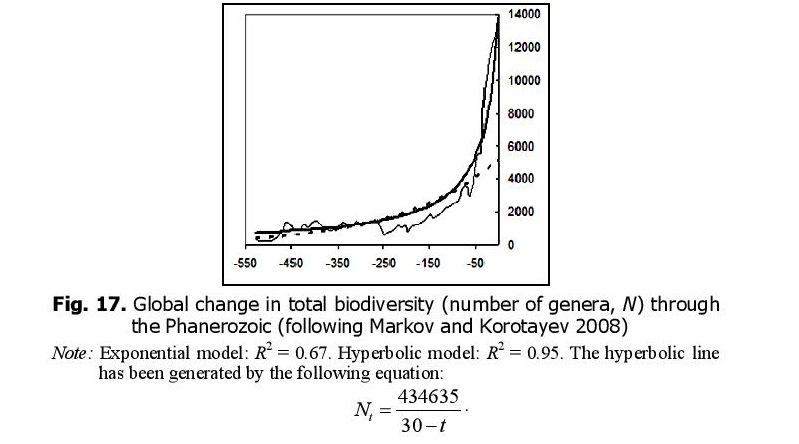
The hyperbolic dynamics are most prominent when both marine and continental biotas are considered together. This fact can be interpreted as a proof of the integrated nature of the biosphere. But why, throughout the Phanerozoic, did global biodiversity tend to follow a hyperbolic trend similar to that which we observed for the World System in general and China in particular?
As we have noted above, in sociological models of macrohistorical dynamics, the hyperbolic pattern of world population growth arises from non-linear second-order positive feedback (more or less identical with the mechanism of collective learning) between demographic growth and technological development. Based on analogy with these sociological models and diverse paleontological data, we suggest that the hyperbolic character of biodiversity growth can be similarly accounted for by non-linear second-order positive feedback between diversity growth and the complexity of community structure: more genera – higher alpha diversity – enhanced stability and ‘buffering’ of communities – lengthening of average life span of genera, accompanied by a decrease in the extinction rate – faster diversity growth – more genera – higher alpha diversity, and so on. Indeed, this begins to appear as a (rather imperfect) analogue of the collective learning mechanism active in social macroevolution.
The growth of genus richness throughout the Phanerozoic was mainly due to an increase in the average longevity of genera and a gradual accumulation of long-lived (stable) genera in the biota. This pattern reveals itself in a decrease in the extinction rate. Interestingly, in both biota and humanity, growth was facilitated by a decrease in mortality rather than by an increase in the birth rate. The longevity of newly arising genera was growing in a stepwise manner. The most short-lived genera appeared during the Cambrian; more long-lived genera appeared in Ordovician to Permian; the next two stages correspond to the Mesozoic and Cenozoic (Markov 2001, 2002). We suggest that diversity growth can facilitate the increase in genus longevity via progressive stepwise changes in the structure of communities.
Most authors agree that three major biotic changes resulted in the fundamental reorganization of community structure during the Phanerozoic: Ordovician radiation, end-Permian extinction, and end-Cretaceous extinction (Bambach 1977; Sepkoski et al. 1981; Sepkoski 1988, 1992; Markov 2001; Bambach et al. 2002). Generally, after each major crisis, the communities became more complex, diverse, and stable. The stepwise increase of alpha diversity (i.e., the average number of species or genera in a community) through the Phanerozoic was demonstrated by Bambach (1977) and Sepkoski (1988). Although Powell and Kowalewski (2002) have argued that the observed increase in alpha diversity might be an artifact caused by several specific biases that influenced the taxonomic richness of different parts of the fossil record, there is evidence that these biases largely compensated for one another so that the observed increase in alpha diversity was probably underestimated rather than overestimated (Bush and Bambach 2004).
Another important symptom of progressive development of communities is an increase in the evenness of species (or genus) abundance distribution. In primitive, pioneer, or suppressed communities, this distribution is strongly uneven: the community is overwhelmingly dominated by a few very abundant species. In more advanced, climax, or flourishing communities, this distribution is more even (Magurran 1988). The former type of community is generally more vulnerable. The evenness of species richness distribution in communities increased substantially during the Phanerozoic (Powell and Kowalewski 2002; Bush and Bambach 2004). It is most likely there was also an increase in habitat utilization, total biomass, and the rate of trophic flow in biota through the Phanerozoic (Powell and Kowalewski 2002).
The more complex the community, the more stable it is due to the development of effective interspecies interactions and homeostatic mechanisms based on the negative feedback principle. In a complex community, when the abundance of a species decreases, many factors arise that facilitate its recovery (e.g., food resources rebound while predator populations decline). Even if the species becomes extinct, its vacant niche may ‘recruit’ another species, most probably a related one that may acquire morphological similarity with its predecessor and thus will be assigned to the same genus by taxonomists. So a complex community can facilitate the stability (and longevity) of its components, such as niches, taxa and morphotypes. This effect reveals itself in the phenomenon of ‘coordinated stasis’. The fossil record contains many examples in which particular communities persist for million years while the rates of extinction and taxonomic turnover are minimized (Brett et al. 1996, 2007).
Selective extinction leads to the accumulation of ‘extinction-tolerant’ taxa in the biota (Sepkoski 1991b). Although there is evidence that mass extinctions can be nonselective in some aspects (Jablonski 2005), they are obviously highly selective with respect to the ability of taxa to endure unpredictable environmental changes. This can be seen, for instance, in the selectivity of the end-Cretaceous mass extinction with respect to the time of the first occurrence of genera. In younger cohorts, the extinction level was higher than that of the older cohorts (see Markov and Korotayev 2007: fig. 2). The same pattern can be observed during the periods of ‘background’ extinction as well. This means that genera differ in their ability to survive extinction events, and that extinction-tolerant genera accumulate in each cohort over the course of time. Thus, taxa generally become more stable and long-lived through the course of evolution, apart from the effects of communities. The communities composed of more stable taxa would be, in turn, more stable themselves, thus creating positive feedback.
The stepwise change of dominant taxa plays a major role in biotic evolution. This pattern is maintained not only by the selectivity of extinction (discussed above), but also by the selectivity of the recovery after crises (Bambach et al. 2002). The taxonomic structure of the Phanerozoic biota was changing in a stepwise way, as demonstrated by the concept of three sequential ‘evolutionary faunas’ (Sepkoski 1992). There were also stepwise changes in the proportion of major groups of animals with different ecological and physiological parameters. There was stepwise growth in the proportion of motile genera to non-motile, ‘physiologically buffered’ genera to ‘unbuffered’, and predators
to prey (Bambach et al. 2002). All these trends should have facilitated the stability of communities. For example, the diversification of predators implies that they became more specialized. A specialized predator regulates its prey’s abundance more effectively than a non-specialized predator.
There is also another possible mechanism of second-order positive feedback between diversity and its growth rate. Recent research has demonstrated a shift in typical relative-abundance distributions in paleocommunities after the Paleozoic (Wagner et al. 2006). One possible interpretation of this shift is that community structure and the interactions between species in the communities became more complex. In post-Paleozoic communities, new species probably increased ecospace more efficiently, either by facilitating opportunities for additional species or by niche construction (Wagner et al. 2006; Solé et al. 2002; Laland et al. 1999). This possibility makes the mechanisms underlying the hyperbolic growth of biodiversity and human population even more similar, because the total ecospace of the biota is analogous to the ‘carrying capacity of the Earth’ in demography. As far as new species can increase ecospace and facilitate opportunities for additional species entering the community, they are analogous to the ‘inventors’ of the demographic models whose inventions increase the carrying capacity of the Earth.
Exponential and logistic models of biodiversity imply several possible ways in which the rates of origination and extinction may change through time (Sepkoski 1991a). For instance, exponential growth can be derived from constant per-taxon extinction and origination rates, the latter being higher than the former. However, actual paleontological data suggest that origination and extinction rates did not follow any distinct trend through the Phanerozoic, and their changes through time look very much like chaotic fluctuations (Cornette and Lieberman 2004). Therefore, it is more difficult to find a simple mathematical approximation for the origination and extinction rates than for the total diversity. In fact, the only critical requirement of the exponential model is that the difference between the origination and extinction through time should be proportional to the current diversity level:
(No −Ne)/Δt ≈ kN, (Eq. 12)
where No and Ne are the numbers of genera with, respectively, first and last occurrences within the time interval Δt, and N is the mean diversity level during the interval. The same is true for the hyperbolic model. It does not predict the exact way in which origination and extinction should change, but it does predict that their difference should be roughly proportional to the square of the current diversity level:
(No −Ne)/Δt ≈ kN2. (Eq. 13)
In the demographic models discussed above, the hyperbolic growth of the world population was not decomposed into separate trends of birth and death rates. The main driving force of this growth was presumably an increase in the carrying capacity of the Earth. The way in which this capacity was realized – either by decreasing death rate or by increasing birth rate, or both – depended upon many factors and may varied from time to time.
The same is probably true for biodiversity. The overall shape of the diversity curve depends mostly on the differences in the mean rates of diversity growth in the Paleozoic (low), Mesozoic (moderate), and Cenozoic (high). The Mesozoic increase was mainly due to a lower extinction rate (compared to the Paleozoic), while the Cenozoic increase was largely due to a higher origination rate (compared to the Mesozoic) (see Markov and Korotayev 2007: 316, figs. 3a and b). This probably means that the acceleration of diversity growth during the last two eras was driven by different mechanisms of positive feedback between diversity and its growth rate. Generally, the increment rate ((No −Ne)/Δt) was changing in a more regular way than the origination
rate No/Δt and extinction rate Ne/Δt. The large-scale changes in the increment rate correlate better with N2 than with N (see Markov and Korotayev 2007: 316, Figs 3c and d), thus supporting the hyperbolic rather than the exponential model.
Conclusion
In mathematical models of historical macrodynamics, a hyperbolic pattern of world population growth arises from non-linear second-order positive feedback between the demographic growth and technological development. Based on the analogy with macrosociological models and diverse paleontological data, we suggest that the hyperbolic character of biodiversity growth can be similarly accounted for by non-linear second-order positive feedback between the diversity growth and the complexity of community structure. This hints at the presence, within the biosphere, of a certain analogue to the collective learning mechanism. The feedback can work via two parallel mechanisms: (1) a decreasing extinction rate (more surviving taxa – higher alpha diversity – communities become more complex and stable – extinction rate decreases – more taxa, and so on), and (2) an increasing origination rate (new taxa – niche construction – newly formed niches occupied by the next ‘generation’ of taxa – new taxa, and so on). The latter possibility makes the mechanisms underlying the hyperbolic growth of biodiversity and human population even more similar, because the total ecospace of the biota is analogous to the ‘carrying capacity of the Earth’ in demography. As far as new species can increase ecospace and facilitate opportunities for additional species entering the community, they are analogous to the ‘inventors’ of the demographic models whose inventions increase the carrying capacity of the Earth.
The hyperbolic growth of Phanerozoic biodiversity suggests that ‘cooperative’ interactions between taxa can play an important role in evolution, along with generally accepted competitive interactions. Due to this ‘cooperation’ (which may be roughly analogous to ‘collective learning’), the evolution of biodiversity acquires some features of a self-accelerating process. The same is naturally true of cooperation/collective learning in global social evolution. This analysis suggests that we can trace rather similar macropatterns within both the biological and social phases of Big History. These macropatterns can be represented by relatively similar curves and described accurately with very simple mathematical models.
NOTES
* This research has been supported by the Russian Science Foundation (Project No 14-11-00634).
[1] We denote as megaevolution all the process of evolution throughout the whole of Big History, whereas we denote as macroevolution the process of evolution during one of its particular phases.
[2] To be exact, the equation proposed by von Foerster and his colleagues looked as follows: . However, as von Hoerner (1975) and Kapitza (1999) showed, it can be simplified as .
[3] The second characteristic (p, standing for ‘probability’) is a measure of the correlation’s statistical significance. A bit counter-intuitively, the lower the value of p, the higher the statistical significance of the respective correlation. This is because p indicates the probability that the observed correlation could be accounted solely by chance. Thus, p = 0.99 indicates an extremely low statistical significance, as it means that there are 99 chances out of 100 that the observed correlation is the result of a coincidence, and, thus, we can be quite confident that there is no systematic relationship (at least, of the kind that we study) between the two respective variables. On the other hand, p = 1 × 10–16 indicates an extremely high statistical significance for the correlation, as it means that there is only one chance out of 10,000,000,000,000,000 that the observed correlation is the result of pure coincidence (a correlation is usually considered statistically significant once p < 0.05).
[4] In fact, with slightly different parameters (С = 164890.45; t0 = 2014) the fit (R2) between the dynamics generated by von Foerster’s equation and the macrovariation of world population for 1000–1970 CE as estimated by McEvedy and Jones (1978) and the U.S. Bureau of the Census (2013) reaches 0.9992 (99.92 per cent); for 500 BCE – 1970 CE this fit increases to 0.9993 (99.93 per cent) with the following parameters: С = 171042.78; t0 = 2016.
[5] In addition to this, the absolute growth rate is proportional to the population itself. With a given relative growth rate, a larger population will increase more in absolute number than a smaller one.
[6] Note that ‘the growth rate of technology’ here means the relative growth rate (i.e., the level to which technology will grow in a given unit of time in proportion to the level observed at the beginning of this period).
[7] Kremer did not test this hypothesis empirically in a direct way. Note, however, that our own empirical test of this hypothesis has supported it (see Korotayev, Malkov et al. 2006b: 141–146).
[8] Since literacy appeared, almost all of the Earth’s literate population has lived within the World System; hence, the literate population of the Earth and the literate population of the World System have been almost perfectly synonymous.
References
Abel W. 1980. Agricultural Fluctuations in Europe from the Thirteenth to the Twentieth Centuries. New York: St. Martin’s.
Aghion P., and Howitt P. 1998. Endogenous Growth Theory. Cambridge, MA: MIT Press.
Bambach R. K. 1977. Species Richness in Marine Benthic Habitats through the Phanerozoic. Paleobiology 3: 152–167.
Bambach R. K., Knoll A. H., and Sepkoski J. J. 2002. Anatomical and Ecological Constraints on Phanerozoic Animal Diversity in the Marine Realm. Proceedings of the National Academy of Sciences 99(10): 6854–6859.
Benton M. J. 1995. Diversification and Extinction in the History of Life. Science 268: 52–58.
Boyd R., and Richerson P. J. 1996. Why Culture is Common, but Cultural Evolution is Rare. Proceedings of the British Academy 88: 77–93.
Braudel F. 1973. Capitalism and Material Life, 1400–1800. New York: Harper and Row.
Brett C. E., Hendy A. J. W., Bartholomew A. J., Bonelli J. R., Jr., and McLaughlin P. I. 2007. Response of Shallow Marine Biotas to Sea-Level Fluctuations: A Review of Faunal Replacement and the Process of Habitat Tracking. Palaios 22: 228–244.
Brett C. E., Ivany L. C., and Schopf K. M. 1996. Coordinated Stasis: An Overview. Palaeogeography, Palaeoclimatology, Palaeoecology 127: 1–20.
Bush A. M., and Bambach R. K. 2004. Did Alpha Diversity Increase during the Phanerozoic? Lifting the Veils of Taphonomic, Latitudinal, and Environmental Biases. Journal of Geology 112: 625–642.
Chandler T. 1987. Four Thousand Years of Urban Growth: An Historical Census. Lewiston, NY: Edwin Mellen Press.
Christian D. 2005. Maps of Time: An Introduction to Big History. Berkeley, CA: University of California Press.
Chu C. Y. C., and Lee R. D. 1994. Famine, Revolt, and the Dynastic Cycle: Population Dynamics in Historic China. Journal of Population Economics 7: 351–378.
Chubarov V. V. 1991. The Middle Eastern Locomotive: The Developmental Pace of Technique and Technology in the Ancient World. The Archaic Society: The Main Problems of Developmental Sociology. Vol. 1 / Ed. by A. V. Korotayev and V. V. Chubarov, pp. 92–135. Moscow: Institute for History, Academy of Sciences, USSR. In Russian (Чубаров В. В. Ближневосточный локомотив: Темпы развития техники и технологии в древнем мире. Архаическое общество: Узловые проблемы социологии развития. Т. 1 / Ред. А. В. Коротаев, В. В. Чубаров, с. 92–135. М.: Ин-т истории АН СССР).
Cohen J. E. 1995. Population Growth and Earth’s Carrying Capacity. Science 269(5222): 341–346.
Cornette J. L., and Lieberman B. S. 2004. Random Walks in the History of Life. Proceedings of the National Academy of Sciences 101(1): 187–191.
Durkheim E. 1991 [1893]. The Division of Labor in Society. Sociological Method. Moscow: Nauka. In Russian (Дюркгейм Э. О разделении общественного труда. Метод социологии. М.: Наука).
von Foerster H., Mora P., and Amiot L. 1960. Doomsday: Friday, 13 November, A.D. 2026. Science 132: 1291–1295.
Goldstone J. A. 1991. Revolution and Rebellion in the Early Modern World. Berkeley, CA: University of California Press.
Golosovsky M. 2010. Hyperbolic Growth of the Human Population of the Earth: Analysis of Existing Models. History & Mathematics: Processes and Models of Global Dynamics / Ed. by L. Grinin, P. Herrmann, A. Korotayev, and A. Tausch, pp. 188–204. Volgograd: Uchitel.
Grinin L. E. 2007a. Problems in the Analysis of the Driving Forces of Historical Development: Social Progress and Social Evolution. Philosophy of History: Problems and Prospects / Ed. by Yu. I. Semenov, I. A. Gobozov, and L. E. Grinin, pp. 148–247. Moscow: KomKniga/URSS. In Russian (Гринин Л. Е. Проблемы анализа движущих сил исторического развития, общественного прогресса и социальной эволюции. Философия истории: проблемы и перспективы / Ред. Ю. И. Семенов, И. А. Гобозов, Л. Е. Гринин, с. 148–247. М.: КомКнига/URSS).
Grinin L. E. 2007b. Industrial Revolutions as the Most Important Thresholds in History. Man and Nature: Confrontation and Harmony. Series ‘Socionatural History: The Genesis of Natural and Societal Crises in Russia’ / Ed. by E. S. Kulpin, pp. 191–221. Moscow: Publishing-Analytical Centre ‘Energy’. In Russian (Гри-нин Л. Е. Производственные революции как важнейшие рубежи истории. Человек и природа: противостояние и гармония. Серия «Социоестественная история. Генезис кризисов природы и общества в России» / Ред. Э. С. Кульпин,с. 191–221. М.: Издательско-аналитический центр «Энергия»).
Grinin L. E. 2012. Macrohistory and Globalization. Volgograd: Uchitel.
Grinin L. E., Carneiro R. L., Korotayev A. V., and Spier F. (Eds.) 2011. Evolution: Cosmic, Biological, and Social. Volgograd: Uchitel.
Grinin L. E., and Korotayev A. V. 2006. Political Development of the World System: A Formal Quantitative Analysis. History & Mathematics: Historical Dynamics and Development of Complex Societies / Ed. by P. Turchin, L. E. Grinin, V. C. de Munck, and A. V. Korotayev, pp. 63–114. Moscow: KomKniga.
Grinin L. E., and Korotayev A. V. 2007a. Political Development of the World System: A Formal Quantitative Analysis. History and Mathematics: Macrohistorical Dynamics of the Society and State / Ed. by S. Yu. Malkov, L. E. Grinin, and A. V. Korotayev, pp. 49–101. Moscow: KomKniga. In Russian (Гринин Л. Е., Коротаев А. В. Политическое развитие Мир-Системы: формальный и количественный анализ. История и Математика: макроисторическая динамика общества и государства / Ред. С. Ю. Малков, Л. Е. Гринин, А. В. Коротаев, с. 49–101. М.: КомКнига).
Grinin L. E., and Korotayev A. V. 2007b. Social Macroevolution and Historical Process. Filosofiya i obschestvo 2: 19–66; 3: 5–48; 4: 17–50. In Russian (Гринин Л. Е., Коротаев А. В. Социальная макроэволюция и исторический процесс. Философия и общество 2: 19–66; 3: 5–76; 4: 17–50).
Grinin L. E., and Korotayev A. V. 2008. Macroevolution and the World-System: New Facets of Conceptualization. Istoriya i sovremennost 1: 3–31. In Russian (Гринин Л. Е., Коротаев А. В. Макроэволюция и Мир-Система: новые грани концептуализации. История и современность 1: 3–31).
Grinin L. E., and Korotayev A. V. 2009а. Social Macroevolution: Growth of the World System Integrity and a System of Phase Transitions. World Futures 65(7): 477–506.
Grinin L. E., and Korotayev A. V. 2009b. Social Macroevolution: Genesis and Transformations of the World System. Moscow: LIBROKOM. In Russian (Гринин Л. Е., Коротаев А. В. Социальная макроэволюция: Генезис и трансформации Мир-Системы. М.: ЛИБРОКОМ).
Grinin L. E., and Korotayev A. V. 2012. Cycles, Crises, and Traps of the Modern World System. Moscow: URSS. In Russian (Гринин Л. Е, Коротаев А. В. Циклы, кризисы, ловушки современной Мир-Системы. М.: URSS).
Grinin L. E., Korotayev A. V., and Malkov S. Yu. 2008. Mathematical Models of Socio-Demographic Cycles and Escape from the Malthusian Trap. Problems of Mathematical History: Mathematical Modeling of Historical Processes / Ed. by G. G. Malinetsky, and A. V. Korotayev, pp. 78–117. Moscow: URSS. In Russian (Гринин Л. Е., Коротаев А. В., Малков С. Ю. Математические модели социально-демографических циклов и выхода из мальтузианской ловушки. Проблемы математической истории. Математическое моделирование исторических процессов / Ред. Г. Г. Малинецкий, А. В. Коротаев, с. 78–117. М.: URSS).
Grinin L. E., Malkov S. Yu., Gusev V. A., and Korotayev A. V. 2009. Possible Directions for Further Development of Socio-Demographic Cycle Theory and Mathematical Models of the Escape from the Malthusian Trap. History & Mathematics: Processes & Models / Ed. by S. Yu. Malkov, L. E. Grinin, and A. V. Korotayev, pp. 134–210. Moscow: URSS. In Russian (Гринин Л. Е., Малков С. Ю., Гусев В. А., Коротаев А. В. Некоторые возможные направления развития теории социально-демографических циклов и математические модели выхода из мальтузианской ловушки. История и Математика: процессы и модели / Ред. С. Ю. Малков, Л. Е. Гринин, А. В. Коротаев, с. 134–210. М.: URSS).
Grinin L. E., Markov A. V., and Korotayev A. V. 2008. Macroevolution in Biological and Social Systems. Мoscow: LKI. In Russian (Гринин Л. Е., Марков А. В., Коротаев А. В. Макроэволюция в живой природе и обществе. М.: ЛКИ).
Grinin L. E., Markov A. V., and Korotayev A. V. 2009a. Aromorphoses in Biological and Social Evolution: Some General Rules for Biological and Social Forms of Macroevolution. Social Evolution & History 8(2): 6–50.
Grinin L. E., Markov A. V., and Korotayev A. V. 2009b. Aromorphoses in Biological and Social Evolution: An Experiment Comparing Biological and Social Forms of Macroevolution. Evolution: Cosmic, Biological, and Social / Ed. by L. E. Grinin, A. V. Markov, and A. V. Korotayev, pp. 176–225. Moscow: LIBROCOM. In Russian (Гринин Л. Е., Марков А. В., Коротаев А. В. Ароморфозы в живой природе и обществе: опыт сравнения биологической и социальной форм макроэволюции. Эволюция: космическая, биологическая, социальная / Ред. Л. Е. Гринин, А. В. Марков, А. В. Коротаев, с. 176–225. М.: ЛИБРОКОМ).
Grinin L. E., Markov A. V., and Korotayev A. V. 2011. Biological and Social Aromorphoses: A Comparison between Two Forms of Macroevolution. Evolution: Cosmic, Biological, and Social / Ed. by L. E. Grinin, R. L. Carneiro, A. V. Korotayev, and F. Spier, pp. 162–211. Volgograd: Uchitel.
Grinin L. E., Markov A. V., and Korotayev A. V. 2012. Biological and Social Phases of Big History: Similarities and Differences of Evolutionary Principles and Mechanisms. Evolution: A Big History Perspective / Ed. by L. E. Grinin, A. V. Korotayev, and B. H. Rodrigue, pp. 158–198. Volgograd: Uchitel.
Grossman G., and Helpman E. 1991. Innovation and Growth in the Global Economy. Cambridge, MA: MIT Press.
Gruebler A. 2006. Urbanization as Core Process of Global Change: The Last 1000 Years and Next 100. Paper presented at the International Seminar ‘Globalization as Evolutionary Process: Modeling, Simulating, and Forecasting Global Change’, International Institute for Applied Systems Analysis (IIASA), Laxenburg, Austria, April 6–8.
Hallpike C. R. 1986. Principles of Social Evolution. Oxford: Clarendon.
Heylighen F. 2011. Conceptions of a Global Brain: An Historical Review. Evolution: Cosmic, Biological, and Social / Ed. by L. E. Grinin, R. L. Carneiro, A. V. Korotayev, and F. Spier, pp. 274–289. Volgograd: Uchitel.
von Hoerner S. J. 1975. Population Explosion and Interstellar Expansion. Journal of the British Interplanetary Society 28: 691–712.
Jablonski D. 2005. Mass Extinctions and Macroevolution. Paleobiology 31(2): 192–210.
Jones C. I. 1995. R&D-based Models of Economic Growth. The Journal of Political Economy 103: 759–784.
Jones C. I. 2005. The Shape of Production Functions and the Direction of Technical Change. The Quarterly Journal of Economics 120: 517–549.
Kapitza S. P. 1999. How Many People have ever Lived, are Living, and will Live on the Earth. Moscow: Nauka. In Russian (Капица С. П. Сколько людей жило, живет и будет жить на земле. М.: Наука).
van Kessel-Hagesteijn R. 2009. Dynamics in Political Centralization Processes: The Various Faces of ‘Decline’. International Symposium on Early State Formation Handbook, pp. 46–63. Peking: National Academy of China.
Komlos J., and Nefedov S. 2002. A Compact Macromodel of Pre-Industrial Population Growth. Historical Methods 35: 92–94.
Korotayev A. 2005. A Compact Macromodel of World System Evolution. Journal of World-Systems Research 11(1): 79–93.
Korotayev A. V. 2006. The Long-Term Political-Demographic Dynamics of Egypt: Cycles and Trends. Moscow: Vostochnaya Literatura. In Russian (Коротаев А. В. Долгосрочная политико–демографическая динамика Египта: циклы и тенденции. М.: Восточная литература).
Korotayev A. V. 2007. Compact Mathematical Models of World System Development, and How They Can Help Us to Clarify Our Understanding of Globalization Processes. Globalization as Evolutionary Process: Modeling Global Change / Ed. by G. Modelski, T. Devezas, and W. R. Thompson, pp. 133–160. London: Routledge.
Korotayev A. V. 2008. Globalization and Mathematical Modeling of Global Development. Hierarchy and Power in the History of Civilizations: Political Aspects of Modernity / Ed. by L. E. Grinin, D. D. Beliaev, and A. V. Korotayev, pp. 225–240. Moscow: LIBROCOM/URSS.
Korotayev A. V. 2009. Compact Mathematical Models of the World System Development and Their Applicability to the Development of Local Solutions in Third World Countries. Systemic Development: Local Solutions in a Global Environment / Ed. by J. Sheffield, pp. 103−116. Litchfield Park, AZ: ISCE Publishing.
Korotayev A. V. 2012. Globalization and Mathematical Modeling of Global Development. Globalistics and Globalization Studies / Ed. by L. Grinin, I. Ilyin, and A. Korotayev, pp. 148–158. Moscow – Volgograd: Moscow University – Uchitel.
Korotayev A. V., and Khaltourina D. A. 2006. Introduction to Social Macrodynamics: Secular Cycles and Millennial Trends in Africa. Moscow: URSS.
Korotayev A. V., Khaltourina D. A., and Bogevolnov J. V. 2010. Laws of History. Secular Cycles and Millennial Trends. Demography. Economy. Wars. Moscow: URSS. In Russian (Коротаев А. В., Халтурина Д. А., Божевольнов Ю. В. Законы истории. Вековые циклы и тысячелетние тренды. Демография. Экономика. Войны. М.: URSS).
Korotayev A. V., Khaltourina D. A., Malkov A. S., Bogevolnov J. V., Kobzeva S. V., and Zinkina J. V. 2010. Laws of History: Mathematical Modeling and Forecasting World and Regional Development. Moscow: URSS. In Russian (Коротаев А. В., Халтурина Д. А., Малков А. С., Божевольнов Ю. В., Кобзева С. В., Зинькина Ю. В. Законы истории. Математическое моделирование и прогнозирование мирового и регионального развития. М.: URSS).
Korotayev A. V., Komarova N. L., and Khaltourina D. A. 2007. Laws of History: Secular Cycles and Millennial Trends. Moscow: URSS. In Russian (Коротаев А. В., Комарова Н. Л., Халтурина Д. А. Законы истории. Вековые циклы и тысячелетние тренды. М.: URSS).
Korotayev A. V., and Malkov S. Yu. 2012. Mathematical Models of the World-System Development. Routledge Handbook of World-Systems Analysis / Ed. by S. Babones, and C. Chase-Dunn, pp. 158–161. London: Routledge.
Korotayev A. V., Malkov A. S., and Khaltourina D. A. 2006a. Introduction to Social Macrodynamics: Compact Macromodels of the World System Growth. Moscow: URSS.
Korotayev A. V., Malkov A. S., and Khaltourina D. A. 2006b. Introduction to Social Macrodynamics: Secular Cycles and Millennial Trends. Moscow: URSS.
Kremer M. 1993. Population Growth and Technological Change: One Million B.C. to 1990. The Quarterly Journal of Economics 108: 681–716.
Kurdyumov S. P. (Ed.) 1999. Blow-up Regimes. Moscow: Nauka. In Russian (Курдюмов С. П. (Ред.). Режимы с обострением. М.: Наука).
Kuznets S. 1960. Population Change and Aggregate Output. Demographic and Economic Change in Developed Countries, pp. 324–340. Princeton, NY: Princeton University Press.
Laland K. N., Odling-Smee F. J., and Feldman M. W. 1999. Evolutionary Consequences of Niche Construction and Their Implications for Ecology. Proceedings of the National Academy of Sciences 96(18): 10242–10247.
Lekevičius E. 2009. On Some Analogues between the Evolution of Ecosystems and Economic Development: From A. Smith and C. Darwin to the Newest Ideas. Evolution: Cosmic, Biological, and Social / Ed. by L. E. Grinin, A. V. Markov, and A. V. Korotayev, pp. 226–259. Moscow: LIBROKOM. In Russian (Лекявичюс Э. О некоторых аналогиях между эволюцией экосистем и развитием экономики: от А. Смита и Ч. Дарвина до новейших идей. Эволюция: космическая, биологическая, социальная / Ред. Л. Е. Гринин, А. В. Марков, А. В. Коротаев, с. 226–259. М.: ЛИБРОКОМ).
Lekevičius E. 2011. Ecological Darwinism or Preliminary Answers to Some Crucial Though Seldom Asked Questions. Evolution: Cosmic, Biological, and Social / Ed. by L. E. Grinin, R. L. Carneiro, A. V. Korotayev, and F. Spier, pp. 101–121. Volgograd: Uchitel.
Levinson D., and Malone M. 1980. Toward Explaining Human Culture. New Haven, CT: HRAF Press.
Maddison A. 2001. Monitoring the World Economy: A Millennial Perspective. Paris: OECD.
Magurran A. E. 1988. Ecological Diversity and Its Measurement. Princeton, NY: Princeton University Press.
Malthus T. 1978 [1798]. Population: The First Essay. Ann Arbor, MI: University of Michigan Press.
Markov A. V. 2001. Dynamics of the Marine Faunal Diversity in the Phanerozoic: A New Approach. Paleontological Journal 35: 1–9.
Markov A. V. 2002. Mechanisms Responsible for the Increase in the Taxonomic Diversity in the Phanerozoic Marine Biota. Paleontological Journal 36: 121–130.
Markov A. V., and Korotayev A. V. 2007. Phanerozoic Marine Biodiversity Follows a Hyperbolic Trend. Palaeoworld 16: 311–318.
Markov A. V., and Korotayev A. V. 2008. Hyperbolic Growth of Phanerozoic Marine and Continental Biodiversity. Zhurnal obshchey biologii 3: 175–194. In Russian (Марков А. В., Коротаев А. В. Гиперболический рост разнообразия морской и континентальной биот фанерозоя. Журнал общей биологии 3: 175–194).
Markov A. V., and Naymark E. B. 2009. On Some of the Newest Achievements in Evolutionary Biology. Evolution: Cosmic, Biological, and Social / Ed. by L. E. Gri- nin, A. V. Markov, and A. V. Korotayev, pp. 306–363. Moscow: LIBROCOM. In Russian (Марков А. В., Наймарк Е. Б. О некоторых новейших достижениях эволюционной биологии. Эволюция: космическая, биологическая, социальная / Ред. Л. Е. Гринин, А. В. Марков, А. В. Коротаев, с. 306–363. М.: ЛИБРОКОМ).
McEvedy C., and Jones R. 1978. Atlas of World Population History. New York: Facts on File.
Meliantsev V. A. 2004. Russia’s Comparative Economic Development in the Long Run. Social Evolution & History 3(1): 106–136
Mesoudi A., Whiten A., and Laland K. 2006. Towards a Unified Science of Cultural Evolution. Behavioral and Brain Sciences 29: 329–383.
Modelski G. 2003. World Cities: –3000 to 2000. Washington: Faros2000.
Naroll R., and Divale W. T. 1976. Natural Selection in Cultural Evolution: Warfare versus Peaceful Diffusion. American Ethnologist 3: 97–128.
Nefedov S. A. 2004. A Model of Demographic Cycles in Traditional Societies: The Case of Ancient China. Social Evolution & History 3(1): 69–80.
Podlazov A. V. 2004. Theory of the Global Demographic Process. Mathematical Modeling of Social and Economic Dynamic / Ed. by M. G. Dmitriev, and A. P. Petrov, pp. 269–272. Moscow: Russian State Social University.
Powell M. G., and Kowalewski M. 2002. Increase in Evenness and Sampled Alpha Diversity through the Phanerozoic: Comparison of Early Paleozoic and Cenozoic Marine Fossil Assemblages. Geology 30(4): 331–334.
Raup D. M., Gould S. J., Schopf T. J. M., and Simberloff D. S. 1973. Stochastic Models of Phylogeny and the Evolution of Diversity. Journal of Geology 81(5): 525–542.
Raup D. M., and Sepkoski J. J. 1984. Periodicity of Extinctions in the Geologic Past. Proceedings of the National Academy of Sciences 81(3): 801–805.
Reeve H. K., and Hölldobler B. 2007. The Emergence of a Superorganism through Intergroup Competition. Proceedings of the National Academy of Sciences of the USA 104(23): 9736−9740.
Reznikova Zh. 2011. Evolutionary and Behavioural Aspects of Altruism in Animal Communities: Is There Room for Intelligence? Evolution: Cosmic, Biological, and Social / Ed. by L. E. Grinin, R. L. Carneiro, A. V. Korotayev, and F. Spier, pp. 162–211. Volgograd: Uchitel.
Robson S. K., and Traniello J. F. A. 2002. Transient Division of Labour and Behavioral Specialization in the Ant Formica Schaufussi. Naturwissenschaften 89: 128–131.
Rohde R. A., and Muller R. A. 2005. Cycles in Fossil Diversity. Nature 434(7030): 147–148.
Ryabko B., and Reznikova Zh. 2009. The Use of Ideas of Information Theory for Studying ‘Language’ and Intelligence in Ants. Entropy 11(4): 836–853.
Sepkoski J. J. 1988. Alpha, Beta or Gamma: Where Does All the Diversity Go? Paleobiology 14: 221–234.
Sepkoski J. J. 1991a. Population Biology Models in Macroevolution. Analytical Paleobiology. Short Courses in Paleontology. Vol. 4 / Ed. by N. L. Gilinsky, and P. W. Signor, pp. 136–156. Knoxville, TN: The Paleontological Society.
Sepkoski J. J. 1991b. Diversity in the Phanerozoic Oceans: A Partisan Review. The Unity of Evolutionary Biology / Ed. by E. C. Dudley, pp. 210–326. Portland, OR: Dioscorides Press.
Sepkoski J. J. 1992. Phylogenetic and Ecologic Patterns in the Phanerozoic History of Marine Biodiversity. Systematics, Ecology and the Biodiversity Crisis / Ed. by N. Eldredge, pp. 77–100. New York: Columbia University Press.
Sepkoski J. J. 1994. Limits to Randomness in Paleobiologic Models: The Case of Phanerozoic Species Diversity. Acta Palaeontologica Polonica 38(3–4): 174–198.
Sepkoski J. J., Bambach R. K., Raup D. M., and Valentine J. W. 1981. Phanerozoic Marine Diversity and the Fossil Record. Nature 293: 435–437.
Severtsov A. S. 1987. Criteria and Conditions for the Appearance of Aromorphic Organization. Evolution and Biocenotic Crises / Ed. by L. P. Tatarinov, and A. P. Rasnitsyn, pp. 64–76. Moscow: Nauka. In Russian (Северцов А. С. Критерии и условия возникновения ароморфной организации. Эволюция и биоценотические кризисы / Ред. Л. П. Татаринов, А. П. Расницын, с. 64–76. М.: Наука).
Shmal’gauzen I. I. 1969. The Problems of Darwinism. Leningrad: Nauka. In Russian (Шмальгаузен И. И. Проблемы дарвинизма. Л.: Наука).
Simon J. 1977. The Economics of Population Growth. Princeton, NY: Princeton University Press.
Simon J. 2000. The Great Breakthrough and Its Cause. Ann Arbor, MI: University of Michigan Press.
Solé R. V., Montoya J. M., and Erwin D. H. 2002. Recovery after Mass Extinction: Evolutionary Assembly in Large-Scale Biosphere Dynamics. Philosophical Transactions of the Royal Society of London, B 357: 697–707.
Spencer H. 1898. Principles of Sociology. Complete Work. Vol. 1. St. Petersburg: T-vo I. D. Sytina, Otd. N. A. Rubakina. In Russian (Спенсер Г. Основания социологии. Соч. Т. 1. СПб.: Т-во И. Д. Сытина, Отд. Н. А. Рубакина).
Taagapera R. 1976. Crisis around 2005 A.D.? A Technology-Population Interaction Model. General Systems 21: 137–138.
Taagapera R. 1979. People, Skills, and Resources: An Interaction Model for World Population Growth. Technological Forecasting and Social Change 13: 13–30.
Tsirel S. V. 2004. On the Possible Reasons for the Hyperexponential Growth of the Earth Population. Mathematical Modeling of Social and Economic Dynamics / Ed. by M. G. Dmitriev, and A. P. Petrov, pp. 367–369. Moscow: Russian State Social University.
Turchin P. 2003. Historical Dynamics: Why States Rise and Fall. Princeton, NY: Princeton University Press.
Turchin P. 2005a. Dynamical Feedbacks between Population Growth and Sociopolitical Instability in Agrarian States. Structure and Dynamics 1(1). URL: http://eschol arship.org/uc/item/0d17g8g9.
Turchin P. 2005b. War and Peace and War: Life Cycles of Imperial Nations. New York: Pi Press.
Turchin P., and Korotayev A. 2006. Population Density and Warfare: A Reconsideration. Social Evolution & History 5(2): 121–158.
Turchin P., and Nefedov S. 2009. Secular Cycles. Princeton, NY: Princeton University Press.
UN Population Division. 2014. United Nations Population Division database. URL: http://www.un.org/esa/population.
US Bureau of the Census. 2013. World Population Information. URL: http://www. census.gov/ipc /www/world.html.
Usher D. 1989. The Dynastic Cycle and the Stationary State. The American Economic Review 79: 1031–1044.
Wagner P. J., Kosnik M. A., and Lidgard S. 2006. Abundance Distributions Imply Elevated Complexity of Post-Paleozoic Marine Ecosystems. Science 314: 1289–1292.
World Bank. 2013. World Development Indicators Online. URL: http://data.world bank.org/indicator.