What Will Be The Long-Term Development Of The Population Of The German Reich After The First World War? – Introduction and Abstract

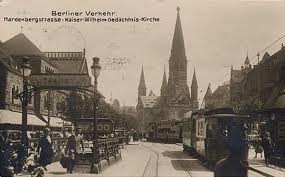
Berlin1920s

Picture: en.wikipedia.org

General Introduction
The 1920’s and 1930’s are among the most interesting periods in the history of modelling and forecasting. The continuous decline of Western birth rates in the inter-war period set alarm bells ringing. Concerns about the future size and growth of the populations of these nations were heightened by long-term extrapolations of time series, and by population projections and population forecasts. Concerns turned to acute anxiety after it became to appear that the leading Western European nations would not replace their populations. The imminent population decrease threatened to diminish the relative power of what were called in those days the ‘civilized’ nations and ultimaltely to result in ‘race suicide’ (the extinction of populations).
In some countries statisticians, demographers, or economists developed population projection methodology in order to free current debates on the population issue from emotional, subjective argument. In the two leading Fascist countries – but in other countries as well – population numbers were seen as the key to economic, political and military strenght. 

From the book Populations, Projections and Politics. Critical and Historical Essays on Early Twentieth Century Population Forecasting. Edited by Jochen Fleischhacker, Henk A. de Gans and Thomas Burch, The Rozenberg Quarterly already published the essay by Henk A. de Gans – The Innovation of Population Forecasting Methodology in the Inter-War Period: The Case of The Netherlands.

As second essay from the book we present: Wie wird sich die Bevölkerung des Deutschen Reiches langfristig nach dem Erstem Weltkrieg entwickeln? Die ersten amtlichen Bevölkerungsvorausberechnungen in den 1920er Jahren.
In this essay Jochen Fleischhacker discusses the first official population forecasts of the German Reich in the 1920s. After the end of Wold War I concern in the German Reich increased that a slowing/deteriorating growth of population could have lasting consequences for society and the economy. This concern was based on population forecasts computed by official Reich statisticians in the 1920s. These calculations were primarily based on the initial demographic position of Germany after the end of World War 1. A quantifying of future demographic developments/trends was founded on different assumptions relating both the natural increase and to migration. Fertility trends before and after 1918 became a center of interest. The question of future demographic development influenced by this continuously decreasing birth rate was a focal point of the authors of the first official population forecast published by the German Statistical Office (Das Statistisches Reichsamt) in 1926.
Following the ideas of the American biologist Sir Peter Brian Medawar (1915-1987), one could say that forecasters were led by the illusion that the complexity of the factors which influence fertility behaviour could be summed up in only one number. Measurements such as the net reproductive rate (NRR) became the numerical expression of the fertility behavior of the population. Differential fertility became a central feature of the demographic forecasts and was used for constructing “high and low quality” sub-populations, for instance for invalids and widows. This social classification was seen as associated with differences in the reproductive behavior, and as having direct implications for population policy. These 1926 projections showed clearly what high social costs the German Reich was going to face. Various possibilities in the realm of social and family policies were discussed in order to get a grip on the declining birth and fertility rates. Suggestions for material and non-material support of families and for securing the social situation of the ageing population of Germany were broadly discussed after 1930. Surprisingly enough it is hard to find any previous studies of this discussion.

Abstract: What Will Be The Long-Term Development Of The Population Of The German Reich After The First World War? The first official population forecasts in the 1920s.
This article will acquaint the reader with the first demographic forecasts of the national statistical office of the German Reich, which were carried out in the 1920s. I will discuss the major changes in the age structure of the population of Germany during and after the First World War. In addition, I will analyse the calculation models used and the results, in addition to sketching out the implications for population politics.

The First World War meant the end of steady population growth and also the end of a balanced age structure of the population (cf. Graph 9.1, see Article = referring to the article by Prof.dr. Fleischhacker published next to this abstract- – Age structure for the German population after the census from 1925 and the present area of territory after 1919 (Altersaufbau der Bevölkerung im Deutschen Reich nach der Volkszählung 1925 und dem Gebietstand nach 1919)) During the war years the population decreased by 5.9 million, dropping to a level of “just” 61.9 million. Demographic development was disrupted by the war in several ways: there were drastic reductions in the number of marriages and births, increases in the average age at marriage for both men and women and, of course, an enormous increase in mortality for young men. The official statistical reports summarised the changing age and sex structure of the population with the words: “more adults, but fewer children”.
Comparing the statistics of 1925 to those of 1910, the percentage of children under 15 decreased by 17.9% and that of 15 to 65 year-olds by 20%. At the same time the percentage of people over 65 years of age increased by 25.6%. Between 1914 and 1919 there were approximately 3.3 million fewer children born than would have been normal. Declines in the birth rate were also a standard feature of post-war times. In 1912 the percentage of children under 15 of the total population was 33.9. This dropped by 1925 to 25.8%.

Losses in the male population affected the age groups above 20. They led to a long-term imbalance in the sex structure of the population in the form of a large excess of women (cf. Graph 9.2, see article – Numbers of people who died or soldiers killed in action in age groups (in 1000) (Die im Weltkrieg gefallenen und gestorbenen deutschen Militärpersonen nach Altersjahren (in 1000)). This phenomenon had a significant influence on marriage trends. In 1913 the average age at first marriage was approximately 27.5 for men. It rose to 29.0 by 1919.
The corresponding figure for the female population rose in the same period from 24.7 to 26.0. According to statistical estimates there were about 870,000 fewer marriages during the war years than one normally would have expected. As a result, birth rates dropped from 27.1‰ in 1913 to 22.1‰ in the years from 1921 to 1925.
Against the backdrop of these disturbances in the structure and total size of the population the German statistical office produced its first population forecasts in 1926. They predicted that shifts in age structure would determine demographic trends for the coming decades. Their aim was to forecast population growth and developments in birth rates for the period from 1925 to 1975 (cf. Graph 9.3, see article– Marriages, Birth and Death in Germany, 1. First quarter 1913 -3. quarter 1925 (per 1000 inhabitants) (Eheschliessungen, Geburten und Sterbefälle im Deutschen Reich, 1. Vierteljahr 1913 – 3. Vierteljahr 1925, (auf 1000 Einwohner))).

They assumed constant age-specific mortality rates over this period. In addition, they assumed a closed population. Age-specific marital fertility was considered the decisive factor influencing future population developments. Mean values of age-specific fertility were calculated for the respective five-year child-bearing age groups on the basis of average marital fertility in the years 1924-1925. The degree of participation of the respective five-year age group in annual marital fertility was determined along with the size of the child-bearing age groups. The change factor for the marriage trend was calculated under the assumption that the proportion of married women in all age groups would change to the same extent as the entire stock of female population. The forecasts were carried out for three hypothetical cases of development. In the first case the annual number of live births within wedlock from 1925 to 1927 remains constant at the level of 1923. In the second case marital fertility remains at the average level of live births calculated for the years 1924 and 1925, taking into consideration the number of live births in 1923. In the third case marital fertility sinks from the average of the years 1924-1925 at a decreasing pace by a total of 25% up to the year 1955. After that marital fertility remains constant.

The results of these three different forecasts show the extent to which the number of live births and marital fertility is influenced by the age structure of the female population of childbearing age (Graph 9.4, see article – Number of births and marital fertility combined with the three assumed development
cases. Assumption: I Number of births is constant to 1975; II marital fertility is constant to 1975; III marital fertility is declining to 1955 at 25% and after this period constant (Zahl der Lebendgeborenen und die eheliche Fruchtbarkeit gemäss den drei für die Berechnungen angenommenen Entwicklungsfällen)).
The calculations exhibit noticeable changes particularly in the third case. As a consequence of the significant decrease in marital fertility and the structural changes stemming from the entrance of the numerically weak birth years of 1915 to 1919 into the age group with the “highest fertility”, the annual number of births drops constantly. This trend determines the long-term demographic development, leading to an uneven age distribution and to altered population dynamics. In all three cases of potential development there is a decrease in population growth, which occurs more or less rapidly, however,depending on the individual case (cf. Graph 9.5, see article – Development of the total population from 1925 to 1975 with the three assumed development cases. I Number of births is constant to 1975; II marital fertility is constant to 1975; III marital fertility is declining to 1955 at 25% and after this period constant. (Die Entwicklung der Bevölkerungszahl von 1925 bis 1975 unter der Annahme I, II und III)).
On the basis of the forecasts of the total population the Statistical Office made calculations for the development of the corresponding birth- and death rates for the period 1925-1975.
These forecasts show once again, in all three cases, a rapidly aging population (cf. Graph 9.6, see article – Development of Births and Deaths (in 1000 of the total population) (Die Entwicklung der Geburten- und Sterbeziffer (in 1000 der Bevölkerung))).

A second, entirely new forecast was carried out in 1930 for a period of over 75 years. The main focus was on the downward trend in births and fertility in the postwar years. This development was interpreted as a “conscious will to limit the rearing of children”. The substantive question was whether future demographic developments would be characterised by wavelike drops in the number of births resulting from the combination of structural changes and waning reproductive behaviour. To estimate future population development a calculation model was chosen for evaluating the interaction of age-structure and average rates per women. Changed individual marital fertility behaviour is viewed as the most influential component. A trend is calculated for marital fertility for the entire female population of childbearing age for the years 1922 to 1927. For purposes of determining standardised fertility rates, structural influences and the changed age structure of women of childbearing age or fluctuations in economic trends are not taken into consideration. In order to be able to judge the changes in marital developments, one first determined the proportion of married women of childbearing age.

First, one calculated standardised age-at-marriage figures for the male population in relation to marital frequency for the years 1910/1911, in order to be able to calculate the difference between expected and actual marriages for each age group in the years 1924 to 1927. The connections between altered marriage frequency and reproductive behaviour of the entire population were determined on the basis of data on marital trends in Prussia. Taken in reference to marriage duration and birth parity of the first, second, third, fourth and further births, these data show a decline in first and second births for the years 1922 to 1927. Mortality assumptions for the forecast, were based on the German life table for 1924-1926, and age-specific mortality figures were taken to be constant over the projection period. Emigration and immigration flows were excluded from the calculations.
To calculate the birth and marital fertility trends two hypothetical cases were formulated.
In the first case (A), the annual number of live births remains equal to the number of live births in the year 1927.
In the second case (B), marital and extra-marital fertility declines from the level of 1927 by a total of 25% by 1955. The shifts in age and sex structure of the population stemming from the First World War continue wavelike into the future under the conditions of both hypothetical cases. The transition of the boom years (people born between 1905 and 1909) from middle age to the over-65 age group means an increase in the percentage of elderly (cf. Graph 9.7, see article – Changes in the composition of age groups which are influenced through the ageing of the present total population (Veränderungen in der Besetzung der Altersklassen durch das Altern des gegenwärtigen Bevölkerungsbestandes)). The relative number of people married drops after 1940, as the low-birth generation born during the war moves into the age groups with the highest marriage frequency.

The results of these three different forecasts show the extent to which the number of live births and marital fertility is influenced by the age structure of the female population of childbearing age (Graph 9.4, see article – Number of births and marital fertility combined with the three assumed development cases.
Assumption: I Number of births is constant to 1975;
II marital fertility is constant to 1975;
III marital fertility is declining to 1955 at 25% and after this period constant (Zahl der Lebendgeborenen und die eheliche Fruchtbarkeit gemäss den drei für die Berechnungen angenommenen Entwicklungsfällen)).

The calculations exhibit noticeable changes particularly in the third case. As a consequence of the significant decrease in marital fertility and the structural changes stemming from the entrance of the numerically weak birth years of 1915 to 1919 into the age group with the “highest fertility”, the annual number of births drops constantly. This trend determines the long-term demographic development, leading to an uneven age distribution and to altered population dynamics. In all three cases of potential development there is a decrease in population growth, which occurs more or less rapidly, however,depending on the individual case (cf. Graph 9.5, see page 172 – Development of the total population from 1925 to 1975 with the three assumed development cases.
I Number of births is constant to 1975;
II marital fertility is constant to 1975;
III marital fertility is declining to 1955 at 25% and after this period constant. (Die Entwicklung der Bevölkerungszahl von 1925 bis 1975 unter der Annahme I, II und III)).
On the basis of the forecasts of the total population the Statistical Office made calculations for the development of the corresponding birth- and death rates for the period 1925-1975.

These forecasts show once again, in all three cases, a rapidly aging population (cf. Graph 9.6, see article – Development of Births and Deaths (in 1000 of the total population) (Die Entwicklung der Geburten- und Sterbeziffer (in 1000 der Bevölkerung))).
A second, entirely new forecast was carried out in 1930 for a period of over 75 years. The main focus was on the downward trend in births and fertility in the postwar years. This development was interpreted as a “conscious will to limit the rearing of children”. The substantive question was whether future demographic developments would be characterised by wavelike drops in the number of births resulting from the combination of structural changes and waning reproductive behaviour. To estimate future population development a calculation model was chosen for evaluating the interaction of age-structure and average rates per women. Changed individual marital fertility behaviour is viewed as the most influential component. A trend is calculated for marital fertility for the entire female population of childbearing age for the years 1922 to 1927. For purposes of determining standardised fertility rates, structural influences and the changed age structure of women of childbearing age or fluctuations in economic trends are not taken into consideration. In order to be able to judge the changes in marital developments, one first determined the proportion of married women of childbearing age. First, one calculated standardised age-at-marriage figures for the male population in relation to marital frequency for the years 1910/1911, in order to be able to calculate the difference between expected and actual marriages for each age group in the years 1924 to 1927. The connections between altered marriage frequency and reproductive behaviour of the entire population were determined on the basis of data on marital trends in Prussia. Taken in reference to marriage duration and birth parity of the first, second, third, fourth and further births, these data show a decline in first and second births for the years 1922 to 1927. Mortality assumptions for the forecast, were based on the German life table for 1924-1926, and age-specific mortality figures were taken to be constant over the projection period. Emigration and immigration flows were excluded from the calculations.

To calculate the birth and marital fertility trends two hypothetical cases were formulated. In the first case (A), the annual number of live births remains equal to the number of live births in the year 1927. In the second case (B), marital and extra-marital fertility declines from the level of 1927 by a total of 25% by 1955. The shifts in age and sex structure of the population stemming from the First World War continue wavelike into the future under the conditions of both hypothetical cases. The transition of the boom years (people born between 1905 and 1909) from middle age to the over-65 age group means an increase in the percentage of elderly (cf. Graph 9.7, see article – Changes in the composition of age groups which are influenced through the ageing of the present total population (Veränderungen in der Besetzung der Altersklassen durch das Altern des gegenwärtigen Bevölkerungsbestandes)). The relative number of people married drops after 1940, as the low-birth generation born during the war moves into the age groups with the highest marriage frequency.

The surplus of women in the age groups 25 to 50 leads to an increase in the number of so-called late marriages. To calculate the number of live births and marital fertility, a third case of potential development (C) was added: marital and extra-marital fertility remains constant at the level of 1927.
Above all in this third case, one sees that transition of the generation born in the low-birth years of 1915 to 1919 into childbearing age from 1935 to 1945 introduces a decrease in the number of births. These trends continue into the future as well.

Graph 9.8, see article – Numbers of Births and Development of Fertility (Zahl der Lebendgeborenen und Geburtenhäufigkeit) shows the development of case A in relation to the number of births and of case B in relation to marital fertility from 1927 to 2000. In case A marital fertility drops up to 1935 at the same rate as the number of live births rises, assuming constant marital fertility. Comparing the curves for the number of births and of marital fertility, we see that as early as 1927 the level of marital fertility was too low to keep the annual number of births constant. The consequence of a marital fertility level that is too low is wavelike drops in births, which are greatest under the conditions of the second case (B).
The population dynamics inherent in case B lead to a loss of population starting in 1945 (cf. Graphs 9, see article – Expected development of the total population in the German Reich (Voraussichtliche Entwicklung der Bevölkerungszahl im Deutschen Reich) and Graph 9.10 Expected changes of the age structure of the total population (Die voraussichtlichen Veränderungen des Altersaufbaus der Bevölkerung)). The birth surplus drops until it reverses into a surplus of deaths in the year 1945. The drop in population that starts in 1945 accelerates thereafter. The constant decrease in the number of births means that each age group will be smaller than the one immediately preceding it. As a consequence, a new population structure is formed with “an urn that narrows as one moves downwards” and whose base becomes ever narrower (cf. Graph 9.10, see article: The white structure means the population structure for assumption A; the black structure means the population structure for assumption B). The different shapes in the age structure of case A and B have in common the fact that both exhibit an ageing of the population in general. In case B, this process is notably more dynamic: the actual birth rate and the population dynamics independent of the age structure of the population was calculated on the basis of stationary and stable population models. The Statistical Office used the theoretical methods developed by Alfred J. Lotka (1880-1949) for the calculation of the stationary and stable population model.

Instead of the NRR (Net Reproduction Rate), which was developed by Lotka, the Statistical Office calculates the value J which is approximated to NRR. Then the value J is calculated in order to prove these assumptions: the future development of total numbers of life births and the birth rate. The results
give a different picture of the replacement of the generation of mothers with the generation of daughters, as well as the decline of total population and the ageing process of the population (cf. Graph 9.11, see article – Development of Birth and Death rates (per 1000 of the total population) (Entwicklung der Geburten- und Sterbeziffer (je 1000 der Bevölkerung))).

In case B the transition from a birth surplus to a death surplus occurs already in 1936, and the population begins to shrink. The long-term effects of imbalances in age structure and of the changes in reproductive behaviour on the part of the female population on population dynamics and size are portrayed in the theoretical population model of a stable age structure. The statistical office carried out separate calculations based on the examples of population trends regarding invalids and widows, as well as of (widows’) pensions. They show clearly what high social costs the German Reich was going to be saddled with.
Various possibilities in the realm of social and family policies were discussed in the interest of getting a grip on the declining birth and fertility rates. For example: changes in the system of compensation for families with many children, various models for increasing the tax burden of childless couples and singles while lowering the burden for families with children, and the introduction of subsidies for the rearing of children in families with two children. These allowances were intended as a financial incentive for having a third child. There have been hardly any studies of the broad discussion of suggestions that took place after 1930 for the material and non-material support of families and for securing the social situation of an ageing population. It remains for future research to close the gap of our knowledge of this discussion.

This abstract accompanies the essay: Wie wird sich die Bevölkerung des Deutschen Reiches langfristig nach dem Erstem Weltkrieg entwickeln? Die ersten amtlichen
Bevölkerungsvorausberechnungen in den 1920er Jahren
published in: Populations, Projections and Politics. Critical and Historical Essays on Early Twentieth Centruy Population Forecasting. Edited by Jochen Fleischhacker, Henk A. de Gans and Thomas Burch.
Published in 2003 by Rozenberg Publishers.

Also published in the Rozenberg Quarterly: Henk A de Gans – The Innovation of Population Forecasting Methodology in the Inter-War Period: The Case of The Netherlands.


Wie wird sich die Bevölkerung des Deutschen Reiches langfristig nach dem Erstem Weltkrieg entwickeln?

Die ersten amtlichen Bevölkerungsvorausberechnungen in den 1920er Jahren.
BerlinCharlottenburg
Problemstellung
Nach dem Ende des Ersten Weltkriegs rückten die demografischen Veränderungen in den Kriegs- und Nachkriegsjahren in das Zentrum der öffentlichen Debatten. Gegenstand statistischer Analysen bildeten die Geburtenausfälle in den Jahren 1914 bis 1919, die Übersterblichkeit der männlichen Bevölkerung und die Entstehung des Frauenüberschusses, die den Altersaufbau der Reichsbevölkerung nach dem Weltkrieg prägten. Hinzu kamen die Bevölkerungsverluste, die aus der territorialen Neugliederung des Deutschen Reichs in Folge der Umsetzung des Friedensvertrages von Versailles entstanden.1 Das Statistische Reichsamt stellte sich zur Aufgabe, die Verwerfungen in der Alters- und Geschlechtsstruktur als auch die bereits vor dem Weltkrieg eintretenden Veränderungen im Geburtenverhalten zu untersuchen und deren langfristige Auswirkungen auf die Bevölkerungsdynamik zu berechnen. Binnen vier Jahren erstellte das Statistische Reichsamt zwei demografische Vorausberechnungen über die künftige Bevölkerungsentwicklung und -struktur für das Territorium des Deutschen Reiches nach 19192 (Statistik des Deutschen Reichs, 316, 1926 und Statistik des Deutschen Reichs, 401, II, 1930). Die Grundlage für diese ersten zwei amtlichen Vorausberechnungen boten die Ergebnisse der Volkszählungen der Jahre 1910, 1919 und 1925.

Es wurden weitere statistische Erhebungen und Ergebnisse zur natürlichen Bevölkerungsbewegung im Deutschen Reichsterritorium nach dem Erstem Weltkrieg hinzugenommen (Statistik des Deutschen Reichs, 276, 1922; Statistik des Deutschen Reiches, 316, 1926; Statistik des Deutschen Reiches, Sonderhefte zu Wirtschaft + Statistik, 5, 1929, Statistik des Deutschen Reichs, 360, 1930, Statistik des Deutschen Reiches, 401, I +II, 1930).

In der ersten 1926 erschienenen Vorausberechnung wurde die Entwicklung der Bevölkerungsdynamik und -struktur für einen Zeitraum von 50 Jahren (1925 bis 1975) und in der zweiten, 1930 erschienen, für einen Zeitraum von 75 Jahren (1930 bis 2000) und darüber hinaus erstellt.3 Nahe zeitgleich hier zu erarbeitete der Bevölkerungsstatistiker Friedrich Burgdörfer (1890-1967) eine weitere demografische Vorausberechnung.4
In diesem Beitrag werden folgende Inhalte diskutiert:

1 Die wesentlichen Veränderungen im Altersaufbau der Bevölkerung des Deutschen Reichs in Folge des Ersten Weltkrieges.
2 Die erste amtliche Vorausberechnung und die Berechnungsmodelle zur Beschreibung der strukturbedingten ehelichen Fruchtbarkeitsentwicklung und deren Auswirkungen auf den Bevölkerungsbestand und seine Struktur.
3 Die zweite amtliche Vorausberechnung und die Berechnungsmodelle zur Beschreibung des individuellen Fruchtbarkeitsverhaltens und dessen Auswirkungen auf wellenartige Geburtenausfälle.
4 Das Berechnungsmodell einer Bevölkerung mit einer stabilen Altersstruktur nach Alfred J. Lotka.
5 Bevölkerungspolitische Implikationen der amtlichen Vorausberechnungenein kurzer Exkurs

Die unmittelbaren Auswirkungen des Ersten Weltkrieges auf Bestand und Struktur der Bevölkerung 

Die stetige Zunahme des Bevölkerungsbestandes kennzeichnete die demografische Entwicklung im Deutschen Reich für den Zeitraum von 1871 bis 1914. Mit dem Ersten Weltkrieg wurde diese gleichmässige Bevölkerungsentwicklung erstmals unterbrochen. Bis 1914 war nach Angaben der amtlichen Statistik die Einwohnerzahl des Deutschen Reichs auf 67,8 Millionen angewachsen. Bis zum Ende des Ersten Weltkrieges registrierte die amtliche Statistik eine Abnahme der Gesamtbevölkerung von mehr als 5,9 Millionen Menschen. Hieran schloss sich in den Nachkriegsjahren eine leichte Zunahme der Gesamtbevölkerung im Verlauf der 1920er Jahre an.

Die Auswirkungen des Ersten Weltkrieges zeigen sich bei der Gegenüberstellung des Altersaufbaus der Bevölkerung für die Jahre 1910 und 1925. Der Altersaufbau von 1925 (siehe Grafik 9.1) zeigt deutliche Veränderungen gegenüber 1910. Die amtliche Statistik beschreibt die sich wandelnde Altersund Geschlechtsstruktur mit den Worten: “Mehr Erwachsene, aber weniger Kinder.” (Statistik des Deutschen Reichs, 401, II, 1930, 556).
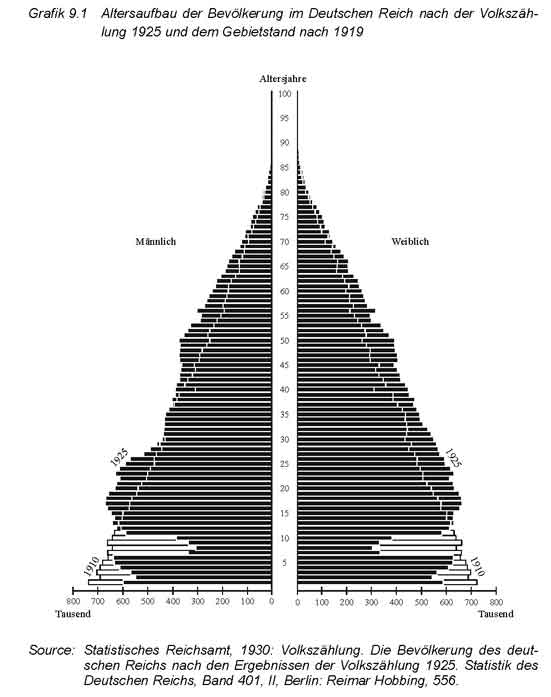
FlFig9.1


In konkreten Zahlen ausgedrückt ist 1925 im Vergleich zu 1910 der Anteil der unter 15jährigen um 17,9% zurück gegangen und der 15 bis unter 65jährigen um 20,9% sowie der über 65jährigen um 25,6% angestiegen.

Diese Verschiebungen in der Altersstruktur gegenüber von 1910 sind durch mehrere parallel verlaufende Prozesse in den Kriegsjahren verursacht worden. Die wichtigsten Komponenten sind die Geburtenausfälle und der Rückgang der Fruchtbarkeit in den Jahren 1914-1919. Sie führten zu starken Störungen in der zahlenmässigen Besetzung der unteren Altersgruppen. Der Geburtenausfall zwischen 1914-1919 wurde mit einem Geburtendefizit von ca. 3,3 Millionen beziffert. Auch in den ersten Nachkriegsjahren wurden deutlich weniger Kinder geboren als vor 1914. In Folge dieser Entwicklung nahm der Anteil der Kinder unter 15 Jahren an der Gesamtbevölkerung von Jahr zu Jahr ständig ab. 1912 betrug der Anteil der unter 15jährigen an der Gesamtbevölkerung noch 33,9% und sank durch die Fortsetzung des Geburtenrückgangs in den Nachkriegsjahren bis 1925 auf 25,8% ab (Statistisches Reichsamt, 1930, 558) (siehe Grafik 9.2). Zum anderem führte der Krieg zu Veränderungen der Sterblichkeitsverhältnisse, von denen insbesondere die über 20jährige männliche Bevölkerung betroffen war.5
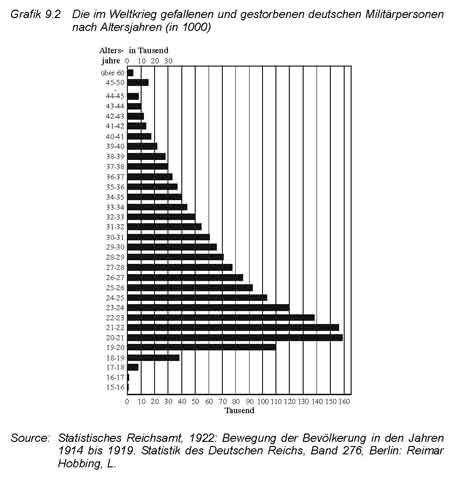
FlFig9.2


Der in den Kriegsjahren registrierte schnelle Sterblichkeitsanstieg in den Altersgruppen der 20 bis unter 35jährigen Männer leitete grundlegende Veränderungen in dem Geschlechtsverhältnis der Deutschen Bevölkerung ein. Das proportionale Verhältnis zwischen der weiblichen und männlichen Bevölkerung in den Altersgruppen der 20 bis unter 35jährigen wurde empfindlich gestört (siehe Grafik 9.3). In diesen Altersgruppen entstand ein deutlicher Frauenüberschuss, den es bei den demografischen Vorausberechnungen zu berücksichtigen galt. Das betraf insbesondere die Berechnungen zur künftigen Geburten-, Fruchtbarkeits- und Eheschliessungsentwicklung.
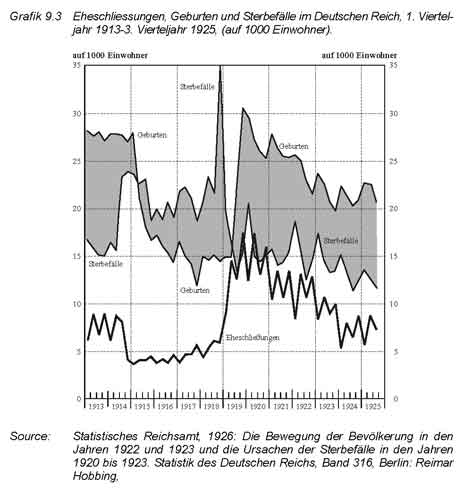
FlFig9.3

Die Statistiker registrierten in ihren Erhebungen starke Veränderungen in der Entwicklung der ehelichen Fruchtbarkeit in den Kriegsjahren. Um die Jahrhundertwende betrug die eheliche Fruchtbarkeitsziffer im Durchschnitt des Deutschen Reichs noch 279,7‰ und sank bis 1910/11 auf 224,5‰ ab. Zwischen 1913 und 1917 fiel die eheliche Fruchtbarkeitsziffer um nahezu die Hälfte ab und stieg geringfügig in den ersten Nachkriegsjahren. Allerdings hielt dieser Anstieg nur bis 1924/26 an. Die allgemeine Fruchtbarkeitsziffer stieg auf 143,5‰ an, doch erreichte sie damit keineswegs das Niveau der Vorkriegsjahre (Statistisches Reichsamt, 1929: Beiträge, 14f.). Neben dem Rückgang der ehelichen Fruchtbarkeit wurde die Bevölkerungsdynamik und -struktur vor allem durch die veränderte Sterblichkeit beeinflusst. Besonders deutlich stieg die Sterblichkeit zu Beginn und zum Ende des Krieges und führte für die Kriegsjahre zu einem Sterbefallüberschuss.

Der entstandene Frauenüberschuss wirkte sich auf den Bestand der heiratsfähigen Frauen aus. Er zeigte sich besonders markant in den Altersgruppen der 25 bis unter 32jährigen Frauen, so dass ein nicht unbeträchtlicher Teil dieser Frauen ledig blieben und damit meist nicht an der Bildung von Familien beteiligt waren.6

Des weiteren stieg das durchschnittliche Erstheiratsalters an. 1913 betrug das durchschnittliche Erstheiratsalter für die männliche Bevölkerung ca. 27,5 Jahre, es stieg bis 1919 auf 29,0 Jahre an. Für die weibliche Bevölkerung erhöhte sich das durchschnittliche Erstheiratsalter im gleichen Zeitraum von 24,7 auf 26,0 Jahre (Statistisches Reichsamt, 1922, Bewegung, XIX.). Insgesamt wurde geschätzt, dass in den Kriegsjahren ca. 870.000 Eheschliessungen ausgefallen waren.

Nach dem Ersten Weltkrieg setzte sich der Geburten- und eheliche Fruchtbarkeitsrückgang weiter fort. Dieser gab den Anlass, sich mit den Auswirkungen der gegenwärtigen Geburten- und Fruchtbarkeitsverhältnisse auf die langfristige Gestaltung des Altersaufbaus und der Bevölkerungsdynamik zu beschäftigen.

Die erste amtliche Bevölkerungsvorausberechnung von 1926
Die durchgeführten Berechnungen und Analysen sind auf die Untersuchung der natürlichen Zuwachsraten gerichtet. Gewählt wird ein makroanalytischer Ansatz, in dem die Geburten und die eheliche Fruchtbarkeit in Abhängigkeit der Verschiebungen in der Altersstruktur ermittelt werden. Im vorliegenden Berechnungsmodell wird die Frage gestellt, wie sich der Geburtenüberschuss im Berechnungszeitraum bis 1975, bedingt durch Verschiebungen in der Altersstruktur, ändern wird. Für die Vorausberechnung wird die Komponentenmethode in Anwendung gebracht.7

Für die erste demografische Vorausberechnung wurden Annahmen für die künftige Entwicklung der Sterblichkeit und der räumlichen Mobilität formuliert.
Für die Entwicklung der Sterblichkeit im Berechnungszeitraum 1925 bis 1975 wurde die altersspezifische Sterblichkeit der Jahre 1921 bis 1923 zugrunde gelegt und angenommen, dass sie sich im Berechnungszeitraum nicht verändern werde. Angenommen wurde des weiteren eine geschlossene Bevölkerung. Als ausschlaggebender Einflussfaktor für die künftige Bevölkerungsentwicklung wird die eheliche Fruchtbarkeit in Betracht genommen.8 Für die Vorausberechnungen der Geburten- und ehelichen Fruchtbarkeitsentwicklung wurden Änderungsfaktoren für die eheliche Fruchtbarkeit und für die Eheschliessungen ermittelt.9 Ausgehend von der durchschnittlichen ehelichen Fruchtbarkeit der Jahre 1924/1925 wurden Mittelwerte der altersspezifischen Fruchtbarkeit für die jeweiligen gebärfähigen fünfjährigen Altersgruppen berechnet. Damit sollte das Mass der Beteiligung der jeweiligen fünfjährigen Altersgruppe an der jährlichen ehelichen Fruchtbarkeit in Kombination mit dem Bestand der gebärfähigen Altersgruppen ermittelt werden. Der Änderungsfaktor für die Entwicklung der Eheschliessungen wurde unter der Annahme ermittelt, dass sich das Verhältnis der verheirateten Frauen in allen Altersgruppen in gleichem Masse verändert wie der Gesamtbestand der weiblichen Bevölkerung. Diese Änderungsfaktoren werden für die Vorausberechnung anhand von drei hypothetischen Entwicklungsfällen zugrunde gelegt.

Entwicklungsfall eins: Die jährliche Zahl der ehelich Lebendgeborenen ist von 1925 bis 1975 konstant und gleich der Zahl der ehelich Lebendgeborenen im Jahr 1923.
Entwicklungsfall zwei: Die eheliche Fruchtbarkeit bleibt gleich der für den Durchschnitt der Jahre 1924 und 1925 berechneten Lebendgeborenenzahl unter Berücksichtigung der Lebendgeborenenzahl von 1923.
Entwicklungsfall drei: Die eheliche Fruchtbarkeit sinkt im Durchschnitt der Jahre 1924 und 1925 mit abnehmender Geschwindigkeit um insgesamt 25% bis 1955. In den Folgejahren bleibt die eheliche Fruchtbarkeit konstant.

Voraussichtliche Entwicklung der Geburten- und ehelichen Fruchtbarkeitsziffern 1925 bis 1975
Die Ergebnisse der durchgeführten Vorausberechnung für die drei Entwicklungsfälle zeigen, wie der Kurvenverlauf der Lebendgeborenenzahl und ehelichen Fruchtbarkeit (siehe Grafik 9.4) von der Altersstruktur der weiblichen Bevölkerung im gebärfähigen Alter beeinflusst wird.
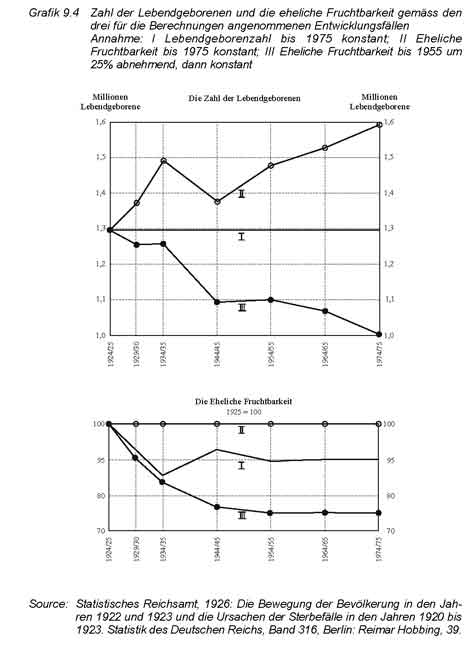
FlFig9.4

Der Kurvenverlauf für den ersten Entwicklungsfall zeigt, dass für die gleichbleibende Lebendgeborenenzahl von 1924/25 sogar eine niedrigere eheliche Fruchtbarkeit als im Jahr 1925 ausreichend ist. Im ersten Jahrzehnt sinkt die eheliche Fruchtbarkeitsziffer um 14,4% gegenüber dem Ausgangswert von 1924/25. Im zweiten Jahrzehnt steigt die eheliche Fruchtbarkeitsziffer mit dem Aufrücken der geburtenschwachen Geburtsjahrgänge in die Altersgruppen mit der “höchsten Fruchtbarkeit” bis auf 92,8% des Ausgangswerts von 1924/25 an. Dann nährt sich der Kurvenverlauf einem Wert, der unter 10% der ehelichen Fruchtbarkeit des Jahres 1924/25 liegt.

Besonders deutlich zeigt sich der Einfluss der Struktur der weiblichen Bevölkerung auf den Kurvenverlauf im zweiten Entwicklungsfall. Die Konstanz der ehelichen Fruchtbarkeit ist im ersten Jahrzehnt noch gewährleistet. Im zweiten Jahrzehnt zeigen sich Veränderungen in der Lebendgeborenezahl, die durch den Eintritt der geburtenschwachen Jahrgänge von 1915/19 verursacht werden. In diesem Jahrzehnt sinkt die jährliche Zahl der Lebendgeborenen um ca. 100.000 ab.

Im dritten Entwicklungsfall zeigt sich auffällig deutlich, wie stark die Entwicklung der ehelichen Fruchtbarkeit vom Bestand der gebärfähigen Frauen abhängt. Der Kurvenverlauf der jährlichen Geborenenzahl zeigt ab dem zweiten Jahrzehnt eine scharfe Abnahme. Diese Abnahme wird sowohl durch den ehelichen Fruchtbarkeitsrückgang als auch durch das Aufrücken der zahlenmässig schwächer besetzten Geburtsjahrgänge 1915/19 in die Altersgruppen mit der “höchsten Fruchtbarkeit” verursacht. Die Abwärtsbewegung der Geborenenzahl hält auch nach 1955, trotz der angenommenen Konstanz der ehelichen Fruchtbarkeit in den nachfolgenden Jahren weiter an, “weil die Zahl der im gebährfähigen Alter stehenden Frauen ständig zurückgeht.” (Statistik des Deutschen Reichs, 1926, Richtlinien, 39).

Voraussichtliche Entwicklung der Gesamtbevölkerung und der Bevölkerungsstruktur 1925 bis 1975
Wie sich im Berechnungszeitraum die Gesamtbevölkerung und die Bevölkerungsstruktur entwickeln wird, zeigen die nachfolgenden Kurvenverläufe (siehe Grafik 9.5).
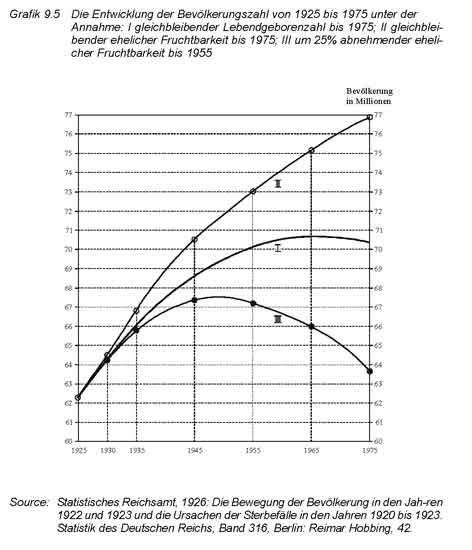
FlFig.9.5

Im ersten Entwicklungsfall, der konstante Geburtenzahl für den gesamten Berechnungszeitraum unterstellt, wächst die Bevölkerung bis 1965 auf ca. 70,7 Millionen an, dargestellt im Verlauf der Kurve I. Im weiteren Verlauf verringert sich das Wachstum der Gesamtbevölkerung und entwickelt sich langfristig zu zu einer stationären Bevölkerung.10 In den anschliessenden Jahren nähert sich diese “Gesamtbevölkerung mit ständig geringer werdender Geschwindigkeit einer konstanten Zahl von 69,3 Millionen” an (Statistik des Deutschen Reichs, 1926, Richtlinien, 42). Unter diesen Umständen wird sich die Altersstruktur langfristig verändern. Während die Zahl der unter 15jährigen im Untersuchungszeitraum nahezu unverändert bleibt, wächst die Zahl der 15 bis unter 65jährigen zwischen 1925 und 1975 um ca. 7% an. Noch bedeutsamer werden die Veränderungen bei den über 65jährigen sein, deren zahlenmässiger Bestand innerhalb der 50 Jahre um mehr als 200% wachsen wird. (Statistik des Deutschen Reichs, 1926, Richtlinien, 45).

Im zweiten Entwicklungsfall, konstante eheliche Fruchtbarkeit in allen Altersgruppen für den gesamten Berechnungszeitraum, steigt die Bevölkerungszahl ständig an. Die Bevölkerung nimmt im Verlauf von 50 Jahren um 14,6 Millionen zu. Sie wird bis zum Jahr 1975 auf 76,9 Millionen anwachsen. Auch nach 1975 wird die Bevölkerung, weiter anwachsen “wenn auch mit allmählich verzögerter Geschwindigkeit.” (Statistik des Deutschen Reichs, 1926, Richtlinien, 42). Hinsichtlich des Altersaufbaus treten die Veränderungen sowohl bei der zahlenmässigen Besetzung der unter 15jährigen als auch der 15 bis unter 65jährigen Altersgruppen zwischen 1925 und 1975 auf. Gegenüber dem ersten Entwicklungsfall nimmt der zahlenmässige Bestand der 15 bis unter 65jährigen im gleichen Zeitraum um ca. 9,2% zu. Ebenso fällt der zahlenmässige Zuwachs der über 65jährigen besonders stark aus. Deren Zahl wird sich im Untersuchungszeitraum verdoppeln (Statistik des Deutschen Reichs, 1926, Richtlinien, 45).

Im Unterschied hierzu zeigt der dritte Entwicklungsfall, der sukzessive eheliche Fruchtbarkeitsrückgang um 25% im Laufe von 25 Jahren, ein sehr viel differenziertes Bild über die Entwicklung der Gesamtbevölkerung. Bis 1955 wird demnach die Bevölkerung um knapp 3,8 Millionen anwachsen und in den folgenden Jahrzehnten beständig wieder abnehmen. Erwartet wird, dass sich diese Entwicklung auch über das Jahr 1975 weiter fortsetzt und damit die demografischen Prozesse langfristig prägen wird. Diese Tatsache wird durch die ungleichmässige Verteilung der Altersgruppen im Altersaufbau belegt. Durch den nach dem Erstem Weltkrieg sich fortsetzenden Geburtenund ehelichen Fruchtbarkeitsrückgang wird die zahlenmässige Besetzung der unter 15jährigen sich deutlich verringern. Im dritten Entwicklungsfall wird der zahlenmässige Bestand der über 65jährigen noch rascher zunehmen (Statistik des Deutschen Reichs, 1926, Richtlinien, 45).

Beim Vergleich der Entwicklungsvarianten fällt auf, dass die Bevölkerung nach allen drei Entwicklungsfällen von 1925 bis 1945 wachsen wird.11 Dieses Bevölkerungswachstum erklärt sich zu nicht geringen Teilen aus der Sterblichkeitsentwicklung, die in den Jahren 1924/26 besonders günstig war. Sie ist geprägt durch besonders niedrige altersspezifische Sterblichkeitsziffern bei Männern und Frauen.12 Sie führen zu einem leichten Anstieg der Lebenserwartung und der Zunahme der Gesamtbevölkerung. Die Rechnungen für den zweiten und dritten Entwicklungsfall belegen die schwache Besetzung der Geburtenjahrgänge nach 1935. Gleichzeitig rücken in den Folgejahren die geburtenstarken Vorkriegsjahrgänge in die höheren Altersgruppen auf.
Diese Erscheinung kennzeichnet ab 1965 die Entwicklung einer schwächeren Geburtendynamik und eine anwachsende Sterblichkeit. Vor allem die Berechnungen des dritten Entwicklungsfalls weisen auf die neuen demografischen Herausforderungen für die sozialen Sicherungssysteme hin: Einerseits der Geburtenrückgang und andererseits die Alterung der Bevölkerung.13
Langfristig zeigt sich eine “allmähliche Überalterung der Bevölkerung” und die hieraus erwachsenden “allgemeinen Versorgungslasten durch die Veränderungen des Zahlenverhältnisses der Nichterwerbstätigen (Kinder, Ehefrauen, Greise) zu den Erwerbstätigen.” (Statistisches Reichsamt, 1926: Richtlinien, 47).

Voraussichtliche Tendenzen in der Entwicklung des Geburtenund Sterbefallüberschusses

Um die Ergebnisse der Bevölkerungsdynamik in Verbindung mit der Altersstruktur zu überprüfen, werden noch einmal die Geburten- und Sterbeziffern siehe Grafik 9.6) auf Grundlage der drei Entwicklungsfälle berechnet. Hieran ist die Frage geknüpft, wie sich langfristig die Geburten- und (oder) Sterbefallüberschüsse im Prozess der Bevölkerungsalterung entwickeln und die Bevölkerungsdynamik beeinflüssen werden.

Beim ersten Entwicklungsfall sinkt die Geburtenziffer von 1925 bis 1965 und gleichzeitig steigt die Sterbeziffer, ausgelöst durch die Verschiebungen im Altersaufbau der Bevölkerung, an. Nach 1965 wandelt sich der Geburten- in einen Sterbefallüberschuss und in der Konsequenz gestaltet sich das Bevölkerungswachstum, trotz der jährlich gleichbleibenden Geburtenzahl, negativ.

Im zweiten Entwicklungsfall nimmt zunächst im ersten Jahrzehnt die Geburtenziffer zu und fällt bis 1945 stark ab. Von 1945 bis 1975 steigt die Geburtenziffer mit leichten Schwankungen um ca. 6% und die Sterbeziffer um ca. 32,6% zwischen 1925 und 1975 an. Ungeachtet dieser unterschiedlichen Bewegung der Geburten- und Sterbeziffer wird die gesamte Untersuchungsperiode durch einen Geburtenüberschuss bestimmt. Obwohl letzterer zeitweilig zunimmt und nach 1945 sich wieder verringert, wächst nach diesem Entwicklungsfall die Bevölkerung ständig im gesamten Untersuchungszeitraum, allerdings mit nachlassender Intensität.

Beim dritten Entwicklungsfall kommt es bereits in den ersten zwei Jahrzehnten zwischen 1925 und 1945 zu “einem Absturz der Geburtenziffer”. (Statistisches Reichsamt, 1926, Richtlinien, 50). Auf diesem Niveau verbleibt die Geburtenziffer weitere 20 Jahre, um dann erneut, aber mit nachlassender Intensität, zu sinken. Der starke Abfall der Geburtenziffern bewirkt bereits 1945 ein Zusammentreffen mit den ansteigenden Sterbeziffern, ausgelöst durch die Verschiebungen der Altersstruktur und die Überalterung der Bevölkerung. In allen drei Entwicklungsfällen zeigt der Kurvenverlauf der allgemeinen Sterblichkeit einen recht geradlinigen Anstieg infolge der zunehmenden Besetzung der höheren Altersgruppen.
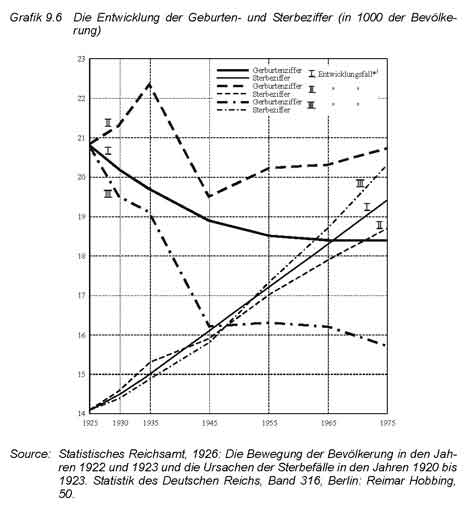
FlFig9.6

Die zweite amtliche Vorausberechnung von 1930
In der zweiten Vorausberechnung rücken die Veränderungen der ehelichen Fruchtbarkeit in den Nachkriegsjahren in den Vordergrund der Analysen und Berechnungen. Die Veränderungen zeigen sich in der rückläufigen Geburten- und Fruchtbarkeitsentwicklung, die nach Ansicht der amtlichen Statistik auf “den bewussten Willen zur Einschränkung der Kinderaufzucht” zurückzuführen ist (Statistik des Deutschen Reichs, Bd. 401, II, Ausblick, 442). Dieser Umstand wird mit der Frage verknüpft, wie sich künftig das eheliche Fruchtbarkeitsverhalten entwickeln und welche Ausmasse es auf die Bevölkerungsdynamik haben wird. Zur Beurteilung der künftigen Bevölkerungsentwicklung wird ein Berechnungsmodell zur Begründung der ehelichen Fruchtbarkeit und der Reproduktionsintensität des weiblichen Bevölkerungsteils gewählt.
Untersucht werden einerseits die strukturellen Veränderungen der weiblichen Bevölkerung im fertilen Alter und andererseits deren verändertes Fortpflanzungsverhalten. Berücksichtigt werden hierbei die Veränderungen der Eheschliessungsquoten. Die amtliche Statistik wirft in diesem Zusammenhang die Frage auf, ob unter den Bedingungen der Bestandsveränderungen der fertilen weiblichen Bevölkerung und deren verändertem Fruchtbarkeitsverhalten wellenartige Geburtenausfälle entstehen werden.

Analysiert und berechnet werden die Verschiebungen in der Altersstruktur der Gesamtbevölkerung und hierbei vor allem die Verschiebungen im Ehebestand und im Bestand der fortpflanzungsfähigen weiblichen Bevölkerung. Für diese Vorausberechnung des Bevölkerungsbestandes wird wiederum die
Komponentenmethode angewandt.

Für die Berechnung der Absterbeordnung wurde eine neue Sterbetafel für die Jahre 1924/26 ausgearbeitet und die altersspezifíschen Sterblichkeitsziffern als konstant angenommem. Von vornherein werden die Aus- und Einwanderungsbewegungen aus den Berechnungen ausgeschaltet. Als massgebliche Einflusskomponente, die den Verlauf der künftigen Bevölkerungsentwicklung bestimmt, wird das veränderte individuelle eheliche Fruchtbarkeitsverhalten in Betracht gezogen.
Für die Vorausberechnungen der Geburten- und ehelichen Fruchtbarkeitsentwicklung werden zwei hypothetische Entwicklungsfälle formuliert.

Entwicklungsfall A: Die jährliche Geborenenzahl der Lebendgeborenen bleibt ständig gleich der Lebendgeborenenzahl des Jahres 1927.
Entwicklungsfall B: Die eheliche und uneheliche Fruchtbarkeit nimmt gegenüber dem Stand von 1927 um insgesamt 25% bis zum 1955 ab.

Der Entwicklungsfall A entspricht theoretisch der Ausbildung einer stationären Bevölkerung während der Entwicklungsfall B die nachlassende ehelichen Geburtenhäufigkeit in den Jahren 1922 bis 1927 berücksichtigt, die an Hand von mehreren Berechnungsmethoden ermittelt wird.

Ermittelt wird eine Trendlinie der ehelichen Fruchtbarkeit für die Gesamtheit der fertilen weiblichen Bevölkerung im Zeitraum 1922 bis 1927. Um Struktureffekte wie die unterschiedliche Besetzung in den fertilen weiblichen Altersgruppen oder Schwankungen in der wirtschaftlichen Konjunkturentwicklung auszuschliessen, werden standardisierte Fruchtbarkeitsziffern gebildet (Statistisches Reichsamt, 1930, Bewegung, 26ff.). Hieran schliessen sich Berechnungen der ehelichen Fruchtbarkeitsziffern für das Jahr 1927 an. Die Berechnungsergebnisse werden an die Werte der Trendlinien angepasst und eine Messziffer für die Jahre 1927-1955 gebildet. Für die weiteren Jahre wird diese Berechnung in einem Intervall von 15 Jahren fortgesetzt. Die Berechnungen der amtlichen Statistik bestätigten die Annahme, dass das nachlassende individuelle Fruchtbarkeitsverhalten der fertilen weiblichen Bevölkerung
die wesentliche Ursache für die abnehmende Geburtenintensität bildet.14 Die Erhebungen der amtlichen Statistik zeigen, dass erste Veränderungen in der Geburtenentwicklung bereits in den Vorkriegsjahren eingetreten sind.

Diese bildeten eine wesentliche Quelle für die Diskussionen in den Nachkriegsjahren um die Ursachen, den Verlauf und die Konsequenzen der abnehmenden ehelichen Fruchtbarkeit für die Bevölkerungsentwicklung und -struktur.
Thematisiert wurden die ökonomischen und sozialen Veränderungen, die dem Rückgang der ehelichen Fruchtbarkeit voraus gingen, von Vertretern der Nationalökonomie, Statistik und Sozialhygiene. Zu ihnen zählen u.a. Ludwig Josef Brentano (1844-1931), Julius Wolf (1862-1937), Alfred Grotjahn (1869-1931), Paul Mombert (1876-1938) u.v.a.m.

Als weiterer Faktor, der den Verlauf der ehelichen Fruchtbarkeit beinflusst, wurde die Verheiratetenquote der Frauen im gebärfähigem Alter ermittelt.15

Um die Differenz zwischen den erwartungsmässigen und den tatsächlichen Eheschliessungen jedes Alters in den Jahren 1924 bis 1927 berechnen zu können, wurden zunächst standardisierte Altersheiratsziffern für die männliche Bevölkerung, bezogen auf die Heiratshäufigkeit der Jahre 1910/11, berechnet. Die Ermittlung der Heiratsziffer für ledige Männer war notwendig, um die Eheschliessungsmöglichkeiten der Frauen, deren zahlenmässiger Bestand einen Überschuss aufweist, zum Ausdruck zu bringen.16 Von 1928 bis 1940 zeigen die Berechnungen eine Zunahme der Verheiratetenquoten der unter 45jährigen Frauen und der unter 48jährigen Männer. Infolge
der Verringerung der Sterblichkeit vor allem auf seiten der männlichen Bevölkerung rechnet die amtliche Statistik nach 1940 mit einem Männerüberschuss in den Altersgruppen mit der höchsten Heiratshäufigkeit. Um den Einfluss der Heiratshäufigkeit auf die eheliche Fruchtbarkeit und das Fruchtbarkeitsverhalten
berechnen zu können, wurde die Gesamtheit der verheirateten Frauen nach der Ehedauer zusammengestellt und in Beziehung mit der Ordnungszahl der Erst-, Zweit-, Dritt-, Viert- und weiterer Geburten gebracht. 17

Hierzu wurden standardisierte Fruchtbarkeitsziffern für die fünfjährigen Altersgruppen der gebärfähigen Frauen, gegliedert nach der Parität der Geburten für die Jahre 1922 bis 1927, berechnet. Die Berechnungen zeigten vor allem einen Rückgang der Erst- und Zweitgeburten. Hieraus leitete die amtliche Statistik ihre Annahme ab, dass der Geburten- und Fruchtbarkeitsrückgang vor allem auf das Verhalten der Familien, die Zahl der Kinder möglichst klein zu halten, zurückzuführen sei.

Zukünftige Veränderungen im Altersaufbau unter Berücksichtigung der Sterblichkeitsverhältnisse von 1924/26

Auf Basis der Sterbetafel von 1924/26 wurden altersspezifische Sterblichkeitsziffern berechnet und mit dem nach der Volkszählung von 1925 ermittelten Altersaufbau in Beziehung gesetzt. Wie sich der Altersaufbau im Zeitverlauf verändern wird, demonstriert die nachfolgende Grafik (siehe Grafik 9.7).
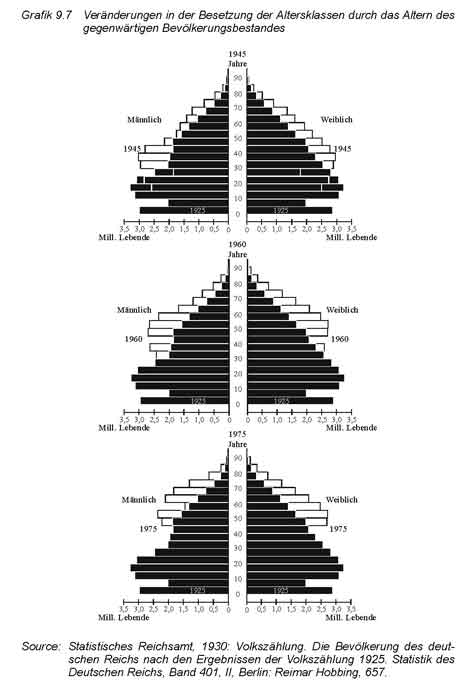
FlFig9.7

Festgestellt wird eine verhältnismässig starke Besetzung der über 20jährigen im Jahre 1930. Sie sind auf die starken Geburtenjahrgänge von 1905 bis 1909 zurückzuführen. Diese verhältnismässig starke Besetzung wird sich unter Berücksichtigung gleichbleibender Sterblichkeitsverhältnisse in die höheren Altersgruppen verschieben. Mit dem Aufrücken dieser Geburtenjahrgänge in die alten und älteren Altersgruppen wächst deren Bestand zusehends an: “Bei den über 80jährigen schliesslich erstreckt sich die Zunahme voraussichtlich sogar bis 1990. Um diese Zeit werden rechnungsmässig etwa 4 bis 5mal so viel Personen dieses Alters vorhanden sein, wie bei der Volkszählung im Jahre 1925”. (Statistisches Reichsamt, Ausblick, 1930, 642).

Ein diametral entgegengesetztes Bild zeigt sich bei den geburtenschwachen Jahrgängen der Jahre 1914 bis 1919 und deren Vorrücken in die mittleren Altersgruppen. Sie führen zu einer deutlich geringen Besetzung der 25 bis unter 30jährigen im Jahr 1945 bzw. der 45 bis unter 50jährigen im Jahr 1960.

Diese Einschnitte in der Altersstruktur durch die schwach besetzten Geburtenjahrgänge zwischen 1915 und 1919 werden zwar z. T. durch die stärker besetzten Geburtenjahrgänge der ersten Nachkriegsjahre wieder ausgeglichen, ohne jedoch das Niveau der Vorkriegsjahre noch einmal zu erreichen.
Im Gegenteil führen sie wiederum zu neuerlichen Veränderungen in der Besetzung der unteren Altersgruppen der 15 bis unter 20jährigen im Jahr 1945, der 30 bis unter 35jährigen im Jahr 1960 bzw. 45 bis unter 50jährigen im Jahr 1975. Geschlussfolgert wird, dass die im Ergebnis des Ersten Weltkrieges entstandenen Verschiebungen in der Alters- und Geschlechtsstruktur sich zukünftig wellenförmig fortsetzen und damit auch die künftige Entwicklung der Eheschliessungen und der ehelichen Fortpflanzung beeinflussen werden.

Die Verschiebungen in der Alters- und Geschlechtsstruktur zeigen sich beispielsweise bei der Entwicklung des Ehebestandes. So führt der Frauenüberschuss in den 25 bis unter 50jährigen Altersgruppen zu einer Zunahme der Eheschliessungen in den mittleren Altersgruppen. Es wird in diesem Zusammenhang auf die Zunahme des Anteils der “Spätehen” verwiesen, deren durchschnittliche Kinderzahl durch die verhältnismässig späte Eheschliessung “naturgemäss” kleiner ausfallen wird.

Mit dem Aufrücken der schwach besetzten Geburtenjahrgänge der Kriegsjahre in die Jahrgänge mit der höchsten Heiratshäufigkeit und dem Herausbilden eines Männerüberschusses bei den 20 bis unter 30jährigen Männern wird die Zahl der Frühehen wieder zunehmen. Dieser zeitweilige Anstieg des Ehebestandes, vor allem der “jungen Ehen”, wird um das Jahr 1940 abgeschlossen sein. Mit dem Aufrücken der geburtenschwachen Nachkriegsjahrgänge in die Altersgruppen mit der höchsten Heiratshäufigkeit werden nach 1940 vor allem die weiblichen Altersgruppen im fertilen Alter nicht mehr voll besetzt sein. Diese rückläufige Besetzung kann nach Ansicht der amtlichen Statistik auch nicht durch eine höhere Geburtenhäufigkeit ausgeglichen werden.

Voraussichtliche Entwicklung der Geburtenziffern und der ehelichen sowie unehelichen Fruchtbarkeit 1930 bis 2000
Die Berechnungen zur Entwicklung der Geborenenzahl und der ehelichen Fruchtbarkeit sind anhand von drei Entwicklungsfällen durchgeführt worden. Neben dem Entwicklungsfall A (die jährliche Geborenenzahl der Lebendgeborenen bleibt ständig gleich der Lebendgeborenenzahl des Jahres 1927) und dem Entwicklungsfall B (die eheliche und uneheliche Fruchtbarkeit nimmt gegenüber dem Stand von 1927 um insgesamt 25% bis zum 1955 ab und bleibt danach unverändert), wird auch der Entwicklungsfall C (gleichbleibende Fruchtbarkeit wie 1924/25) in die Berechnungen aufgenommen (siehe Grafik 9.8).
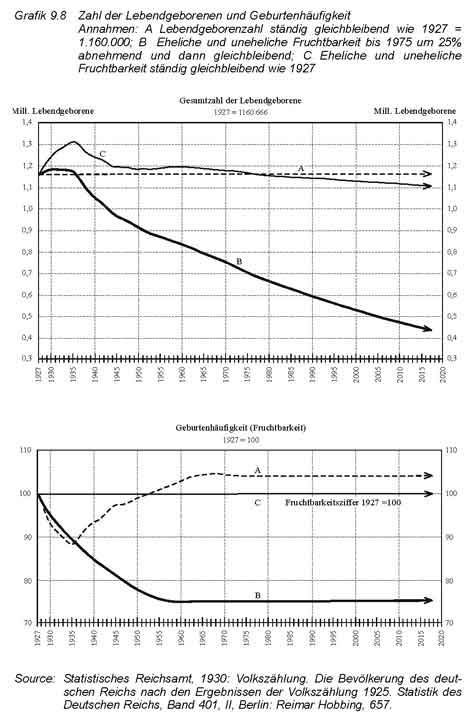
FlFig9.8

Während die Zahl der Lebendgeborenen nach dem Entwicklungsfall A für den Zeitraum zwischen 1927 und 2000 sich nicht verändert, zeigen sich bei der Bewegung der Lebendgeborenen nach dem Entwicklungsfall C erste Abweichungen. Der zeitweilige Anstieg der Lebendgeborenenzahl nach 1927 ist z. T. auf das Nachholen von ausgefallenen Geburten in den Kriegs- und ersten Nachkriegsjahren zurückzuführen. Die geburtenschwachen Jahrgänge 1915 bis 1919 leiten ca. 20 Jahre später den Rückgang der Geborenen zahl zwischen 1935 bis 1945 ein. Diese Tendenzen setzen sich auch im Zeit verlauf weiter fort.18

Auffallend ist die Bewegung der Zahl der Lebendgeborenen nach dem Entwicklungsfall B, die zwischen 1927 und 1931 leicht ansteigt. Dieser Anstieg ist wiederum z. T. auf das Nachholen von ausgefallen Eheschliessungen und Geburten in den Kriegs- und Nachkriegsjahren zurückzuführen. Der Eintritt der geburtenschwachen Jahrgänge 1915 bis 1919 in die Altersgruppe der 20 bis 25jährigen führt unweigerlich zu einer Abnahme der Geborenzahl, der sich durch den Rückgang der ehelichen Fruchtbarkeit weiter verstärkt. Diese Tendenz der abnehmenden Geburtenzahl wird sich auch nach 1955 weiter fortsetzen.19

Ein anders Bild ergeben die Kurvenverläufe des Entwicklungsfalls A zur Bewegung der Geborenenzahl und des Entwicklungsfalls B zur Bewegung der ehelichen Fruchtbarkeit zwischen 1927 und 2000. Nach dem Entwicklungsfall A sinkt bis 1935 die eheliche Fruchtbarkeit im gleichen Masse wie die Lebendgeborenenzahl bei konstanter ehelicher Fruchtbarkeit ansteigt.
Die Symmetrie zwischen den beiden Kurven wird aufgehoben, “wenn die nach 1927 geborenen Jahrgänge, die bei konstanter Geburtenzahl schwächer besetzt sind als bei konstanter ehelicher Fruchtbarkeit, in das fertile Alter eintreten”. (Statistisches Reichsamt, 1930, Ausblick, 662). Etwa um das Jahr 1955 hat dann die eheliche Fruchtbarkeit wieder das Ausgangsniveau von 1927 erreicht. Ab 1965 wird bis zum Jahr 2000 das Ausgangsniveau der ehelichen Fruchtbarkeit von 1927 um ca. 4% überschritten. Diese Ergebnisse setzen allerdings den Anstieg der ehelichen Fruchtbarkeit über das Niveau des Jahres 1927 voraus.

Notwendigerweise führt der Entwicklungsfall B, durch den in Rechnung gestellten Rückgang der ehelichen Fruchtbarkeit um 25% bis 1955, zu einem Rückgang der Geburtenhäufigkeit und zum anderem zu strukturellen Veränderungen durch den Eintritt der geburtenschwachen Kriegsjahrgänge in die Altersgruppe der 20 bis unter 30jährigen. Auch in den nachfolgenden Jahrzehnten setzt sich diese Entwicklung weiter fort, weil “die nunmehr in das gebärfähige Alter eintretenden Jahrgänge …. zahlenmässig immer schwächer werden” (Statistisches Reichsamt, 1930, Ausblick, 662).

Die Gegenüberstellung der Kurvenverläufe für die Zahl der Geborenen und der ehelichen Fruchtbarkeit zeigen, dass bereits 1927 das Niveau der ehelichen Fruchtbarkeit zu niedrig war, um die jährliche Zahl von 1.160.000 Geburten dauerhaft aufrecht zu erhalten. In der Konsequenz führt das zu niedrigere Niveau der ehelichen Fruchtbarkeit zu wellenartigen Geburtenausfällen.

Voraussichtliche Entwicklung der Gesamtbevölkerung und des Geburten- bzw. Sterbefallüberschusses 1927 bis 2000
Für die Berechnungen der voraussichtliche Entwicklung der Gesamtbevölkerung und des Geburten- bzw. Sterbefallüberschusses 1927 bis 2000 werden wiederum die drei Entwicklungsfälle, die auch bei den Berechnungen der Geburtenziffern und der ehelichen sowie unehelichen Fruchtbarkeit angewandt werden, zugrunde gelegt (siehe Grafik 9.9).20

FlFig9.9

Bereits der Entwicklungsfall A zeigt einschneidende Veränderungen des Geburtenüberschusses in der Gesamtbevölkerung bis zum Jahr 2000 und darüber hinaus. Die allmähliche Verringerung des Geburtenüberschusses beginnt bereits 1927 und setzt sich bis zum Beginn der 1960er Jahre fort. Verursacht wird diese Entwicklung durch die Veränderungen der Bevölkerungsstruktur, vor allem durch das Aufrücken der geburtenstarken Vorkriegsjahrgänge in die höheren Altersgruppen. Nach 1961/62 wird der Geburtendurch einen Sterbefallüberschuss abgelöst. Diese Tendenzen widerspiegeln sich in der Entwicklung der Gesamtbevölkerung. Zwischen 1927 und 1960 wird nach dem Entwicklungsfall A die Gesamtbevölkerung noch leicht um ca. 10% wachsen. Für die nachfolgenden Jahrzehnte zeichnet sich allerdings bereits ein Bevölkerungsrückgang mit nachlassender Intensität ab, der sich auch nach dem Übergang in das 21. Jahrhundert weiter fortsetzen wird.

Auch im Entwicklungsfall B wird sich von Beginn der Untersuchungsperiode an der Geburtenüberschuss verringern. Der Wechsel vom Geburten- zum Sterbeüberschuss wird sich allerdings im Vergleich zum Entwicklungsfall A sehr viel früher, um das Jahr 1945, vollziehen. Der schnelle Wechsel vom Geburten- zum Sterbefallüberschuss findet seine Entsprechung in der Entwicklung der Alters- und Geschlechtsstruktur. Der zeitweilige Anstieg der Gesamtbevölkerung fällt mit der verhältnismässig starken Besetzung der Geburtsjahrgänge 1909/11 der weiblichen Bevölkerung und deren Eintritt in die fortpflanzungsstärksten Altersgruppen zusammen. Allerdings bestimmen sie die Entwicklung der Gesamtbevölkerung nur bis 1935. In den nachfolgenden Jahren wird es durch die abnehmende Besetzung der weiblichen Bevölkerung und des ehelichen Fruchtbarkeitsrückgangs zu einem permanenten Bevölkerungsrückgang kommen. Nach 1945 wird sich dieser Bevölkerungsrückgang weiter beschleunigen und selbst unter Berücksichtigung des Entwicklungsfalls B, eine gleichbleibende bzw. “unveränderte Geburtenhäufigkeit” nach 1955, kann diese Tendenz sich bis “ins Endlose fortsetzen.” (Statistisches Reichsamt, 1930, Ausblick, 664).

Auf lange Sicht werden diese aufgezeigten Entwicklungstendenzen zu bedeutsamen Veränderungen der Alters- und Geschlechtsgliederung führen, wie die Darstellungen der Veränderungen im Altersaufbau der Bevölkerung des Deutschen Reichs von 1930 bis 2055 belegen (siehe Grafik 9.10).

Nach dem Entwicklungsfall A werden die unteren Altersgruppen nicht mehr voll besetzt sein, weil die eheliche Fruchtbarkeit zur Aufrechterhaltung der jährlichen Zahl der Lebendgeborenen bereits zu niedrig ist. Die durch den Ersten Weltkrieg hervorgerufenen Störungen in der Altersstruktur rücken im Zeitverlauf in die höheren Altersgruppen. Im Ergebnis entsteht ein neuer Altersaufbau, der durch eine verhältnismässig gleiche Besetzung in allen Altersgruppen charakterisiert ist. Dieser Prozess, die Entstehung einer stationären Bevölkerung, wird nach den Berechnungen der amtlichen Statistik um das Jahr 2000 abgeschlossen sein.

Nach dem Entwicklungsfall B wird sich im Untersuchungszeitraum die zahlenmässige Besetzung der unteren Altersgruppen permanent verringern. Durch die ununterbrochene Abnahme der Geburtenzahl ist jede Altersgruppe schwächer besetzt als die nächst höhere Altersgruppe. In Folge bildet sich ein neuer Altersaufbau, mit “einer nach unten hin sich verjüngenden Urne”, deren Basis immer schmaler wird, heraus (Statistisches Reichsamt, 1930, Ausblick, 665).

Gemeinsam ist den verschiedenen Formen des Altersaufbaus nach den Entwicklungsfällen A und B eine Alterung der Gesamtbevölkerung. Sie führt in der Konsequenz zu einer stärkeren Besetzung in den höheren und hohen Altersgruppen. Vor allem die Berechnungen auf der Grundlage des Entwicklungsfalls B belegen eine besonders schnelle Zunahme in den Altersgruppen der über 60jährigen, die sich im Vergleich zum Entwicklungsfall A wesentlich dynamischer gestaltet: “Der Anteil der 70 bis 80jährigen an der Gesamtbevölkerung steigt auf das 31/4fache an, während die Gruppe der Kinder und Jugendlichen bis Ende des Jahrhunderts auf 2/3 ihres jetzigen Bevölkerungsanteil zusammenschrumpft.” (Statistisches Reichsamt, 1930, Ausblick, 645).
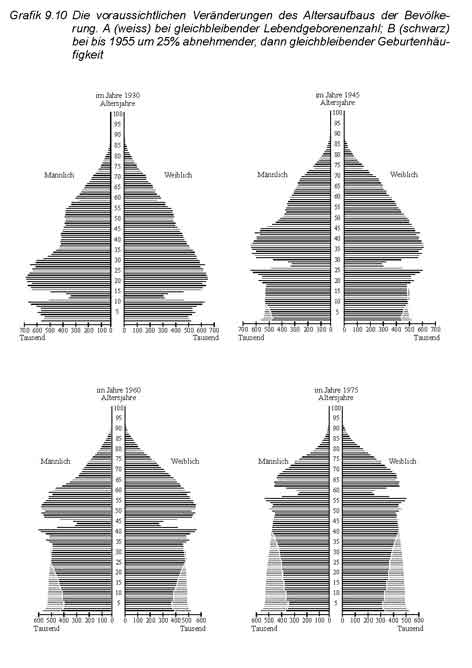
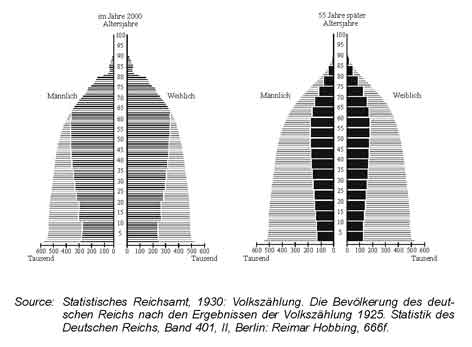
FlFig.9.10-1


FlFig9.10-2


Die Bevölkerungsmodelle mit stabilen Altersstrukturen

Die zwei unterschiedlichen Formen des Altersaufbaus, die sich unter Berücksichtigung der zwei Entwicklungsfälle bis zum Jahr 2055 herausbilden werden, weisen auf ein wichtiges demografisches Phänomen, die Überalterung der Bevölkerung, hin. Ein Indikator, der die Bevölkerungsalterung widerspiegelt ist das mittlere Alter einer Bevölkerung. Die Veränderungen des mittleren Alters der Bevölkerung berechnet die amtliche Statistik auf Grundlage des Entwicklungsfalls A (gleichbleibende Lebendgeborenenzahl wie 1927) und Entwicklungsfalls B (bis 1955 um 25% abnehmende und danach gleichbleibende Geburtenhäufigkeit). Im Entwicklungsfall A steigt das mittlerer Alter der Bevölkerung bis zum Jahr 2000 um 5 Jahre und im Entwicklungsfall B um 14 Jahre an. Die Verschiebungen im Altersaufbau und die Zunahme des mittleren Alters der Bevölkerung deuten bereits langfristige Veränderungen in der Entwicklung der Bevölkerungsdynamik an.

Um diese langfristigen Veränderungen der Bevölkerungsdynamik zu quantifizieren, werden für die weiteren Berechnungen die Modelle der stationären und stabilen Bevölkerung zugrunde gelegt. Gefragt wird erstens, wie hoch der tatsächliche Geburtenüberschuss unabhängig von dem Altersaufbau der Bevölkerung noch ist. Gefragt wird zweitens, wie sich die Bevölkerungsdynamik nach dem Entwicklungsfall B langfristig gestalten wird.21

Zu diesem Zweck werden weitere Berechnungen anhand des stationären und stabilen Bevölkerungsmodells, die in ihren Grundzügen vom österreichischen Populationstheoretiker Alfred J. Lotka (1880-1949) in den 1920er Jahren entwickelt worden war, durchgeführt.22 Bei der Vorgehensweise beruft sich die amtliche Statistik auf die Methodik von Lotka zur Berechnung der NRR und berechnet den Annäherungswert J. Für alle drei Enwicklungsvarianten wurden zunächst die Werte der allgemeinen Fruchtbarkeitsziffern für fünfjährigen Altersgruppen sowie für Mädchengeburten aus der Trendlinie
des Jahres 1927 berechnet. Als weitere Komponente wurde die Verheiratetequote je Frau jeden Alters vom Jahre 1975 als gleichbleidend für alle drei Entwicklungsfälle in die Berechnungen integriert. Unter der Maßgabe der gleichbleibenden alterspezifischen Sterblichkeit und der berechneten allgemeinen
Fruchtbarkeitsziffern für Mädchengeburten wurde mit Hilfe von Integralableitungen die Ziffer für den Wert J berechnet, der die Überlebenswahrscheinlichkeit des weiblichen Geschlechts einer Frauenkohorte nach der Sterbetafel 1924/26 zum Ausdruck bringt. Der Wert J wird hier als Ersatzwert für die NRR genommen und lässt sich als die Zahl von 100 000 Mädchengeburten, die das fertile Alter einer Frauenkohorte erreichen und durchleben in Kombination mit der Fruchtbarkeit der fünfjährigen Altersgruppen, interpretieren.23

Unter den Bedingungen der stabilen Bevölkerung bei gleichbleibender Geburtenhäufigkeit wie 1927 ergab der Wert J, dass die Überlebenden von 100 00 lebenden Mädchengeburten bei den zu Grundlage genommenen allgemeinen Fruchtbarkeitsziffern 3,78% weniger Mädchen gebären werden als zur Erhalt des Bevölkerungsbestandes notwendig ist. Die durchschnittliche jährliche Zahl der Lebendgeborenen nimmt auf Grund der weiteren Veränderungen im Bestand der Frauen in den fertilen Altersgruppen von Jahrfünft zu Jahrfünft ab. Nach Überwindung der ungleichmässigen Besetzung der Altersgruppen durch den gegenwärtigen Altersaufbau wird die stabile Bevölkerung bei gleichbleibenden Geburtenhäufigkeit wie 1927 und konstanter altersspezifischer Sterblichkeit ein jährliches Geburtendefizit von -1,34‰ der mittleren Bevölkerung aufweisen.

Nach den Berechnung der ständig gleichbleibender Lebendgeborenenzahl wie 1927 ( Entwicklungsfall A ) entsteht eine sationäre Bevölkerung. Zur Bildung der stationären Bevölkerung kommt es, nach dem die skizzierten Unregelmässigkeiten im Altersaufbau langfristig überwunden werden. Der Wert J ist dann gleich 1. Dies wiederum setzt voraus, dass die Geburtenhäufigkeit der Mädchengeburten ständig gleich bleibt, d.h. die Überlebenden von je 100.000 geborenen Mädchen im gebärfähigen Alter immer wieder 100.000 Mädchen zur Welt bringen. Die Fruchtbarkeit von 1927 müsste daher um 3,93% grösser sein, um den Wert von J=1 zu erreichen. Den Berechnungen nach war bereits im Ausgangsjahr 1927 die Geburtenhäufigkeit zu niedrig, um die jährlich gleichbleibende Lebendgeborenenzahl wie im Jahre 1927 konstant zu halten.

Im Entwicklungsfall B wird angenommen, dass neben den ehelichen und unehelichen Fruchtbarkeitsziffern bei gleichen Verheiratetenquoten und die allgemeinen Fruchtbarkeitsziffern bis 1955 um 25% abnehmen und auf diesem niedrigeren Niveau in den Folgejahrzehnten sich nicht verändern. Die stabile Bevölkerung, die bei einer ab 1955 gleichbleibenden, um 25% niedrigeren Fruchtbarkeit und unveränderten Sterblichkeitsverhältnissen entstehen wird, zeigt eine Zunahme des Defizits an Mädchengeburten. Bei einem Geburtendefizit von -11,45‰ kommt es langfristig zu einer Bevölkerungsschrumpfung und -alterung. Unter diesen Bedingungen wird die Gesamtbevölkerung im Jahr 2055 auf 25,09 Millionen zurück gehen.

Die Geburten- und Sterbeziffern der stabilen Bevölkerung
Die Form der stabilen Altersstruktur, die sich nach Berechnungen der amtlichen Statistik bis 2055 herausgebildet hat, leitet über zu der Frage, wie sich unter diesen stabilen Verhältnissen die Geburten- und Sterbeziffern entwickeln werden. Die Dynamik des Alterungsprozesses der Bevölkerung, die zahlenmässige Zunahme in der Besetzung der höheren Altersgruppen, belegen die Kurvenverläufe der Sterbeziffern nach dem Entwicklungsfälle A und B (siehe Grafik 9.11).

Nach dem Entwicklungsfall A werden sich die Lebendgeborenen- und Gestorbenenzahl ständig die Waage halten. In diesem Fall wächst weder der Bevölkerungsbestand, noch verringert er sich, er bleibt vielmehr dauerhaft unverändert.

Nach dem Entwicklungsfall einer stabilen Bevölkerung bei gleichbleibender Geburtenhäufigkeit wie 1927, verringert sich der Geburtenüberschuss und mit Beginn der 1960er Jahre wird die weitere demografische Entwicklung durch einen Sterbefallüberschuss gekennzeichnet sein. Das Geburtendefizit beläuft sich auf ca. 1,3‰ und führt langfristig unter den Bedingungen einer stabilen Altersstruktur zu einem leichten Bevölkerungsrückgang.

Nach dem Entwicklungsfall B, die rückläufige Geburtenhäufigkeit um 25% bis 1955 und sich anschliessender Stabilität, setzt der Übergang vom Geburtenzum Sterbefallüberschuss bereits 1936 ein. Unter den Bedingungen einer sich herausbildenden stabilen Altersstruktur wird die weitere demografische Entwicklung durch ein Geburtendefizit von 11,4‰ bestimmt. Die Alterung der Bevölkerung wird unter den vorherrschenden Fruchtbarkeitsverhältnissen weiter voranschreiten.
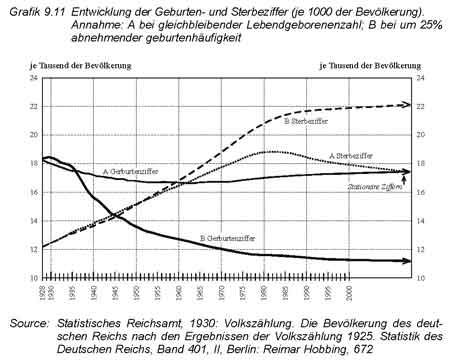
FlFig9.11


Die endgültigen Geburten-, Sterbe- und Sterbefallüberschussziffern erschliessen sich aus der nachfolgenden Tabel

Tabel 9.12 – Die endgültigen Geburten-, Sterbe- und Sterbefallüberschussziffern

FlFig9.12


Bevölkerungspolitische Implikationen der amtlichen Vorausberechnungen- ein kurzer Exkurs
Neben dem Statistischen Reichsamt war es vor allem der Statistiker Friedrich Burgdörfer, der die Ergebnisse der demografischen Vorausschätzungen als eine außerordentliche ernste Warnung betrachtete. Diese Berechnungen hatten seines Erachtens den Nachweis erbracht, daß in der Zukunft sich das dynamische Volkswachstum nicht mehr fortsetzt und statt dessen die demografische Entwicklung massgeblich durch den dauerhaften Rückgang des Volksbestandes bestimmt wird (Burgdörfer, Lebensfrage, 1929).

Er wie auch andere Vertreter der Statistik und Nationalökonomie führten den Diskurs zu der Frage, wie den sich abzeichnenden demografischen Entwicklungstendenzen wirkungsvoll begegnet werden kann. Mit Sorge verfolgen sie die sich abzeichnende Differenzierung in der ehelichen Fruchtbarkeitsentwicklung zwischen der städtischen und ländlichen Bevölkerung als auch die wachsenden Differenzierungsprozesse der ehelichen Fruchtbarkeit, die sich zwischen den verschiedenen sozialen Schichten und Berufsgruppen zeigten. All diese demografischen Faktoren verstärkten die Befürchtungen über nachhaltige Veränderungen des quantitativen wie auch qualitativen Bevölkerungsbestandes, der auf Basis der demografischen Vorausschätzungen und dem anhaltenden Rückgang der erwerbs- und reproduktionsfähigen Bevölkerung exemplifiziert wurde.

Die Befürchtungen vor einem dauerhaften Bevölkerungsrückgang beherrschen in den 1920er Jahren das demografische Denken nicht nur der Fachleute, sondern auch das der politischen Institutionen und Verbände. Sie entwerfen unzählige Konzepte, wie der anhaltende Geburten- und eheliche Fruchtbarkeitsrückgang aufgehalten werden könnte. Es wurde die abnehmende Bereitschaft der Frauen zur Geburt von mehreren Kindern beklagt. Statt der Geburt von vier und mehr Kindern, die für die Bewahrung des Bevölkerungsbestandes notwendig seien, würden die Frauen seit Beginn des 20. Jahrhunderts nur mehr ein oder zwei Kinder zur Welt bringen. Nach Auszählungen von Burgdörfer waren zwischen 1901 und 1925 die Erstgeburten um ca. ein Viertel, die der Zweitgeburten um ca. 38%, die Geburten von dritten Kindern um ca. 57% und die von vierten und fünften Kindern um 75% bzw. 80% zurückgegangen. In diesen Tendenzen sah er eine wachsende Gefahr für den strukturellen und den zahlenmässigen Bevölkerungsbestand.

Angesichts dieser quantitativen und qualitativen Veränderungen des Bevölkerungsbestandes propagierten Friedrich Burgdörfer und viele seiner Kollegen eine pronatalistische Familien- und Bevölkerungspolitik, die auch eugenische Zielsetzungen verfolgen sollte. Bereits während des Ersten Weltkrieges wurde die Erstellung einer Familien- und Fruchtbarkeitsstatistik angeregt, die Bestandteil der Bevölkerungsstatistik sein sollte. Ziel dieses statistischen Erfassungs- und Auswertungssystems war es die “biologischen” Vorgänge, d. h. die Fruchtbarkeitsvorgänge einer jeden Familie zu überwachen und das Tempo und die Intensität der ehelichen Fruchtbarkeit zu steuern (Beiträge, 1935, 6) Auf der Basis der familien- und fruchtbarkeitssatistischen Erhebungen regte Burgdörfer die Einführung der “Aufwuchsziffer” an. Diese sollte Auskunft darüber geben, wieviel der von 100.000 Frauen im Verlauf ihrer Fruchtbarkeitsperiode erbrachten Geburten das 15. Lebensjahr erreichen. Das 15. Lebensjahr markiert den Eintritt in das Erwerbsleben als auch in die reproduktive Fruchtbarkeitsperiode der weiblichen Bevölkerung und trage deshalb eine demografische Bedeutung.

Eine genaue Erfassung und Kontrolle des Heiratsalters und der Ehedauer mittels der Familien- und Fruchtbarkeitsstatistik ermögliche den “Gebärertrag” der verheirateten Frauen als auch die tatsächlich erbrachte Geburtenzahl und die Geburtenfolge zu ermitteln. Die Rückkehr zu dem Geburtenniveau, das von der weiblichen Bevölkerung um die Wende vom 19. zum 20. Jahrhundert erbracht wurde, entsprach auch der politischen Idee von der Wiederherstellung der “Volkskraft”, der “nationalen Erneuerung” und der “Rassetüchtigkeit”.
Dieser politische Leitgedanke bestimmte die familien- und bevölkerungspolitischen Zielstellungen zur quantitativen und qualitativen Erneuerung des “Volkskörpers”. Zur Wiederherstellung der demografischen Verhältnisse, wie sie vor dem Erstem Weltkrieg auf dem Territorium des Deutschen Reichs vorherrschten, wurde die Zusammenführung der quantitativen als auch qualitativen Familien- und Bevölkerungspolitik gefordert, die zwei Schwerpunkte verfolgte: Erstens sollte der Bevölkerungsbestand und das Bevölkerungswachstum gesichert und zweitens die Verschlechterung der Erbqualitäten aufgehalten und vor allem der Bevölkerungsbestand der gesunden und arbeitsfähigen Bevölkerungsgruppen erhöht werden (Denkschrift, 6). Im Artikel 119 der Weimarer Verfassung wurde die Verantwortung des Staats für die Gesundheit der Familie und des Nachwuchs verankert.

Die Einführung der familien- und fruchtbarkeitsstatistischen Erfassung war ursprünglich für die erste Volkszählung nach Ende des Ersten Weltkrieges vorgesehen. Hierzu kam es nicht, weil ebenso wie bei der nächst folgenden Volkszählung von 1925 die finanziellen Mittel für den Aufbau eines einheitlichen Systems der Familien- und Fruchbarkeitsstatistik fehlten. Erst Jahre später, unmittelbar nach der Konstituierung des nationalsozialistischen Staats wurden die erforderlichen finanziellen Ressourcen für den Aufbau der Familien- und Fruchtbarkeitsstatistik bereit gestellt und mit der Volkszählung vom 16 Juni 1933 auch erstmals für das gesamte Territorium des Deutschen Reichs praktiziert.

Um die in der Vorausberechnung berechneten und thematisierten Tendenzen, die zunehmende Bevölkerungsalterung und die rückläufige Geburtenund Fruchtbarkeitsentwicklung, gezielt beeinflussen und steuern zu können, wurden darüber hinaus auch die Gestaltungsmöglichkeiten in den Bereichen der Sozial- und Familienpolitik erörtert. Bereits zum Ende der Weimarer Republik wurden konkrete Massnahmen wie beispielsweise der Ausgleich der Familienlasten und die steuerliche Entlastung der Kinderreichen diskutiert. Erörtert wurden verschiedene Modelle, die Kinderlosen und Ledigen steuerlich stärker zu belasten als die Familien mit Kindern. Darüber hinaus sollte die Erziehungsbeihilfe, vor allem für Familien mit zwei Kindern eingeführt werden. Durch diese finanziellen Leistungen sollten sie zur Geburt eines dritten Kindes motiviert werden (Zahn, 1921, Elster, 1924, Harmsen, 1931, Burgdörfer, 1934).
Die breite Diskussion von Vorschlägen zur materiellen und ideellen Unterstützung der Familien und zur Absicherung der sozialen Lebenslagen der älter werdenden Bevölkerung, die hierüber nach 1930 geführt wurden, ist wenig untersucht worden und bleibt daher noch für längere Zeit der Forschungen vorbehalten.

Anmerkungen

1 Der Gesamtumfang der abgetretenen Gebiete belief sich auf ca. 13% der Gesamtfläche des Deutschen Reichs vom 1. Januar 1910. Ergänzend fügte das Statistische Reichsamt hinzu: “Rund 2 Millionen deutscher Männer im produktivsten Alter sind unmittelbar dem Krieg zum Opfer gefallen, rund 3 Millionen Kinder sind infolge des Krieges (bis Ende 1919) ungeboren geblieben und das Deutsche Reich wurde verpflichtet, rund 7 Millionen Einwohner an andere Staaten abzutreten. ” (Statistisches Reichsamt, 1925, Die abgetretenen Gebiete, 1925, 6).
2 In der Literatur werden für die Methoden zur Berechnung der künftigen Bevölkerungsentwicklung und -struktur unterschiedliche Begriffe wie Vorausberechnung, Vorausschätzung und Prognose verwendet. (Feichtinger, 1979; de Gans, 1999; Romanuic, 1991, 1994). Der Begriff der Bevölkerungsprognose wurde in beiden ersten Vorausberechnungen vermieden, obgleich die Berechnungszeiträume zwischen 50 bis 100 Jahren umfassen. In der zweiten Vorausberechnung werden einleitend auch “bedingte Voraussagen” über die künftige Bevölkerungsentwicklung und -struktur formuliert. (Statistisches Reichsamt, 1930, Ausblick, 663). In meiner
Abhandlung werde ich den Arbeitsbegriff “Vorausberechnung” verwenden.
3 Die zweite Vorausberechnung wurde völlig neu gerechnet und das Berechnungsmodell der stabilen Bevölkerung in Anwendung gebracht.
4 Friedrich Burgdörfer zählte zu den führenden Statistikern des Statistischen Reichsamtes. Seit 1921 gehörte er zunächst als Regierungsrat und später als Oberregierungsrat dem Statistischem Reichsamt an. Zu seinem Verantwortungsbereich zählte u.a. die Vorbereitung und Durchführung der Volkszählungen 1925, 1933 und 1939. Die wesentlichsten Ergebnisse seiner Vorausberechnungen veröffentlichte er 1932 in der Schrift “Volk ohne Jugend”. Mit ihr beförderte er die bevölkerungspolitischen Diskussionen in der Übergangsphase der auseinanderbrechenden Weimarer Republik und der sich konstituierenden NS-Herrschaft in Deutschland.
Ausführlich diskutiert Florence Vienne in ihrer Dissertation die Ergebnisse der Bevölkerungsvorausberechnung von Burgdörfer. (Vienne, 2000).
5. So stieg die in den Kriegsjahren die Sterblichkeit der 15 bis unter 20jährigen Männer um mehr als das dreifache, der 20 bis unter 25jährugen um mehr als fünfzehnfache, der 25 bis unter 30jährigen Männer um das zehnfache und das der 30 bis unter 35jährigen um mehr als das sechsfache.
6 In der Regel waren in den einzelnen Altersgruppen ca. 8 bis 10% weniger Frauen 1925 verheiratet als 1910.
7 Die Komponentenmethode wurde wenige Jahre zuvor in ihren Grundzügen von F.R. Sharpe & Alfred J. Lotka entwickelt. (Sharpe & Lotka, 1911).
8 In den Berechnungen für die Entwicklung der ehelichen Fruchtbarkeit wurden die konstanten Zahlen der unehelichen Fruchtbarkeit integriert. Es wurde angenommen, dass diese Zahlen mittel- und langfristig sich nicht verändern werden.
9 Die Änderungsfaktoren ” beziehen sich jeweils auf das Basisjahr und beschreiben somit die zeitliche Entwicklung der beiden Komponenten in Relation zum Basisjahr. Die Änderungsfaktoren beziehen sich jeweils auf ganze Altersgruppen und Zeitabschnitte.” (Bretz, 2000, 653)
10 “Eine stationäre Bevölkerung ist eine fiktive Bevölkerung, die sich aus einer etwa 100 Jahre lang konstanten Geborenenzahl bei gleichzeitig gleichbleibenden Sterblichkeitsverhältnisse ergeben würde”. (Statistisches Reichsamt, 1926, Richtlinien, 42).
11 Allerdings zeigen sich auch deutliche Abweichungen in der Intensität des Bevölkerungswachstums nach den drei Entwicklungsfällen.
12 “Die Besserung der Sterblichkeitsverhältnisse, ausgedrückt durch das allmähliche Ansteigen der mittleren Lebenserwartung” lassen sich zur Bildung des Deutschen Reiches 1871 zurück verfolgen. (Statistik des Deutschen Reichs, 1926, Richtlinien,44).
13 Zu erwarten war mit hoher Wahrscheinlichkeit, dass die “im jugendlichen Alter stehende(n) Bevölkerung” sich beträchtlich verringern wird, während die Zahl “der im höheren und höchsten Alter stehenden Bevölkerung stark ansteigen wird.” (Statistisches Reichsamt, 1926, Richtlinien, 44).

14
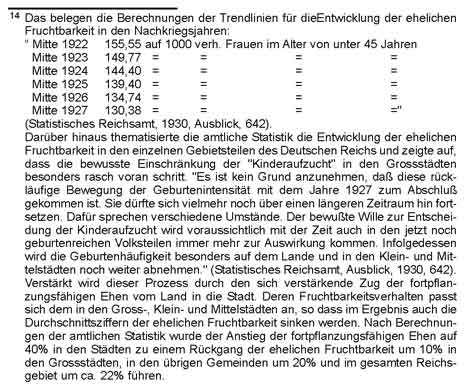
FlNoot14


15 Hierfür wurde die Familienstandsgliederung nach der Volkszählung vom 16. Juni 1925 und die Veränderungen der Heiratsverhältnisse in den Jahren 1925 bis 1927 zur Grundlage genommen. (Statistisches Reichsamt, Bewegung, 360, 6ff).
16 Damit wurden die Störungen im Bestand der männlichen Bevölkerung in den Altersgruppen mit der höchsten Heiratshäufigkeit ausgeschlosen.
17 Dieses Verfahren wählte die amtliche Statistik, weil sie weder über eine aktuelle Heiratstafel noch eine Familienstatitstik verfügte. Für die Berechnungen wurden Erhebungen von Preussen und des Freistaats Sachsen zur Entwicklung der Eheschliessungen und der geborenen Kinder in den Familien, gegliedert nach der
Ehedauer zugrunde gelegt. (Statistisches Reichsamt, Bewegung, 360, 22ff).
18 Allerdings ist “diese zyklische Wiederholung der ersten Geburtenwelle jedoch bei weitem nicht so stark ausgeprägt, wie gemeinhin erwartet werden dürfte” (Statistisches Reichsamt, 1930, Ausblick, 661).
19 Das bedeutet, dass die eheliche und uneheliche Fruchtbarkeit von 1955 ab, wie im zweiten Entwicklungsfall angenommen, unverändert bleibt, während die Lebendgeborenenzahl von Jahr zu Jahr beständig abnimmt.
20 Das Schwergewicht wird hierbei allerdings auf die Berechnung und Kommentierung der ersten zwei Entwicklungsfälle gelegt.
21 Der Entwicklungsfall B hat für die amtliche Statistik eine besondere Relevanz, weil “eine Abnahme der durchschnittlichen Geburtenhäufigkeit der gesamten Reichsbevölkerung um 25% des Standes von 1927 durchaus im Bereich des Möglichen liegt.” (Statistisches Reichsamt, 1930, Ausblick, 642).
22 In seinem Bevölkerungsmodell schliesst Lotka die Altersstruktur, die durch historische Zufälligkeiten entstanden war, aus.
23 Bei einem vollständigen Ersatz ist der rechnerische Ausdruck gleich 1. Bei nicht gesicherten Reproduktion ist der rechnerische Ausdruck kleiner als 1 und bei einer erweiterten Reproduktion ist der rechnerische Ausdruck grösser als 1.

Literaturverzeichnis
Brentano, Ludwig Josef (1909). Die Malthussche Lehre und die Bevölkerungsbewegung der letzten Dezennien. In: Abhandlungen der historischen Klasse des Königlich Bayerischen Akademie der Wissenschaften, 24. Band, III. Abt., München.
Bretz, Manfred (2000). Methoden der Bevölkerungsvorausberechnung. In: Mueller, Ulrich, Nauck, Bernhard, Dieckmann, Andreas (Hrsg.), Handbuch der Demographie, pp. 643-681. Bd. 1. Berlin: Springer.
Burgdörfer,Friedrich (1929).Die Lebensfrage des deutschen Volks. Entgegnung auf Borgius’ “Grundsätzliche Bemerkungen” zu meinem Buche. Zeitschrift für Sexualwissenschaft, XVI.
Burgdörfer , Friedrich (1929). Der Geburtenrückgang und seine Bekämpfung. Die Lebensfrage des deutschen Volkes. Berlin.
Burgdörfer, Friedrich (1932). Volk ohne Jugend. Geburtenschwund und Überalterung des deutschen Volkskörpers. Ein Problem der Volkswirtschaft, der Sozialpolitik, der nationalen Zukunft. Berlin: Kurt Vowinckel.
Gans, Henk A. de (1999). Population Forecasting 1895-1945. The Transition to Modernity. Dordrecht: Kluwer Academic Publishers.
Denkschrift des Ministers des Innern über die Ergebnisse der Beratungen der Ministerialkommission für die Geburtenrückgangsfrage, Berlin 1917.
Elster, Ludwig (1924). Bevölkerungswesen: Bevölkerungslehre und Bevölkerungspolitik, 735-812. In: Handbuch der Staatswissenschaften. Jena: Fischer.
Feichtinger, Gustav (1979). Demographische Analyse und populationsdynamische Modelle. Grundzüge der Bevölkerungsmathematik. Wien: Springer.
Grotjahn, Alfred (1914). Geburten-Rückgang und Geburten-Regelung. Im Lichte der individuellen und sozialen Hygiene. (Zweite mit einem Nachwort versehene Ausgabe). Berlin: von Marcus.
Harmsen, Hans (1931). Praktische Bevölkerungspolitik. Ein Abriss ihrer Grundlagen, Ziele und Aufgaben. Berlin: Junker und Dünnhaupt.
Lotka, Alfred, J. (1925). On the true rate of natural increase of population. Journal of the American Statistical Association, 20, 305-39.
Mombert, Paul (1907). Studien zur Bevölkerungsbewegung in Deutschland in den letzten Jahrzehnten mit besonderer Berücksichtigung der ehelichen Fruchtbarkeit. Karlsruhe: G. Braunsche Hofbuchdruckerei.
Müller, Johannes (1924). Der Geburtenrückgang. Jena: Gustav Fischer.
Neue Beiträge zum deutschen Bevölkerungsproblem (1935). Sonderhefte zu Wirtschaft und Statistik, 15.
Romanuic, Anatole (1991). Bevölkerungsvorausschätzungen als Voraussage, Simulation und Zukunftsanalyse. Zeitschrift für Bevölkerungswissenschaften, 17, 4, 394-410.
Romanuic, Anatole (1994). Reflection on population forecasting. From prediction to prosprective analysis. Canadian Studies in Population, 21, 2, 165-180.
Sharpe, Francis R. & Lotka, Alfred J. (1911). A problem in age-distribution. Philosophical Magazine, 6, 21, 435-428.
Statistisches Reichsamt (1922). Bewegung der Bevölkerung in den Jahren 1914 bis 1919. Statistik des Deutschen Reichs, Band 276. Berlin: Reimar Hobbing.
Statistisches Reichsamt (1925). Die abgetretenen Gebiete und das Abstimmungsrecht und das Abstimmungsrecht an der Saar nach den Ergebnissen der Volkszählung vom 1.7.1910. Sonderhefte zur Wirtschaft und Statistik, Sonderheft 2. Berlin: Reimar Hobbing.
Statistisches Reichsamt (1926). Richtlinien zur Beurteilung des Bevölkerungsproblems Deutschlands für die nächsten 50 Jahre. In: Die Bewegung der Bevölkerung in den Jahren 1922 und 1923 und die Ursachen der Sterbefälle in den Jahren 1920 bis 1923. Statistik des Deutschen Reichs, Band 316, 37-50.Berlin: Reimar Hobbing.
Statistisches Reichsamt (1929). Beiträge zum deutschen Bevölkerungsproblem. Der Geburtenrückgang im Deutschen Reich. Die allgemeine deutsche Sterbetafel für die Jahre 1924-1926. Sonderhefte zur Wirtschaft und Statistik, Sonderheft 5, 7-46. Berlin: Reimar Hobbing.
Statistisches Reichsamt (1930). Ausblick auf die zukünftige Bevölkerungsentwicklung im Deutschen Reich. In: Volkszählung. Die Bevölkerung des deutschen Reichs nach den Ergebnissen der Volkszählung 1925. Statistik des Deutschen Reichs, Band 401, II, 641-683. Berlin: Reimar Hobbing.
Statistisches Reichsamt (1930). Die Bewegung der Bevölkerung in den Jahren 1925 bis 1927 mit vorläufigen Ergebnissen für die Jahre 1928 und 1929. Die Ursachen der Sterbefälle in den Jahren 1925 und 1926 und die Ergebnisse der Heilanstaltsstatistik in den Jahren 1925 und 1926. Statistik des Deutschen Reichs, Band 360. Berlin: Reimar Hobbing.
Wolf, Julius (1912). Der Geburtenrückgang. Die Rationalisierung des Sexuallebens in unserer Zeit. Jena: Fischer.
Vienne, Florence (2000). “Volk ohne Jugend” de Friedrich Burgdörfer. Histoire d’un objet du savoir des années vingt à la fin de la Seconde Guerre mondiale Place of Publication: Paris Publisher: École des Hautes Études en Sciences Sociales (EHESC). Remarks: Dissertation.
Zahn, Friedrich (1912). Deutsche Bevölkerungspolitik nach dem Kriege. In: Auschnetz, Gerhard, Berolzheimer, Fritz, u. a. (Hrsg), Handbuch der Politik – Die politische Erneuerung, pp. 307-317. Berlin: Rothschild.

About the Author:
Jochen Fleischhacker was, until 2002, the leader of the research unit “Projects on the History of Demographic Thinking” at the Max Planck Institute for Demographic Research in Rostock (Germany) and a teacher of the history of demographic thinking and modelling at the Department of History of the University of Rostok. He has published on the the history of demographic methods and models and about the demogrpahic upheavals after 1990 in East Germany.

This essay was published earlier in:  Populations, Projections and Politics. Critical and Historical Essays on Early Twentieth Centruy Population Forecasting. Edited by Jochen Fleischhacker, Henk A. de Gans and Thomas Burch. – Rozenberg Publishers 2003
Read also from the same book: Henk A. de Gans – The Innovation of Population Forecasting Methodology in the Inter-War Period: The Case of The Netherlands.


Terra Firma: Ashore in the Bay of Strangers

Friday, 25 August 1995 – “Bosun – topside!” The Captain’s command over the intercom aroused me from a deep sleep. Henri, jumping from his cot, rushed out to film the action on deck. Soon the muffled rattling of the anchor chain reverberated throughout the ship: we were dropping anchor. Slowly, I got up. Fleetingly, ever so fleetingly, a wave of revulsion suffused my body, and I tried not to think about what was outside: a fog-shrouded, ice-cold sea and a huge, empty island. I glanced at my watch: 7:15 a.m. Through the porthole I could see a calm sea, light blue under a low, grey sky. If this was Ivanov Bay, the grave search party would go ashore. If it  wasn’t, only the Captain might know where on earth we may be. I got dressed and hurried outside. In the light, drizzly mist that engulfed the ship, Jerzy and Bas were siphoning gasoline into lemonade bottles from a big, rusty fuel barrel on the foredeck, using a rubber hose. Inside, the breakfast table had been set, but there was no time to eat. The landing of the grave-searchers was busily being prepared, as Boyarsky was threatening that the sea might soon get rough again. Only George, with aristocratic unconcern, sat sipping a cup of tea in the otherwise empty mess room. The corridors teemed with foot traffic. The hum of electric motors resonated through the steel vessel as the deck crane deposited a huge stack of wooden beams and planks from the hold into the landing craft. For protection against bears, the Ivanov Bay group would be constructing a hut for their stay. On deck, the atmosphere was frenzied and tension was palpable, with good-byes adding to the din of cargo handling.

Freed from all its cables, our landing craft, a red steel barge five meters long, danced merrily atop the waves. Once the entire Ivanov gang had climbed down the rope ladders, the droning plashkot sailed rapidly into the haze. Bundled up in gear as if ready to go ashore myself, I stood in a light rain atop Kiriev’s bridge and followed the progress of the landing through binoculars. A trio of long, rustbrown walruses glided by the red craft through the pale blue sea. It was easy to distinguish their bristling snouts, which spit out a spray of condensation and water when the animals are surfacing. It was +4°C. Novaya Zemlya was just a dark strip of land, the elevations above ca. 100 m disappearing into the low clouds. There was little snow.

By 11:15 a.m., the Ivanov group was ashore. The landing craft delivered a second load and was hoisted aboard. Kiriev raised anchor, but would not sail towards Ice Harbor. It had been decided to seek shelter from a new storm in Inostrantsev Bay, on the west coast of the island. Excitement swept over the ship when, at noon, we saw the first unobtrusive iceberg float by: the entire oyage so far had not provided this many sights. The silent flotilla of blue sculptures grew by the hour, indicating the proximity of calving glaciers. Our arrival in Inostrantsev Bay was estimated for 3:00 p.m. The plan calls for a reconnaissance sortie with two groups along the beaches of the bay, to search for cairns. Boyarsky requests that we be specifically alert for objects indicating the presence of the ancient Pomors and the Nazis, who operated in greatest secrecy on these shores during their Arctic campaigns. The approaching landing put us back on the alert. Bas distributed ammunition for the rifles and reviewed the arms discipline. “Should a polar bear come after us and we decide to fire at him,” he instructed us, “we’ll follow our firing-range routine. The shooter kneels down and someone else counts the bear’s approach: fifty meters… forty meters… thirty meters… Don’t stare at the bear, but focus on his chest or on his shoulder. There will be three cartridges in the magazine. For reasons of safety, do not keep a cartridge in the chamber. Remember, the second man keeps additional ammo at the ready.”

Self-sufficiency is imperative for one venturing out in the Arctic, and it was high time to get my gear in order. (“Coming along?” Anton, our film director, would tell the viewer. Small kids start crying, young women turn off the TV.) What do I need? After polar bears, the unpredictable weather, which can change from quiet to severe in half an hour, is the greatest challenge. The land is barren and provides no shelter. There is no snow in which the stranded traveler could dig a shelter against the piercing winds. To be lightly equipped and able to move about swiftly, I packed the thin, reinforced Gore-Tex cover of the Navy-issue sleeping bag and a small stove, with a one-liter bottle of gasoline, enough for two weeks. High-grade gasoline is harder to come by in these parts of the world than diesel or kerosene but more practical because kerosene fuel oil has a flash point well above 40°C and won’t ignite easily in low-temperature environs. I took my down jacket, wrapped in a plastic bag, so I could leave my sleeping bag on board. I took wax for my boots, packages of instant soup, chocolate milk, and mashed potatoes. There would be sufficient meltwater on land, but just to be sure, I filled my canteen. On a waist belt, I carried the dagger and a pouch containing flare gun, GPS, a set of waterproof-packed batteries, a notebook with waterproof paper, and a pencil. I took some extra film and decided where to put everything: the rain gear fortunately has plenty of zippered pockets to stow away the many little items I need to keep track of.

The sea was calm: smooth as glass. The landing craft glided over in fifteen minutes and at 4:00 p.m. ground onto the steep, gravel beachfront. The sailors kept the engine running to maintain a solid lock while we disembarked. In clouds of smoke and steam, we climbed the steep ridge of loose gravel. Then, after reversing the propeller’s motion, the plashkot quickly retreated into the fog.

A steep bluff, tall and dark, disappeared on either side of us into the mist: the Edge of the World. Gigantic whale vertebrae lay scattered across the beach. Large blocks of ice swung in the surf. The group split without losing time and five men started off toward the southeast. The other team would move northwest. We gathered the life vests in stacks, then covered them with heavy boulders and lengths of driftwood. The north team, which includes Jerzy, Yuri, Dirk, Mark and me, spread out over the ~200 m wide beach. The bluff denied us a view into the interior, and I quickly considered how much it would take to conquer the obstacle. As I approached the slope, I discovered that it is barely 50 m tall. Each step lessened the elevation; the ground seemed to be falling away beneath my feet. As I neared the cliff edge and saw inland, my elevation above sea level was approximately 15 m, and I could begin to see the dimensions of this world. Altitude and distance are difficult to estimate in an empty landscape. Most people would find this environment intimidating and depressing. Down on the beach, Jerzy called and gestured and I came running back. “No more of that puppy-like behavior!” he said angrily, as I, panting, resumed my position. One must feel the landscape. Fine, grainy debris fans across the plain. The ground consists of sharp, slaty sandstones, characterized by thin smooth plates and shiny slivers, which break down to sand-size fragments. Patterned ground indicates the presence of permafrost: half a meter down, ground temperatures never rise above 0° C. Summer thaw of the upper soil has caused flat slabs of rock to sink and stand at odd angles, like headstones in a graveyard. Patches of moss, which needs phosphates, often form around decaying whale bones or large bird  carcasses. One such patch was rectangular and had the approximate dimensions of a burial. Jerzy assembled the metal detector and surveyed the moss. No signal. He shrugged and we moved on. We tossed each other an oversized rubber wader to cross a stream.

After walking for two hours, we arrived at a promontory and in awe observed a blue glacier tongue loom through the fog. The calving front is like bright blue marble, rising from the sea a sheer fifty meters. Every now and then, large slabs collapse from the glacier with a roaring noise. This fills the bay with larger and smaller icebergs, which, in the absence of wind, float around randomly. Jerzy nodded, “If you, sailing along the coast, wanted to bury somebody… where would you do that?” We looked around and spotted a collapsed cairn nearby. The stack of rocks was about 1.5 m across and could easily cover a grave. To our surprise, the detector gave a loud and clear signal. There was a metal object underneath the cairn, which might well have been put together as a navigational aid by Norwegian or Russian hunters. It could be a button, or a ring, or a bullet. Often, those building a cairn would leave a message in a pewter can or inside a soldered bottle.

Unfortunately, we ran out of time and within a half hour would have to move back to the landing zone to meet the plashkot. The GPS measurements came through and I read the coordinates to Dirk. Our reporter, Mark Glotzbach, was scribbling along and we asked him not to put this in the paper. While the others prepared a quick sketch of the cairn, I joined the two Russian geologists who had caught up with us. They established the limits of a rock outcrop marked on the geological map. Skeletal remains were spread all over and there were reindeer tracks. I stumbled across three enormous polar bear skulls, one with a bullet hole. Water rose to my ankles in a muddy stream where I photographed a heavy wooden construction that must have washed ashore during a storm. A steepsided moraine, possibly indicating the glacier’s extent in Barents’ time, stretched inland. Along the high-tide line lay unimaginable numbers of beached aluminum and plastic floats, shampoo bottles, cleaning brushes, plastic detergent containers, polyethylene rope, nets, fish-boxes, and other fishery material: the garbage that is carried on the poleward-flowing North Atlantic ocean current.

I expect that Ice Harbor will get less detritus. “Coming along?” said Jerzy when our team zippered up and prepared to head back. “We’ll come back later for this one.” The clouds had lowered and a fine rain swept across the beach. In a chilly dusk we started walking. When we got back to our landing site, I was thoroughly soaked from the continuing drizzle. The north group had returned earlier. It is a raucous gang!

The ship’s doctor was shooting at boards and crates set up by his assistant. The homemade gunpowder created a huge cloud of smoke with each shot. Another nut was firing green flares into the clouds to attract Kiriev’s attention, but I had a hard time believing that the vessel, anchored about a kilometer offshore, could see the fireworks. He then shot a wide-barreled handgun, and an enormous, yellow flare bathed the layer of fog in a threatening glow before arching into the sea and a flickering death. The Russians are very amicable and again liberally poured vodka around a big fire. The drinks hit mercilessly. Tired and chilled, I could feel my cold, sweaty shirt stick to my back. Snowflakes mixed with the rain.

For this absurd beach festival, we had abandoned our research, for which neither cost nor effort had been spared. We stuck to the rules and came back at the agreed upon time – it’s only the decent thing to do – and we were paying the price. The doctor finally blasted the case to smithereens. So much for the firearm discipline, too. The spectacled Badyukov brothers, Dmitri (Dima) and Daniel, then asked if I knew the joke about a Dutchman, a Frenchman, and a Russian on an uninhabited island, and I let go of my resistance. We must just go along as things have been going here for centuries. “A Russian, a Frenchman, and a Dutchman are stranded together on an uninhabited island,” the joke began. The vodka was stinging in our mouths. “They had to find means to survive and walked along the tide line in search of anything useful. The Frenchman found a bottle of wine; the Dutchman, a bottle of whiskey. But the Russian found a rare jar. They decided to open the jar first. As soon as the Russian pulled the cork, a spirit appeared, who said ‘I am the spirit of this jar’ and invited all three to make a wish. The Frenchman looked at his watch and said ‘Now that it is six o’clock, I would like to be with my wife.’ And  he disappeared! The Dutchman thought for a few moments and then asked the ghost to whisk him off to a grand hotel. He, too, was gone. Now, it was the Russian’s turn. He looked sad and said to the ghost, ‘I just had two buddies and two bottles to empty with them.’” Daniel, who was presenting this joke, paused contentedly and stared into the flames before continuing: “‘And now,’ the Russian said, ‘I have only this empty jar. I wish that they would return!’” The brothers laughed uproariously. “So you see,” says Dima, “it won’t help to wish yourself away from here.”

The vodka pouring had caused a brief intermission in the activity of that flareshooting grey mouse, who now resumed his effort to draw the ship’s attention. Each flare went up with the sound of a firecracker. It was making everyone jumpy. Clearly, he wished to be taken off the island, and I, too, had had my share of socializing. Not a moment too soon, Jerzy tossed his cigarette butt on the ground and pulled a radio from his pocket to call in the landing craft. Half an hour later, at 10:15, our salvation emerged from the dusk. The return to Kiriev was ice cold but indescribably beautiful. People were silent, tired and intoxicated to the point of exhaustion. The fire on the beach rapidly turned into a small orange light and then vanished into the fog. The sea was a light blue, with widely scattered icebergs, silent and still. It is difficult not to see all kinds of images in the melted, clear-blue or crystal-clear ice shapes: knights on horseback, gruesome figureheads with mute, frozen screams on their faces, grotesque monsters, gargoyles, and dragons. Pieces of transparent and molten ice floated past the sides of the plashkot, crackling sharply like ice cubes in a glass of lemonade. The deckhand hung across the bow signaling port or starboard to the helmsman as we maneuvered through the bergs. Kiriev continued to remain out of sight. Four hundred years ago, off this same coast on their return voyage, the two sloops of winterers fired muskets to find each other in the dense fog (26 June 1597). The helmsman got on the radio several times. Because the vessel could not see us either, I assume he received  directions based on Kiriev’s radar. In any case, a weak glow soon appeared in the fog.


Kiriev turned on all lights: a magnificent show. We were silent; I was struck by size of our ship. Our safe, warm base appeared terribly small, yet ingenious, floating on the vast sea under that great, impermeable sky. After a good fifteen minutes, which seemed endless, we docked alongside the vessel and climbed aboard by a rope ladder. In heavy weather, as we noticed on another occasion, the crew drops a large mesh alongside, which you must grab onto at the crest of a wave. To counteract the waves, the ship turns into the wind like a mother swan of steel. The crew works smartly and fully focused, and as soon as they can grab you they’ll hoist you aboard in one swift motion. When all had boarded, the crane lifted the landing craft onto the deck, cargo and all. In the mess, it turned out, dinner was waiting. Anton sat across from me.

“So…” he pushed his chair closer, “a delicious soup!” He rubbed his hands, grabbed the spoon and carefully slurped the yellowish, salt water. The kitchen staff was already setting out the next dish: potatoes and black-fried liver. The soup gone, Anton looked at me. “Marvelous, right, all those frost-shattered rocks?” While he was talking, I thought of Pieter and Dr. Maat. How are they doing? They are sitting like princes with Eugene, Konstantin, Vitali, and Nicolai in their small cabin, surrounded by silence. Meanwhile, my research time is being nibbled at from two sides. Every day spent at anchor is critical; we already knew that. Now, it also turns out that Starkov has to be back in Moscow on 14 September, to catch the monthly flight from Moscow to Spitsbergen. He expects us to drop him off well before that at Amderma, on the North Russian coast.

This puts our schedule under enormous pressure. Starkov looks grimmer by the day, and we’ll have to use our time at Ice Harbor to the fullest to get the work done. Thus, it becomes almost impossible to journey inland. This is quite a blow, but better not piss and moan about it, for I, too, will have to strain to complete my tasks.


Saturday, 26 August 1995 After some five hours of sleep, I awoke at 7:00 a.m. and dressed for a landing near yesterday’s find. Instead, I soon found out, we will sacrifice another day. Boyarsky doesn’t want to risk our getting stuck on land if the weather suddenly deteriorates, and they have denied our survey ashore. This I take with a healthy mistrust. The Russians appear to have an agenda of their own. Even the trip to Ice Harbor is being delayed and we apparently are awaiting the arrival of a storm in the confines of the bay. “Just get some rest,” Jerzy said comfortingly. “When the action comes, it’ll be fast.” I hung my waders to dry and rubbed them free of Novaya Zemlya’s glittering black sand in one of the ship’s corridors. As the heavy steel door clanged hermetically shut behind me, I sauntered whistling to the mess. The Captain, just coming down the stairs, put a finger to his lips. Embarrassed, I covered my mouth with my hand. Lore of the sea says that whistling aboard ship invites calamity. In the mess, I found Dr. Labutin and when he saw me, he jumped up and signaled me to come along. He’s quite a character! George told me that Labutin is almost 50 years old, but he looks like a caricature of the Russian medical student: tufted hair; horn-rimmed glasses; threadbare, checkered shirt with even the collar buttoned; and a brown knitted pullover. I followed him through the narrow corridors. Last night, bored, I had pasted one of the fake kiddy tattoos that Philips Electronics sent along with the batteries onto my chest. Once you’re under his care, Dr. Labutin won’t even look you in the face. He’ll pull your T-shirt out of your pants and only has eyes for what the meters indicate. But now, when he pulled my T-shirt up to place an electrode over my heart, he read “Kiss me” and a grin appeared across his face. Weight: 71 kilograms. Blood pressure: 75/180 (“Only if you see a girl walking down the street can it be somewhat higher,” says Dr. Maat). And then he signaled me to get on the bicycle again. The porthole was open and I could see icebergs. A good-sized, blue berg lazily floated by, scraping the side of the ship. I thought back to Amsterdam; the city hadn’t defeated me. I had only been there a short while and lived in a deserted warehouse on the quays of the IJ River. At nights, when I had trouble falling asleep, I would walk into town. Outside, further down along the dark building, I would see the outlines of girls in high heels, a purse across one shoulder, against an endless stream of headlights. Some nights, there were a hundred of them “working” and when I came home, they asked for cigarettes. Because of the solitary smoking and drinking, I wasn’t in such great shape two months ago, when I entered Gawronski’s basement office, but my strength quickly returned. When I had pedaled enough, Labutin gestured again and I sat up straight to look at the dial indicating my pulse. The doctor was satisfied. I could go now.

The wind turned to the northwest, so that Ice Harbor was now in the lee of the island, but was this a stable situation? At night the weather forecasts from Dikson, Murmansk, and a German station still contradict each other. The clouds had lifted somewhat, providing us with a better view of the Inostrantsev Bay. Through binoculars, I observed the landscape that we had traversed yesterday.

The plateau slopes towards dark mountains of ~300 m, behind which lies the ice cap; still hidden in clouds. In the southeast, the calving fronts of glaciers rise from the waters of the fjord. At the dark horizon of the Barents Sea are a number of small, rocky islands. I urged Jerzy to get us ashore in Ice Harbor at any cost. In my opinion, now that we have come so far, we should risk a bit more to go farther. This crew is restless and complaining.

Working in the Arctic has a frustratingly low effort-to-yield ratio, and most days are spent waiting and watching. For this, we invested years of our lives; I see the stack of scientific papers we’ve carried along and know the methods and instruments at our disposal. More people have been up Mount Everest than on Cape Spory Navolok. We are prepared and standing by. Jerzy called the researchers together to give them an accounting of this totally lost day. It is insane that we have been killing time lying at anchor in a flat sea and calm weather, only a stone’s throw from our once-remote goal. Why did they not allow us ashore? “We’ve all been somewhat frustrated by today’s events,” Jerzy started.

“The ship’s lying at anchor is the Captain’s decision. Here we have a good anchorage. Off Ice Harbor, Kiriev will have to cruise under difficult circumstances. That will cost fuel, fuel that we need to wrestle our way back to Archangelsk. We didn’t schedule a landing today because we can ill afford to have five men ashore for five or six days. The point is: this plashkot is unstable if the swell increases. This morning, we were all ready for it, but I declined to congregate on deck in full gear because this would be much more demoralizing, especially if we have to repeat it several times. Should the situation remain unchanged, then we can say back home in the Netherlands that we were ready but unable to do anything. We are now supporting the Ivanov group. They will have to work for us. Looking at it this way, we have made pretty good progress in the ten days that we have been underway: the search for Barents’ grave was landed and we were able to investigate the west coast. We are still working towards our schedule. By midway next week, that will be different.” “Then we will be working off our schedule, I think,” Bas grinned.

“Any questions?” No questions. We discussed the possibility of landing a small team the next morning: Jerzy, two Russians, Herre Wynia, and me. At least, we could investigate what triggered the metal detector. Even though we were anchored offshore of Novaya Zemlya, our destination seemed farther away than ever. No one would say so out loud, at this stage, but I could not exclude the possibility that we would fail to reach the Saved House.

With Kiriev still lying at anchor in rough Inostrantsev Bay, engines shut off, I gazed at the walls of ice, black rock formations, and inert blue icebergs. An eerie pewter-grey overcast surrounded us. There was no sign of life: the vast bay appeared frozen in time. I shared a weird concoction with Herre, Vadim Starkov, and Victor Dershawin, who brought it with him. A genuine Che Guevara poster decorates the wall of Herre and Victor’s hot cabin. The pungent odor of perspiration, garlic, and booze is made bearable only by Herre’s constant stream of rolled cigarettes. Jerzy came down earlier and told us that a strong cyclone is approaching and we must wait for it to pass: perhaps three days. We accepted his announcement without any reaction. Later on, lying pensively in my berth and feeling tired and not too good, I heard the anchor chain rattle throughout the vessel as it was being hauled in. “They’re hoisting the anchor,” I said to myself, sitting up. “What are they up to now?” I looked into the cabin across the hallway. Starkov shook his head, saying in halting German that it couldn’t be the anchor. Yet within a short time, the ship was buzzing with activity and the engine started. The vessel had awakened!

The decks were vibrating again. The hydraulic system was pressurized, and water fell clattering along the decks. The Captain’s commands echoed through the corridors and sailors ran to duty. I stowed such loose items as drinking glasses, clothing, pens, books, and cassette tapes, and then  hurried topside. As Kiriev began to move, a blackish sky hung over the clear-white dome of the ice cap. It was beautiful with that light blue sea. The wind was blowing past the ship as if sucked from a northerly direction. I learned that forecasts from three weather stations had differed, leaving a “window of opportunity.” Jerzy, Boyarsky, and the Captain decided that it was all or nothing now and shook hands for success. We can outrace the depression and will not waste one moment more. The course around north Novaya Zemlya will take approximately eight hours. It is 10:15 p.m. In the middle of the night, we will sail past Ivanov Bay.


Sunday, 27 August 1995 – Six o’clock in the morning and awakened by the sun, which shone in my face through the porthole. A calm sea, and the ship was slicing through it at high speed toward the south. Not a cloud in the sky. The landscape of northeast Novaya Zemlya showed as a vast, light-brown expanse, slightly undulating and molded by glaciers. There was hardly any snow. The ice cap, some twenty kilometers inland, was undistinguishable through the haze on the horizon. Nothing could stop us now. I couldn’t keep still and moved around excitedly as Kiriev decreased speed. 8:00 a.m. The vessel on which we left Archangelsk dropped anchor in the wide semicircular bay christened “Ice Harbor” 400 years ago. Cape Spory Navolok is a low and virtually flat headland.

The calm sea sloshed against a narrow, icy edge along the shore. Feverishly, we gathered crates, boxes, our instruments, and backpacks on deck. “I told you!” said Jerzy proudly. “When the action comes, it comes fast!” Then, the first man climbed down the rope ladder into the plashkot. Boyarsky at the railing blessed everyone going overboard with a good-luck kiss. “Dawai!, he called out hoarsely, “Dawai!”: Let’s go, let’s go!

“Just focus on Jerzy!” Anton yelled out to his cameraman, his voice breaking, as the plashkot drifted away from Kiriev. Hands shaking, I fastened the Dutch banner and the blue Russian Navy cross with duct tape to a red-and-white surveying pole. As we gathered speed and slid across the water, the banners unfurled and flapped in the wind. The ship’s crew applauded and waved goodbye with raised fists. The high door of the landing craft limits sight, so I could not gauge our progress. I asked Hans Bonke, who was here two years ago, how wide the beach is and if it is easy to climb the plateau. “You just walk right up to it,” he said. Suddenly, the shore loomed up close. Kravchenko’s cross showed thin, in sharp contrast to the clear sky. Carefully, the fully loaded landing craft wended its way across the shoals. Fifty meters to the beach.

The promontory’s beach is an undulating field of dull brown gravels, about 150 meters wide and slightly inclined toward a low rocky cliff that blocks the view inland. The tide line was a few meters away when the craft almost came to a halt to keep from running aground. Seconds were passing like cold syrup through a funnel. Then we heard the crunch of steel on rocks. Jerzy and I jumped into the surf, and I made my way across the beach. “This is it,” I said to myself, “this is it.”

I came ashore at Cape Spory Navolok on 27 August 1995, at 10:00 in the morning. There are shouts behind my back and sounds of excitement, with the gentle swash of the sea on the beach gravels. I feel very comfortable now that we have made it this far. I took in the surroundings for a few moments while the expedition’s cargo stacked up along the high-tide line. Then, with my heart in my throat, I headed for the rocks. I could barely make headway strapped into the life vest and heavy boots. Gasping for breath, I struggled against the escarpment. As soon as I could peer over the edge, I searched the flat, grey terrain for polar bears. The landscape was empty. The beams of the Saved House didn’t catch my eye directly. Behind the cross, now really just in front of me, stretched a field of small wooden spikes. This is the grid that was left behind after the excavations of 1993. In the far distance, the hills of Novaya Zemlya shone in the weak sunlight. Along the tide line, the landing craft was hastily being unloaded. Very much content, I walked back, freeing myself of the life vest along the way. We made it after all.

About the author:
JaapJan Zeeberg (Rotterdam, 1967) is a physical geographer with a Ph.D. from the University of Illinois at Chicago (2001). He studied the effects of climate on coasts and landscapes. After moving to the United States in 1996 he carried on with glacial-geological expeditions to Novaya Zemlya in 1998 and 2000. Zeeberg also participated in the search for remains of  ‘Liefde’ in the Strait of Magellan (Chile, January 1998). His latest expedition was a five person U.S.-Russian-Swedish survey of the interior of October Revolution Island, Severnaya Zemlya (August 2003). Currently with the Netherlands Institute for Fisheries Research.

JaapJan Zeeberg – Into the Ice Sea – Barents’ wintering on Novaya Zemlya: A Renaissance voyage of discovery
Rozenberg Publishers, Amsterdam, 2005. ISBN 978 90 5170 926 1


The Innovation of Population Forecasting Methodology in the Inter-war Period: The Case of the Netherlands

4.1 Introduction
The foundations of the model of population dynamics that was to dominate population forecasting methodology throughout the greater part of the 20th century were laid by the English economist Edwin Cannan (1861-1935). By the end of the 1930s, it had become the new standard model for forecasting national populations. After the Second World War, the model became known as the Cohort-Component Projection Model (CCPM).[i]
However, this does not mean that the introduction and general acceptation of the new methodology was a matter of veni, vidi, vici. On the contrary, almost three decades passed between its emergence in 1895 and its reinvention and general application for national population forecasting purposes in the mid-1920s.

Dutch innovators of population forecasting methodology were among the front-runners in the reinvention of the CCPM approach in the inter-war period. This contribution focuses on the nature of their contribution from an international perspective. First, we discuss the contributions of two international pioneers of CCPM forecasting, Edwin Cannan (1895) and Harald Westergaard (1908). Next, the focus is on the almost simultaneous re-emergence of forecast of national populations along CCPM lines. Was the general acceptance of the new approach to population forecasting a question of reinvention? If not, to what extent did the innovators of the 1920s build on the foundations laid by Cannan and Westergaard? This question is discussed in depth by focusing on the process of innovating population forecasting methodology in one particular country, viz. the Netherlands. The innovative nature of the respective contributions of the Dutch pioneers is assessed by means of, for example, a discussion of the forecasting culture in which they worked. Finally, the focus shifts to a discussion of how CCPM methodology was made suitable for urban forecasting and planning in the Netherlands in the course of the 1930s.

4.2 The pioneers of CCPM forecasting
Cannan was the first to introduce a cohort and age structure approach, relating past and future numbers of births to the (changing) age structure and the size of the fertile cohort groups in it. Cannan visualized his new approach with an appealing and much talked about age-period-cohort diagram (Cannan, 1895). The central element of CCPM is the cohort survival approach, which stems from the life-table, which already in 1895 was an elaborated instrument of demographic analysis.
At the time of its emergence, the dominant calculation model in the study of future population size was the geometric approach based on a constant rate of total population growth. Cannan’s cohort approach is based on a comparative state analysis of successive population censuses (ten-year age groups by ten-year intervals) and the extrapolation of a time series of ‘survival in England and Wales’ proportions calculated by relating the observed number of persons in ten-year cohort groups in successive population censuses. These ‘survival in England and Wales’ proportions are not actually pure cohort survival rates but combined cohort survival and emigration surplus proportions of 10-year age groups in 10-year intervals. With respect to fertility, Cannan started from the assumption that the future number of births would remain constant in the years to come. The plausibility of this assumption was based on the expected future numbers of women in the fertile age period.
In terms of a good understanding of the future consequences of past and present population dynamics, Cannan’s contribution was far-reaching: the plausibility of a future cessation of population growth rested on quantitative demographic-analytic argument. By means of the age (cohort) factor, Cannan was able to predict that a cessation of population growth and, eventually, even a decline was at hand; this would not occur as a result of war, epidemic or starvation, as many post-Malthusians believed, but occur in a non-violent way, viz. through demographic evolution. Cannan’s paper was part of a growing awareness and concern, and it appeared just before the flood of neo-Malthusian and eugenicist publications (including those by Galton and Pearson) on the subject of the consequences of the declining rates of population growth and of social-class-specific birth rates (Kreager, in this volume, chapter 5).[ii]

Twelve years later (i.e. in 1907), the Danish statistician and political economist Harald Westergaard astonished an audience of fellow members of the International Statistical Institute (ISI) when, during his opening address at the Copenhagen Session, he presented a practical application of CCPM-like theory in his ‘horoscope of the population in the 20th century’ (Westergaard, 1908). He demonstrated a masterly application of his knowledge of the effects of the interaction of population structure and change factors in population dynamics and a good understanding of the future direction of the pattern of fertility decrease.

Starting from the assumption of differences in pace of fertility decrease between European nations, Westergaard pictured in a purely qualitative way the consequences of demographic transition the countries of Europe were going to experience, in terms of both the ageing of the active population and the composition of the migration flows from Europe to the United States.
Westergaard’s demographic future was presented as a speculation (as is clear from the use of the word ‘horoscope’). His qualitative future can best be seen as a scenario of future demographic development. It is not surprising that he stressed its speculative character, considering he presented his paper to an international forum of pre-eminent statisticians and directors of national and municipal statistical offices. At the time, official statisticians in many countries held the opinion that statistical offices should stick to the facts, and not busy themselves with such speculative activities as forecasts (De Gans, 1999).
The prophetic quality of Westergaard’s endeavour is striking. His scenario was based on an intelligent and creative analysis of vital statistical data for Denmark, sound analytic-demographic reasoning and a thorough knowledge of the theory of life-table populations, and he demonstrated a clear insight into the dynamics of population change, caused by the interaction of population structure and the components of population growth.

Westergaard started with an overview of mortality and fertility trends. From an analysis of Danish statistical data on the fertility of marriages with duration of 10-15 years, he concluded that the practice of birth limitation had already gained momentum and would continue at a rapid pace. According to Westergaard, contemporary statisticians agreed that the decrease in mortality rates was structural and could not be interpreted as a momentary perturbation finding expression in a typical life-table. The immediate result of mortality decrease had been a growth of population in all Western nations such as had not been dreamed of in former centuries. Mortality decrease had led to a population explosion in the Anglo-Saxon world in the second half of the 19th century and consequently to a considerable change in the ‘balance sheet of nations’, because of pace differences between countries.
The decrease in mortality was followed by a decrease in fertility that started at the end of the 19th century. A reduction in the birth rate was occurring everywhere. Marked differences were caused mainly by differences of temporality: some countries had retained high birth rates somewhat longer than other countries had, France being the only exception. In France, a remarkable decrease had started around the end of the 18th century and had resulted in almost stationary population growth by the end of the 19th century because the increase in life expectancy had not kept pace with the decrease in fertility.

At the end of the 19th century, net fertility had been highest in the upper classes of society in spite of a lower birth rate than in the working classes, because the upper classes had a lower infant mortality. But this was changing rapidly.
At the beginning of the 20th century, differences in infant mortality (e.g. in Denmark) no longer compensated for differences in fertility between the social classes. From his own analysis of Danish statistics, Westergaard had established that a fertility decrease was occurring in all social classes. He assumed that a similar development would take place in all European countries.
Westergaard predicted future shifts in the balance of nations from the differences observed in the pace of the transition of mortality and fertility rates: ‘Just as the Anglo-Saxon race increased in numbers during the nineteenth century, so we may in the future observe a quick increase of the Russians and Poles until also this movement comes to an end‘  (Westergaard, 1908, p. 110). These shifts would cause significant new changes in the balance of nations, and particularly America would bear the consequences. In the past, America had been able to assimilate an influx of millions of mainly English-speaking immigrants who had proceeded to build a new English-speaking nation. Assimilation in the future would be more difficult if immigration were to alter its character, with the majority of newcomers coming from, for example, Russia or Italy.
Westergaard cautioned against the views of those who consoled themselves with the expectation that the end of the transition process would see a return to old times: ‘… we shall not have the age distributions of former days, population will have an entirely different appearance, with its big numbers of old people and its relatively small numbers of young persons‘ (Westergaard, 1908, 114).

The change of the age structure would have enormous effects. The burden of bringing up a child would be lessened, because more adults per child would be available to carry this burden. On the other hand, everywhere in the active population, ‘… in offices and shops, the number of apprentices and juvenile clerks and assistants will be on the decrease, whereas grey-haired officials will be more abundant. And if it is true that all new ideas are born in young brains, then this difference of age distribution is identical with a serious loss for the future population‘ (Westergaard, 1908, 113).
Westergaard’s ‘horoscope’ of the population provides, in a comprehensive and highly evocative way, the earliest picture of the demographic transition of Europe in the 20th century.[iii]

4.3 CCPM forecasting in the 1920s: continuity or reinvention?
The effect of Cannan’s and of Westergaard’s endeavours was not such that current forecasting practice was immediately replaced. On the contrary, forecasting along the traditional line of future extrapolations based on the arithmetical or geometrical growth of total population size continued to be the standard practice for quite a long time. It is interesting to note, for instance, that they are not mentioned in Walter F. Willcox’s overview of the best method of estimating the population of the United States, which was published in 1925. This is rather surprising, for Willcox must have had ample knowledge of contemporary population forecasting methodology: he had been chairman of a committee that had recommended the method of arithmetical progression for the United States Census Bureau’s population estimates in 1906, and in 1925 he chaired a committee that had been asked to review the issue of the best way of forecasting the population of the United States (Willcox, 1925, p. 27, f.n. 1). Willcox does not refer to the new methodological developments triggered by Edwin Cannan, or to the logistic growth approach that had been introduced in the United States by Raymond Pearl in 1920, methods that were heavely debated in the first part of the 1920s (De Gans, 2002).

Willcox distinguished three different methods. The first was based on the assumption of arithmetical growth of the total population, and the second on the assumption of geometrical population increase (also termed the natural growth of the population). The third was a component approach, based on the measure of the balance of births and deaths and of immigration and emigration. The use of the geometrical growth model, furnished to the United States by England, was declined.[iv]
In the words of Willcox: ‘No theoretical defense of the method of geometrical increase is convincing. That method, like any other, must be defended and justified not on grounds of theory but because its results agree with the enumerations more closely than do the results of any alternative method‘ (Willcox, 1925, p. 28).
Compared to what, for instance, the German town planner R. Baumeister had taught his students as early as 1876, there was no innovative element in the overview drawn up by Willcox and his committee (Baumeister, 1876; De Gans, 2002).
Either Willcox had no information on developments outside the USA or he saw the new approaches to population forecasting as being of no use to the United States. Whatever the reason, it is remarkable that the new forecasting method was not discussed by his committee, because population forecasting along CCPM-like lines had made a fresh start since the First World War. About twenty years after Cannan’s forecast, CCPM-like forecasting was performed in many different countries almost simultaneously. In 1925 – the year of Willcox’s overview – several forecasts had already been made and many more were to come: in Austria (Wilhelm Winkler, 1919), the Soviet Union (Strumilin, 1922), England (Bowley, 1924), the Netherlands (Oly, 1924; Wiebols, 1925; ‘t Hooft, 1926/1927), Sweden (Cramér, 1925), the USA (Lotka, 1925; Whelpton, 1928), Norway (Jahn, 1926), Sweden (Wicksel, 1926), Italy (Gini, 1926), Germany (Statistisches Reichsamt, 1926; 1928), Italy (Vinci, 1927) and France (Alfred Sauvy, 1928).[v]

It has not yet been fully researched to what extent the above-mentioned forecasts should be seen as independent reinventions or as elaborations inspired by Cannan, nor whether – and if so, to what extent – the population forecasters of the 1920s influenced each other in modelling population dynamics.
In Bowley’s case, the source of inspiration is clear: there is a direct line from Cannan’s forecast of 1895 to Bowley’s of 1924. As a student at the London School of Economy and Political Science, Bowley had been inspired by the forecast made by Edwin Cannan, who was teaching there. Later, Cannan and Bowley had become colleagues at the same institution. In his own lectures, Bowley made frequent use of Cannan’s diagram (Bowley, 1935). However, Bowley improved Cannan’s model in one significant aspect: instead of working with synthetic rates of survival in England and Wales, derived from comparative numbers of persons present in ten-year age groups of successive population censuses, as Cannan did, Bowley introduced rates of survival of five-year age groups derived from the life-table.
At the other end of the spectrum there is the Austrian statistician Wilhelm Winkler (1884-1984), who in 1933 claimed to have been the first (in 1919) to make a forecast of the future population size and age structure based on the age structure at a specific point in time and on assumptions with respect to the elements of population change (births, deaths, migrants) in an attempt to clarify the future effects of the casualties of the Great War (Pinwinkler, 2003, 100).[vi]

The extent to which Winkler really worked along CCPM lines remains unclear: we have no description of the precise calculation model he employed, merely a general methodological description. This goes as follows. The quantitative losses caused by the Great War are fourfold:
(1) losses of ablebodied men caused by actions of war (wounding; illness);
(2) losses among the general population caused by an increased level of mortality during the war;
(3) loss of births during the war caused by the absence of men;
(4) loss of births after the war caused by the deaths of men in the fertile age groups.
Winkler had taken as an example the future number of births and the future development of the total population of France from 1910 and 1918 (by five-year age groups and five-year intervals of time on the assumption of constant numbers of births, deaths and migrants) (Winkler, 1919, 60-64).

The focus in the following sections is on the innovation of population forecasting along CCPM-like lines by forecasters in one specific country, the Netherlands.
The issues examined are what they contributed, how innovative their contributions were from an international perspective, and whether they influenced or were inspired by others, and if so, who these others were.

4.4 Dutch contributions to the innovation of CCPM forecasting
In the Netherlands, component forecasting and cohort component forecasting gained a solid foothold soon after their first appearance after the First World War. Internationally a method debate was going on between the proponents of the demographic CCPM forecasting method (Bowley, Fisher) and the proponents of the logistic method (Pearl, Yule).[vii]
At the same time, a method debate was raging also in the Netherlands, but here it was between proponents of two different demographic approaches, the ‘Wiebols method’ and the ”t Hooft method’, which have in common the cohort survival element. The debate contributed greatly to the spread of knowledge of forecasting methodology among those who were interested in the future population size in general and the best way to calculate this in particular (De Gans, 1999).

The context of the Wiebols-‘t Hooft controversy was a debate on the population issue in the Netherlands. The debate started in 1922 and continued throughout the 1920s and 1930s. Initially, the issue was the consequences of a continuation of the continuing high rate of population growth in the Netherlands since the First World War under grim economic conditions and prospects. Basically the population debate was between the advocates and the opponents of neo-Malthusianism, each side being represented by one of the leaders of the Dutch statistical establishment of that period: the pro-natalist H.W. Methorst (1868-1955) – who was the head of both the Central Statistical Bureau of the Netherlands (now Netherlands Statistics) and the Statistical Office of the International Statistical Institute (ISI) in the Hague – and the neo-Malthusian C.A. Verrijn Stuart (1865-1948), who had been Methorst’s predecessor in both the offices mentioned.
Methorst argued that there was no urgent need for neo-Malthusianism because in due time the rate of population growth would slow down. His argument cwas founded on, among other things, a diagram in which the time series of the observed crude birth and death rates were graphically extrapolated.[viii]

Ultimately, so Methorst reasoned, the ongoing decrease in the birth rate which could be observed in the Netherlands too, would result in the ageing of the population and, therefore, in an increase in the death rate and, consequently, in the decrease in the growth rate of the population. Verrijn Stuart followed a different line of reasoning. In his view it was necessary to actively reduce fertility, because if the growth continued to be as high as it had been in the past years, future population growth would end in disaster. He illustrated his argument by using an extrapolation of the future of the population of the Netherlands based on a long-term geometrical progression calculation.[ix]
Because of the pro and anti neo-Malthusianism controversy, argument in the population debate was often based on emotion rather than on sound, objective reasoning. Many felt the need for a better understanding of population dynamics and of the demographic processes that were going on. This led A.O. Holwerda (1887-1944) – an actuary and one of the few representatives of the English school of mathematical statistics in the Netherlands at that time – to state that the statistician should be counselled on the relevant questions at stake. Methorst, so Holwerda said at the Annual Meeting of the Dutch Society of Political Science and Statistics in 1922 (during which the Dutch population issue was put on the agenda for the first time), had shown what was possible if statistical data were used in a correct and useful way. The population issue could not be discussed without an objective study based on adequate statistics, namely age and sex specific sets of what would be called now occurrence/exposure rates of mortality, legitimate and illegitimate fertility, nuptiality, and so on. First, these sets of transition rates had to be constructed. Next the development over time of each of these sets should be studied in order to gain a good understanding of the future course of population growth (VSS, 1922).

The debate at the Annual Meeting on the future size of the population of the Netherlands and its consequences led another actuary, Joh. C. Oly (1924), to bring his life-table expertise into play. In international historical overviews of population forecasting literature, Bowley’s 1924 forecast is often seen as the true beginning of modern forecasting. Oly’s forecast, which was published in the same year, is not mentioned in international overviews, nor are any of the innovative Dutch achievements in population forecasting during the inter-war period. But, as we shall see below, Oly’s approach can easily stand comparison with that of Bowley.
Both Bowley and Oly started from life-table population theory and from life-table probabilities of survival. This was an innovation in comparison with Cannan’s forecast of 1895, as was the distinction between the male and the female population.
With respect to fertility, both Bowley and Oly used constant future numbers of births and constant survival rates. That, however, is where the similarity between the two approaches ends. Because of the fear of the consequences of overpopulation that was at the heart of the Dutch population debate, he also calculated another, minimum variant. This variant was as realistic as possible given the current state of the art. He used dynamic (i.e. decreasing) birth rates (a decrease from 26 to 18 pro mil in 40 years) (Oly, 1924). By making two calculations based on two different sets of assumptions with respect to fertility, Oly tried to gain an insight into the range of the future population size. In doing so, he was the first in the Netherlands to calculate alternative demographic futures.

The unsound reasoning of many participants in the neo-Malthusian population debate (neo-Malthusians vs. anti-Malthusians), as exposed in quite a few of the publications on the subject, induced a complete outsider to join the debate: F.W. ‘t Hooft (1896-1941), who was an engineer rather than a statistician or an economist. This man had all the strengths and weaknesses of the intelligent, self-educated person in the field, combining originality with a stubborn adherence to a convincing but inaccurate model of population dynamics (his ‘conveyor belt’ allegory). He developed the tunnel vision of an amateur and outsider debating with representatives from the field of experts and insiders with respect to the truth of his model of population dynamics in terms of his conveyor belt theory. This, however, led him and many others astray.[x]

The allegory goes as follows. The dynamics of population growth is a process similar to that occurring on a conveyor belt. Granules (births) are put on one end of the belt. Some of these granules disappear during their transport on the belt (deaths at a young age) and some fall off at the end of the belt (deaths at the end of the ‘natural lifespan’). He then substituted this model of population growth for another one: a conveyor belt with a length equal to that of the average lifespan of the deceased. Now the granules put on one end of the belt will fall off simultaneously at the other end. The size of the population in the substitute model is equal to the product of the number of births and the average age at the time of death (not to be confused with the average life expectancy at birth, or with the average age of the population).
If the length of the conveyor belt is increased – that is to say, if the average lifespan of the deceased increases – then the belt can accommodate more granules at the same time. The population therefore increases, but merely as a result of the temporary lengthening of the average lifespan. In time, however, the balance will be restored, after which the population size will be again the result of the product of the new average lifespan of the deceased and the (constant) number of births (‘t Hooft, 1926).

‘t Hooft firmly believed that population growth would come to an end in the near future because the birth rate would follow the death rate. In this respect he was in line with the ideas of Jacques Bertillon and other French demographers, though it is not clear whether he was familiar with their writings. In 1903, Bertillon had formulated his ‘well-known law of the parallelism of the movements of population’.[xi]
This law says that, in general, the levels of both natality and mortality are high in the same countries, and both are low in the same countries. In other words, if mortality is high in a certain country, its natality is high as well; and vice versa, if mortality is weak (‘faible‘), natality is weak too (Bertillon, 1903, p. 1). Because ‘t Hooft focussed so much on the lengthening of the average lifespan of the deceased as the main contributor to population growth, he tended to neglect the effect of fertility and that of the age structure of the female population. In fact, his theory held only under the condition of a strictly stationary population (in stable population theory).

As a consequence of his focus on the development of mortality, ‘t Hooft was the first to introduce (in 1927) the cohort approach into population forecasting based on generation life-tables; his approach was slightly more sophisticated than that of Cannan in 1895 (‘t Hooft, 1927). Above all, he did not refrain from provoking the community of Dutch population experts into a debate about the method of population forecasting during the greater part of the interwar period. In this way he contributed to the dissemination of knowledge of and insight into the analytical demographic backgrounds of population dynamics and demographic forecasting. He also forced the participants to reflect upon the respective merits of his approach and that of Wiebols.
‘t Hooft’s cohort approach was considered by many of his contemporaries to be of equal standing to that of Holwerda’s PhD student G.A.H. Wiebols (1895-1960). However, in the end Wiebols’ contribution to the development of population forecasting along CCPM lines in the Netherlands proved to be the most sustainable of the two: in the early 1930s, town planners working on the socioeconomic and demographic foundations of the 1935 General Extension Plan for Amsterdam demonstrated that the migration factor could easily be integrated into the Wiebols model.

Presumably, it was Holwerda who persuaded the economist Wiebols to write a PhD thesis on the subject of the future size of the population of the Netherlands, focussing in general on the methodological aspects of such a forecast, and in particular on the added value of working with kanssystemen (‘probability systems’, i.e. sets of age-sex-specific occurrence/exposure rates). Wiebols’ endeavour resulted in a clear and, from a methodological point of view, highly transparent demographic forecast, starting from age-sex structure (females only), dynamic (increasing) age-sex probabilities of survival derived from lifetables, and a dynamic (decreasing) general fertility rate. Much to his dissatisfaction, Wiebols had to make do with the general fertility rate instead of agespecific fertility rates because of the lack of sufficient statistical data. Wiebols was the first person in the Netherlands to build on the views of the Berlin statistician R. Böckh and those of Böckh’s former student Rahts regarding the population’s level of replacement (later called ‘net reproduction’) in order to convince the statistical offices (and the government of the Netherlands) of the need to work with age-specific fertility rates in population forecasting instead of general fertility rates, and thus incite them to collect the necessary statistical data regarding fertility (Wiebols, 1925, 38-42).[xii]

As was the case with almost all forecasts of European populations, Wiebols excluded international migration. He had good reasons to do so because of the societal setting of his calculations. Like Oly he was interested in the maximum size of the future population. Inter-war forecasters could not have foreseen that one day the Netherlands would have an immigration surplus. Neglecting international migration, therefore, meant neglecting an emigration surplus and therefore calculating a maximum future population. However, both in his book (Wiebols, 1925, 110-127) and in two letters to J.H. van Zanten, director of the Amsterdam Bureau of Statistics (Amsterdams Bureau van Statistiek) – who wanted to know what kind of statistical data his Bureau should collect in order to allow for the calculation of a population forecast for the municipality of Amsterdam – Wiebols presented a theoretical but highly sophisticated model of how to apply the new forecasting methodology at the municipal level, with the inclusion of migration and age-specific rates by marital state (De Gans, 1999, 25-28).

4.5 A culture of creative-practice-oriented, no-nonsense forecasting
It has not been possible to link, either directly or indirectly, the innovations in Dutch population forecasting methodology brought about by Oly, ‘t Hooft and Wiebols to the contributions of the international pioneers of CCPM forecasting methodology, viz. Cannan, Westergaard and Lotka. The main Dutch statisticians of the period – C.A. Verrijn Stuart and Methorst – were familiar with Westergaard’s ‘horoscope of the population of Europe’. Although Verrijn Stuart was clearly impressed by this ‘extremely suggestive’ picture of the future of Europe’s population, initially he dismissed it because of its speculative nature (Verrijn Stuart, 1910, 286-287; De Gans, 1999, 79-80).

It is likely that the Dutch pioneers reinvented the new methodology independently of their international predecessors.13 Dutch actuaries like Oly and Holwerda were part of a long national tradition of life-table construction. Knowledge of life-table methodology was highly developed in the Netherlands. Moreover, if one looks at the methodological state of the art of population forecasting in the Netherlands prior to Oly and Wiebols, as represented in a few published estimates and forecasts in the period immediately preceding the mid-1920s, one gets the impression of a culture wherein practical men were looking for practical solutions to everyday problems related to the future development of the population, the future number of households and the current and future housing need, and were using a lot of methodological ingenuity.
Some of these solutions resulted from problems faced by municipalities as a result of the 1901 Housing Act. This act can be seen as the formal beginning of urban and regional population forecasting and physical planning in the Netherlands. It established the close link between population forecasting, housing and town planning – that is, between the sciences of urban and regional planning and demography – that became characteristic of the Netherlands in the 1950s, 1960s and 1970s: under the Housing Act, municipalities with ten thousand inhabitants or more and municipalities which had seen a population growth of 20% or more in the past five years, were obliged to make urban extension plans.

The Housing Act became the legal basis of official housing policy. The municipalities were given the authority to improve housing conditions. They therefore needed a better insight into the kind and extent of housing demand and housing shortage and the development of housing need. This means that forecasts of future population, housing and extension plans were directly linked. This resulted in a growing interest among town planners in the development of good estimation methods. In the following decades, forecasting future population and future housing need became the core of preliminary town planning research – the precursor of modern urban planning.

Initially, the first decades of the 20th century saw a debate between proponents of different schools of town planning, namely the utilitarian school (mainly military and civil engineers) and the ‘city beautiful’ school (mainly architects). The former school had been responsible for town planning in the nineteenth century and was blamed for making the ugly town-extension plans that characterized the late 19th century urban housing districts. The debate had wound up at the beginning of the First World War in favour of the architects. From the point of view of the development of urban population forecasting methodology, this was a pity because while the architects were interested primarily in design, some of the town planning engineers – especially J.H.E. Rückert – were also interested in preliminary town planning research as a necessary condition for good urban planning.
Preliminary town planning research started to flourish in the Netherlands with the emergence of town planning as an independent profession in the First World War era. The new discipline was taught at Delft Technological University. The first generation of modern, university-trained town planners was influenced by the examples in German manuals of town building and town planning, dating from the last decades of the 19th century, particularly that of Baumeister (1876) and that of Stübben (1890). In these manuals it was advised to make traffic surveys, population forecasts (based on geometrical population growth methodology), studies of housing need and the need for recreation areas and industrial parks before embarking on the actual business of town planning.

In the mid-1920s, British rather German influences started to manifest themselves in the Netherlands through Patrick Geddes’ doctrine of ‘survey before plan’. These new influences reinforced the effect of the earlier German influences. It was the Amsterdam conference of the International Garden Cities and Town Planning Association in 1924 that familiarised the Dutch with the doctrine, propagated by Abercrombie and Unwin, and helped the idea of regional planning to mature among policy makers (Faludi & Van der Valk, 1994).
The first to put the new principles of preliminary town planning research into practice was the military engineer Rückert, director of Tilburg’s Public Works department (Rückert, 1917). He drew his inspiration primarily from German town planners. In the following decade, his preliminary town planning research report on the General Extension Plan for Tilburg – which contains a thorough and well founded demographic analysis and extrapolation of future population growth (though with traditional methodology) – became exemplary, although it had found little support in the 1920s.

4.6 A promise of new developments: Rückert’s forecast for Tilburg (1917)
That demographic forecasting in general and CCPM forecasting in particular were to become the new standard approaches in population forecasting methodology in the Netherlands in the inter-war period, could not have been predicted from pre-war history. But the harbinger of the new development was already present in a number of cases of well founded geometrical population growth forecasts made at the end of the First World War.
If Rückert had merely acted in line with Baumeister and Stübben – his German sources of inspiration – he would have started from the premise that a general extension plan had to provide for a population twice the size of the present one. By dividing this number by the figure of the average density per hectare of the existing built-up area of Tilburg, the required plan area could easily have been calculated. Instead, Rückert preferred to use a different approach.

First, he started from a different average population density figure, which was in conformity with the current norm. Next, in order to check his results, he calculated the population size that would result from dividing the total number of running metres of frontage in the extension plan by the average frontage (in metres) per habitant in the existing built-up area, and saw that the resulting population size was close to that obtained by the first method. Finally, he used the geometrical population growth rate approach to calculate how long it would take for the size of Tilburg to double and for the planned town extension capacity to be attained.

The average annual growth rate of the future population was determined by analysing the observed population growth rates of the periods 1879-1909, 1899-1909 and 1909-1914. He checked the plausibility of the assumed future average annual growth rate of Tilburg by analysing the observed annual birth and death rates, the natural growth rates, the crude nuptiality rates and the absolute natural and total population growth of Tilburg in the last ‘normal’ (pre-war) period, viz. 1890-1914. From this analysis of the observed time series, he concluded that natural growth rather than an immigration surplus had brought about the population increase Tilburg had seen in the period under consideration. Basing himself on various factors (e.g. the construction of a new shipping canal and the alleviation of the housing shortage), he expected an improvement in the economic conditions of Tilburg and hence an increase in immigration. Because of their young average age, he expected the future migrants to have a positive effect on the birth rate and concluded that his figures should to be taken as a minimum forecast.
In his use of orthodox geometrical population growth theory, Rückert’s actual population forecast is traditional. But it was demographic in the way he made assumptions. Like Baumeister (1876), Rückert did not believe in a law of geometrical population growth, although he had no choice but to use the geometrical growth method. He was convinced that the deduction of future developments from past ones does not provide a solid standard; the rates in the future may be very different from the ones calculated.
The novelty lies in the prudence of its application: time and again Rückert looked for feasible arguments and ways to check his calculations. He was inventive, and although not an innovator of forecasting methodology itself, he was exemplary in his search for a solid foundation for his assumptions within a wider socio-economic context.

4.7 Structural housing shortage? Rooy and the calculation of the future housing need (1920; 1921)
Another example of the promise of the new development in population forecasting is the forecasts of the national population made by Rooy in 1920, and again in 1921 (Rooy, 1920; 1921). His calculations are of particular interest because they concerned a key issue in post-First World War Dutch society: the housing shortage.
The housing shortage was seen as a serious problem, and it incited public concern. While the policy of the Minister of Labour, who was responsible for housing, was founded on the conviction that the housing shortage problem would soon be solved, critics, like Rooy, thought otherwise: they were of the opinion that the existing housing shortage had a structural dimension. Rooy provided them with quantitative arguments based on the analysis and forecast of the determining factors of the housing shortage. He warned against the dangers of underestimating future housing demand and blamed the government for not taking sufficient account of such factors as the negative effect of the eight-hour working day on housing production, and the effects of the increase in population and of the decrease in average household size on future housing demand.

The procedure Rooy employed was the following. First, he estimated the housing shortage in 1921. He did this by comparing the actual number of dwellings in 1920 and the calculated number on the basis of a linear extrapolation (from 1909 to 1920) of the decrease in the average dwelling occupation figure observed between the census of 1899 and that of 1909, with the population size in 1920. Next he had to take into account the backlog in the necessary replacement of obsolete houses since 1914 (the year the Great War began) and the necessary stock of uninhabited houses (estimated at 3% of the total housing stock). He found that seven years’ of housing production had been lost as a result of the First World War (in which the Netherlands did not participate).
Once the housing shortage in the baseline year for his population forecast had been assessed, Rooy proceeded to forecast the increase in the housing demand resulting from future population growth.
The first thing he had to do was estimate the growth of the population in the coming decades. He assumed that a future decrease in the birth rate would be more than compensated for by a future decrease in the death rate. This would result, he expected, in a continuation of population growth in the following two decades at the level of the ten-year growth rate observed in the past decade. Having an estimate of the size of the population in the baseline year 1920 (from the census) and having assessed the ten-year growth rate of the population in the decades to come, he could calculate the future size of the population.

Next, he had to make assumptions about the proportion of persons not living in houses (which he kept constant at 3.3% of the total population), the decrease in the average dwelling occupation figure (which he assumed to decrease at 0.07% per decade) and the stock of uninhabited houses (which he set at 3% of the total housing stock). Moreover, obsolete houses had to be replaced, as had dwellings lost as a result of city formation.
Taking all these factors into account, he assessed the actual future housing demand. He came to the conclusion that on average about 55,000 houses would have to be built each year. With the means available at the time, a maximum of approximately 25,000 houses per year could be built. Rooy therefore came to the disconcerting conclusion that the required annual production would fall short by 30,000 houses and, therefore, that the housing shortage should be seen as a structural problem.[xiv]

Rooy calculated the future housing need in a simple, straightforward and pragmatic way. Basically, he merely used extrapolations of the average dwelling occupation figure and used the geometrical population growth method (with a growth rate of 16.6% per decade) to forecast future population size. The plausibility of this is sustained by demographic reasoning, deduced from observed and expected tendencies in the birth and death rates maintaining their balance.
The method is simple but efficient and satisfactory, given the task Rooy had set himself. The method is also a good example of a no-nonsense approach in applied (‘everyday’) population forecasting.[xv]

4.8 Rikkert and the ‘Halle method’ (1919) – or the shortcomings of extrapolating average dwelling occupation figures
Rooy did not refer to the fact that, a year earlier, an Amsterdam housing expert had severely criticised the use of extrapolated average dwelling occupation figures for forecasting purposes. The expert – Rikkert – based his criticism on the ‘Halle method’, which is the third example of intelligent applied forecasting to be discussed here.
The method was originally developed in the German town of Halle-am-Saale. It was applied for the first time in December 1905 and the results appeared in a publication by the Statistical Office of Halle, Die Leerwohnun-gen in Halle a.S., 1905-1911 (Heft 17, 1912. Halle: Gebauer-Schwetsche). It was introduced in Amsterdam in 1914 by the civil engineer J.C.W. Tellegen, who was director of the Department of Building and Housing Supervision. From the moment of its introduction, the Halle method was successfully applied in Amsterdam in the inter-war years and also became popular in other municipalities.
The merits and demerits of the method were amply discussed by housing experts in the inter-war years and again in the 1970s (De Gans, 1999, 162-168).
The method was developed for the accurate estimation of the annual changes in the number of households (families) in a municipality. Once the number of households was known, the number of households in need of a dwelling could be estimated and, by making a comparison with the municipal housing stock, so could the size of the current housing shortage.
By modern standards the Halle method was quite advanced: the process of family formation and dissolution was essentially modelled in terms of marital state transitions. The application of the method depends to a high degree on reliable, up-to-date statistics on marital state transitions. It is therefore interesting to see how the method was summarized by J.H. van Zanten, director of the Amsterdam Bureau of Statistics and a fervent advocate of the method.

According to Van Zanten, the statistical office in Halle investigated the conditions leading to the formation of new families (who would then need a new dwelling) and the disappearance of families (which would provide uninhabited dwellings). Generally speaking, immigration leads to the former and emigration and death to the latter, although not every wedding results in an increase in housing need, nor does death inevitably result in the vacating of a dwelling. The Bureau concluded that housing need increases with the marriage of unmarried people, the marriage between a divorced man and an unmarried woman, and the immigration of a family. Housing need decreases with the marriage of a widower and a widow, the marriage of a widower and a divorced woman, the death of a widower, widow or divorced woman, and the emigration of a family. Because the method was not one hundred percent accurate, checks and verifications against census data were necessary from time to time. Several factors lead to inaccuracies: not all marriages of unmarried persons increase the housing need, not all persons marrying a person from outside the municipality compete on the municipal housing market, and not all widowers/widows continue to occupy a dwelling after the death of their spouse. Moreover, cohabitation outside wedlock (concubinage, brothers and sisters, and unrelated persons living together) is a totally uncertain factor (Van Zanten, 1938, 356-358).

The Halle method allowed for an analysis of the process of family/household formation and dissolution on an annual basis and provided an insight into the true development of housing need. The method could also be applied retrospectively by calculating the development of the number of families/households needing a dwelling over the past period. With the Halle method, Rikkert – the housing statistician at Amsterdam’s Department of Housing – was able to demonstrate that the housing shortage in Amsterdam had increased considerably in the period 1909-1918. This conclusion differed considerably from what could be assumed from the course of development of the average dwelling occupation figure over the same period.
The shortfall was an important discovery. Rikkert made it clear that the average dwelling occupation figure depended on changes in the demographic factors of family formation and dissolution on the one hand, and changes in the housing stock on the other. Therefore the extrapolation of observed time series of the average dwelling occupation figure for forecasting purposes was based on unsound reasoning. Rikkert was the first to warn against the use of the average dwelling occupation figure as an independent instrument for the prediction of the future housing need (Rikkert, 1919; Van Fulpen, 1985).
The above examples provide an insight into the general forecasting culture, as it existed in the Netherlands at the time of the reinvention of CCPM methodology. It was a culture wherein men, who were interested in the issues at stake, applied a careful, creative and no-nonsense way of reasoning in order to develop methods for finding solutions to practical issues.
Because of the lack of references it is difficult to assess whether Rooy knew of the studies by Rückert and Rikkert. Rooy published his articles on calculating housing shortage and housing need in the monthly journal Economisch-Statistische Berichten, an authoritative journal in economics and statistics. Despite this, and rather surprisingly, there are no references to his population forecasts in the contributions of those who participated in the national debate about the population issue (Verrijn Stuart, Methorst, Oly, Wiebols, ‘t Hooft). It is hardly possible that these men were not familiar with Rooy’s publications.
The only plausible explanation is that Rooy was tackling a different issue and that it was thought that Rooy’s issue had nothing to do with the population issue they were discussing.

4.9 CCPM methodology made suitable for urban forecasting and planning
Wiebols applied for a job in the field of town planning, but in vein. It was not to be Wiebols who would apply the elaboration of his population forecasting schemes for urban forecasting purposes. Nor was it to be another economist, or a statistician or demographer. It was the members of a different profession who made CCPM forecasting suitable for all geographical levels (national, regional, urban) by integrating migration into the calculation schemes of the forecasting model.
In the elaborated and well founded 1932 population forecast for Amsterdam, which was made for the 1935 General Extension Plan for Amsterdam, the town planners and forecasters Van Lohuizen and Delfgaauw demonstrated that Wiebols’ approach could easily be applied to migration (Grondslagen, 1932). Also, they were the first to calculate age-specific headship rates (calculated from census data) and to apply these rates to the forecast age structure of the population, using the Halle method to check and correct these rates. This allowed a better insight to be gained into future housing than did working with average family size rates or average dwelling occupation figures, the use of which continued to be popular.

In his forecast for Rotterdam and the Rotterdam harbour area, the town planner Angenot (1934) combined the best of Wiebols’ methods – now using age-specific fertility rates for the first time in the Netherlands – and the best of ‘t Hooft’s (his generation life-table approach). Angenot was well aware that migration has a two-way impact on population development: firstly through mere numbers, and secondly because its age-specific character affects the fertile age categories and thus the number of births. He opted for a formal modelling approach, searching for arguments to simplify his calculations. Moreover, he was the first to introduce a matrix notation and a matrix mathematics approach to his calculations, separately for mortality/fertility and migration. His model was well ahead of but definitely not as elegant as Leslie’s matrix model of 1945.

The forecasts for Amsterdam and Rotterdam stand out because of their sophistication in terms of the further innovation of forecasting methodology. They, and many others, were explicitly made to serve town planning purposes. The forecast for Amsterdam, which was inspired by the socio-economic and demographic survey work in Rückert’s 1917 General Extension Plan for Tilburg, was considered to be the main building block of the 1935 General Extension Plan for Amsterdam. They were fine examples of how seriously preliminary town planning research was taken.
The conflicting plans of neighbouring municipalities as well as a growing awareness of the need to protect the valuable cultural-historical and natural landscapes of the Netherlands in the 1930s had resulted in a call for regional and metropolitan planning. Here again Van Lohuizen and Delfgaauw took the lead. Given the lack of sufficient statistical data on inter-regional migration, they demonstrated how a population forecast for a specific region could be derived from the national population forecast.

Another new development was the influx of geographers, socio-economists and sociologists in the field of preliminary town planning research. With extension planning booming, town planners were more interested in the actual designing process than in the necessary preliminary demographic and socio-economic town planning research. That task was left to geographers and other social scientists looking for jobs outside the teaching profession.
Van Lohuizen, Delfgaauw, Angenot and others demonstrated how migration could technically be integrated into the calculation schemes of Wiebols’ ‘demographic method’. However, they did not solve the problem of making assumptions about the future development of migration. In fact, the migration assumption part of their forecasts was rather primitive. In the eyes of the new professionals in preliminary town planning research – that is, geographers and economists – the demographic method was only second best to the preferred socio-economic method. In their view, a future labour market approach would be the best way to solve the problem of the unpredictability of future migration. Because of the time- and money-consuming complexity of this approach, the socio-economic method of population forecasting was not applied in practice, at least not in the 1930s. I have discussed the issue of demographic versus socio-economic forecasting more amply in my book on the history of population forecasting (De Gans, 1999).

4.10 Concluding remarks
Demographic statisticians and housing experts/town planners/demographers engaged in the quantitative study of the future of the population seem to have lived in separate worlds in the period prior to the Second World War. Those involved in the neo-Malthusian population issue debate appear not to have looked beyond the studies directly devoted to the population issue. On the other hand, urban and regional planners were not engaged in the study of the future size of population because of a mere academic interest in the population problem. To them, the demands of town planning practice were the starting point. These men were looking for practical solutions to the problems they encountered, merely judging and testing the practical application value of the methods at their disposal. For instance, they took no part in the debate about the Wiebols-‘t Hooft controversy in national population forecasting, but simply selected the best of each method.

Oly, Wiebols and ‘t Hooft published for a Dutch audience only. The Dutch demographic statisticians who knew of their work and who took part in international statistical and demographic organizations and conferences, Verrijn Stuart, Methorst and Van Zanten appear not to have been too interested in the international exchange of information on the methodological achievements in the field of ‘speculations’ about future population development in the Netherlands. On the contrary, Van Lohuizen, Delfgaauw and Angenot both had the opportunity and were eager to share information with colleagues from other countries. However, the exchange of information remained restricted to the international town planning forums. Information on innovative developments in demographic forecasting, applied in urban and regional planning in the 1930s, did not reach the international forums of statisticians and demographers.
In fact, the information hardly reached the international community of town planners either. Here, the fact that the propagators of preliminary town planning research had a minority position in the world of town planning was an impediment to the propagation of information about innovations at urban and regional levels. Most town planners were interested primarily in the design of the plans; their second concern was the way in which the plans were based on research (surveys). The specifics of the forecasting models underlying these foundations seem to have been the least of their concerns.
—-
NOTES
i. The main elements of CCPM, as it was developed in the 1920s and 1930s, are the agesex structure of the population at a specific point in time and extrapolated age-sex-specific rates of the components of population change: mortality, fertility, migration. The future size of population is calculated from the projected numbers of persons in each agesex group. Burch finds it in his contribution to this book (pp. 39-58) hard to understand why CCPM has remained so popular, notwithstanding its many strong points:
– It is a powerful and flexible abstract model of population dynamics
– It explains the past
– It results in contingent but confident prediction
– It provides a guide to future intervention
– Its mathematics is quite easy.
– The model can easily be grasped and used by geographers, planners and demographers.
ii. Cannan’s approach was not completely new. For instance, as early as the mid-18th century the Dutch actuary Kersseboom had demonstrated – in the absence of integral population censuses – that the size of a population could be estimated from a suitable life-table and assumptions with respect to the future annual numbers of newborn babies (Kersseboom, 1738-1742). For a more elaborate discussion of Cannan’s contribution to population forecasting, see De Gans (1994); also Kreager in this volume.
iii. Also in 1907 Alfred Lotka started using the terminology of formal demography to develop his stable population theory, clarifying the relation between age structure and the components of natural population growth and between stable and real populations (Lotka, 1907).
iv. The method of geometrical progression had been introduced by William Farr at the English Registrar General’s Office after the introduction of a national system of registration, and was often referred to as ‘the Registrar General’s method’ (Willcox, 1925: 28).
v. De Gans (1999, pp. 96-97). I am indebted to Prof. Rainer Mackensen, who drew my attention to Winkler’s work (Winkler, 1919; 1933) and to Prof. Nico Keilman, University of Oslo, who informed me about the population forecast made by Gunnar Jahn (Norway) (1926). For a discussion of the forecasts the the Statistisches Reichsamt, see Fleischhacker (this volume, chapter 9).
vi. “Etwas grundsätzlich anders (..) sind Vorausberechnungen des Altersaufbaues und der Bevölkerungszahl in Fortführung eines gegebenen Altersaufbaues mit Hilfe irgendwelcher Annahmen über die weitere Entwicklung der Bevölkerungsbewegung, wie sie der Verfasser zur Verdeutlichung der späteren Wirkung der Kriegsverluste wohl als erster vorgenommen hat und wie sie heute in der Bevölkerungsstatistik der vom Geburtenrückgang bedrohten Staaten üblich ist.’ (Winkler, 1933, 108; also Pinwinkler, 2003, 99-104.).
vii. For a discussion of the debate, see De Gans (2002); also Kreager (this volume, chapter 5).
viii. Both Methorst’s approach and the diagram he used were very similar to those of a fellow member of the International Statistical Institute, Pontus E. A. Fahlbeck (Sweden) (Fahlbeck, 1905).
ix. At first sight it is surprising that both Methorst (1922) and Verrijn Stuart (1919; 1922) were involved in calculations of future population size. Their behaviour seems to contradict the position they took towards forecasting. In their view, statisticians and statistical offices should abstain from the actual business of forecasting because the speculative aspect of forecasting could endanger the faith in the reliability of the statistical data statisticians had to supply in the first place (De Gans, 1999). It should be noted, therefore, that Methorst saw his extrapolation as a private affair. Verrijn Stuart did not consider his future calculation to be a true forecast, but at best a self-denying forecast: he wanted to demonstrate that a continuation of the high growth rate would ultimately result in absurd situations. The societal impact of the extrapolations of Methorst (1922) and Verrijn Stuart (1919; 1922) can only be understood properly if the authoritative position of these men in the national field of statistics, economics and demography is taken into account.
x. The debate and the nature of his conceptual mistake are amply discussed in De Gans (1999).
xi. ” … la loi bien connue de parallélisme des mouvements de population” (Bertillon, 1903: 1) We are not dealing here with the issue of the relative truth of this law. It is interesting, however, to read that Saltet & Falkenburg (1907, 3 & 5) who were critical with respect to the empirical foundations of the law, did not speak of ‘law’ but of the ‘theory of the parallelists’.
xii. Alfred Lotka worked at integrating fertility into a general dynamic theory of population. Few had thought to distinguish ‘marital’ fertility from ‘illegitimate’ fertility. This started to change only in the mid-1940s (Rosental, 2003, 104).
xiii.  For a discussion of the likelihood of an independent reinvention in the Netherlands, see De Gans (1999, 78-81).
xiv.  I have avoided presenting most of the figures Rooy used for his calculations. For these, see De Gans (1999, 129)
xv.  The word ‘everyday’ is an overstatement. However, presumably many more future calculations must have been made, and some of these must now be hidden away in the archives of departments and municipalities, waiting to be discovered. The number of published forecasts, however, is small.


This article has been published in:
Jochen Fleischhacker, Henk A. de Gans, Thomas K. Burch (eds.) -Population, projections, and politics. Critical and historical essays on early twentieth century population forecasting
Rozenberg 2003 – ISBN 978 90 5170 747 2

About the Author:

Henk A. de Gans has taught demography and urban and regional planning at the Department of Geography and Planning and was a senior researcher at the Amsterdam study centre for the Metropolitan Environment (AME) of the Universiteit van Amsterdam (The Netherlands). His main field of research of the last decade was the history of population forecasting. He has published books and articles on population forecasting and its history, including a textbook  on municipal population forecasting. Since his retirement in October 2003 he works as a guest researcher at AME.
Illustrations by Jarich Schaap

from the same book: Jochen Fleischhacker – Wie wird sich die Bevolkerung des Deutschen Reiches langfristig nach dem Erstem Weltkrieg Entwicklen?


El Salvador en transición

El Salvador

El acuerdo de paz firmado el 16 de enero de 1992 entre el gobierno y el movimiento rebelde FMLN puso fin a más de diez años de guerra civil en El Salvador. En este capítulo trataré los antecedentes de esa guerra y el desarrollo y el proceso que llevaron al acuerdo de paz. El énfasis radica en los cambios entre el estado, los partidos políticos y las organizaciones de la sociedad civil. De esta manera surge una imagen del contexto social en que nacieron las organizaciones de ayuda para el desarrollo y del espacio donde estas organizaciones intervinieron. Para dar una imagen global del contexto histórico de la guerra civil, me adentraré primero en algunos importantes desarrollos políticos y económicos que tuvieron lugar entre 1870 y 1970. Trataré después a los principales actors en los decenios anteriores a la guerra civil. Estos eran, entre otros, los (nuevos) partidos políticos, los militares, las organizaciones paramilitares, la iglesia y los movimientos revolucionarios. Seguirá a continuación el tema de la guerra civil, en el que se prestará atención al papel desarrollado por el FMLN, los partidos políticos, el gobierno salvadoreño y los Estados Unidos. Para terminar, se tratará el acuerdo de paz. Esbozo allí los cambios principales que tuvieron lugar en base a la llamada ‘triple transición’ en El Salvador.

Una historia de exclusión
Para Torres Rivas y González Suárez (1994:12), la guerra civil fue el resultado de un largo período de exclusión social, económica y política a la que fueron sometidos grandes sectores de la población. Este proceso tuvo profundas raíces históricas y llevó en los años sesenta y setenta a la polarización y al agravamiento de la crisis en la sociedad salvadoreña. La crisis social que surgió en estos años no puede explicarse sólamente como el resultado de la influencia de los Estados Unidos o de la oposición de la poderosa oligarquía agraria a las reformas (Carrière y Karlen, 1996:368). Hubo una combinación de factores internos y externos que en los años anteriores a la guerra impidió una modernización a fondo de la política, la economía y la sociedad. La mayoría de los análisis de la guerra civil salvadoreña comienzan en la segunda mitad del siglo pasado. Este fue el período en el que se desarrollaron el cultivo y la exportación de café a gran escala. El café tuvo una influencia definitiva en las relaciones sociales salvadoreñas en gran parte de ese siglo. El cultivo y la exportación de este producto fueron la reacción ante la disminución de la demanda internacional de indigo, un colorante azul oscuro de textiles que constituía hasta entonces el principal producto de exportación de El Salvador. Las mejores condiciones para el cultivo del café se dan en suelos situados entre los 500 y los 1.500 metros sobre el nivel del mar. Una gran parte de los suelos adecuados para el cultivo del café eran propiedad comunal, entre otros de pueblos indígenas. El gobierno dirigido (desde 1871) por los liberales era partidario de la comercialización en el usufructo de los suelos y abolió la propiedad comunal de la tierra en las reformas de 1881 y 1882. Un número relativamente pequeño de familias (entre ellas las dedicadas antes al cultivo del indigo) compró grandes extensiones de tierra, dominando rápidamente la producción y el comercio del café.

La concentración en pocas manos de la propiedad de la tierra aumentó en los años siguientes. En el período comprendido hasta el inicio de la Segunda Guerra Mundial, un pequeño grupo de familias mantuvo el control sobre la mayor parte del comercio del café (Paige, 1998:18-9). El lado opuesto de este desarrollo lo conformó una gran parte de la población, obligada a cultivar granos básicos, como el maíz y el fríjol, en pequeñas parcelas con suelos de baja calidad, mientras que otros se quedaban sin tierra (Browning, 1971). La población en las plantaciones de café trabajaba por salarios bajos y en malas condiciones. Los años que van de 1900 hasta la Segunda Guerra Mundial constituyeron, en palabras de Pérez Brignoli (1989:89), un período de ‘crecimiento empobrecedor’. La formación de la nación y del estado salvadoreños tuvo lugar en la segunda mitad del siglo diecinueve. Existió una relación estrecha entre la formación del estado y la llegada del café (Williams, 1994). La revolución liberal de 1871 testimonia esto. Los cultivadores de café tuvieron una influencia importante, sobre todo en el período de construcción del estado, y supieron, ya en un estadio temprano, asegurar sus intereses por intermedio del estado. Como consecuencia de su dependencia de los impuestos sobre la exportación de café, ‘resultaba un acto suicida para los gobiernos poner en peligro el crecimiento del café’ (Williams, 1994:220).

La militarización del estado salvadoreño data de comienzos de los años treinta del siglo veinte. Esta siguió a la primera apertura política en la historia salvadoreña. Bajo la presión de las protestas crecientes en las ciudades, Pío Romero Bosque, investido presidente en 1927, anunció elecciones libres. Estas fueron ganadas en 1931 por Arturo Araújo, un representante de la élite salvadoreña inspirado en las ideas del Partido Laborista inglés. Su gobierno se inició sin embargo poco después de la gran crisis económica de 1929. La economía salvadoreña entró en recesión. Las tensiones sociales crecieron. Araújo no fue capaz de enfrentar con éxito los problemas. Intervinieron entonces los militares, quienes restablecieron el orden y designaron a Maximiliano Hernández Martínez como nuevo presidente.

Hernández Martínez anunció en un comienzo la celebración de elecciones libres en las que podría participar el Partido Comunista (PC). Los comunistas ganaron las elecciones en algunos municipios, pero Hernández Martínez no permitió que accedieran al gobierno. El PC organizó entonces una rebelión popular (Bulmer Thomas, 1987; Dunkerley, 1988). El gobierno se enteró de los planes para organizar esta rebelión. Los dirigentes del Partido Comunista, entre ellos su fundador, Farabundo Martí, fueron arrestados y sentenciados a muerte. Sin embargo, dos días antes de la fecha fijada para la rebelión (el 22 de enero de 1932) comenzó una gran rebelión, que se concentró en la región occidental del país. La rebelión se había originado en los pueblos indígenas, cuya población había sufrido las consecuencias de la expropiación de tierras de 1880 y la subsiguiente concentración de tierras en manos de unas pocas familias después de 1920. Junto a esto, las miserable condiciones de vida a comienzos de los años treinta fueron además el motivo que impulsó a los campesinos de los pueblos indígenas, armados de machetes y armas de fuego, a ocupar haciendas y pequeñas ciudades. Hernández Martínez permitió que los militares intervinieran. Miles de indígenas fueron asesinados en la llamada matanza. Esta forma de represión extrema marcó el tono en el sistema utilizado decenios después para responder a las exigencias de las organizaciones campesinas. Los militares tuvieron desde entonces un papel dominante en el gobierno nacional y en la política. Esta situación se mantendría hasta la firma del acuerdo de paz.

Hernández Martínez gobernó más de diez años sin oposición, pero fue depuesto en 1944 por una coalición de militares descontentos y liberales. Esta nueva junta dispuso la celebración de elecciones. El resultado de éstas no fue sin embargo aceptado por los militares conservadores, quienes dieron un contragolpe. Esto fue algo típico en el proceso político que se dio entre 1931 y 1980 (Montgomery, 1995:37-8). A un golpe militar dado por militares reformistas (en colaboración con la oposición civil) se sucedía un contragolpe dado por militares conservadores. Los latifundistas no formaron nunca un partido politico propio que defendiera sus intereses, pues confiaban en los militares. A pesar de los problemas y las contradicciones políticas dentro del aparato militar, además de las contradicciones entre los militares y la élite salvadoreña, los militares defendieron los intereses de la oligarquía hasta 1979. Si se mira en retrospectiva el período después de la Segunda Guerra Mundial, marcado por circunstancias económicas externas positivas, se concluye que para El Salvador este fue un período de oportunidades perdidas (Bulmer Thomas, 1987). El gobierno, dominado por los militares, tuvo desde 1948 un rol más activo en la economía y siguió la ideología del desarrollismo, sin romper por lo demás con la tradición autoritaria. En los decenios posteriores a la Segunda Guerra Mundial aumentó el gasto estatal. El gobierno adelantó un gran número de proyectos infraestructurales y comenzó una política de desarrollo social (Martínez, 1991:12). Esta actuación del gobierno llevó entre otros a un aumento en la exportación de algodón y azúcar. Sobre todo los años sesenta mostraron un enorme crecimiento económico. Esto fue en parte el resultado de la creación de Mercado Común Centroamericano (MCAM). Las reformas políticas durante el gobierno del presidente Rivera, en los años sesenta, parecían anunciar la democratización del sistema político salvadoreño. Estos desarrollos tenían sin embargo una contraparte. Mientras la economía salvadoreña crecía en los años sesenta y setenta con un promedio del 5% anual, aumentaba al mismo tiempo la concentración de la propiedad de la tierra. De este modo, los campesinos con pequeñas parcelas debieron entregarlas para permitir el desarrollo de las plantaciones de algodón en la costa. Según un estudio del Programa de las Naciones Unidas para el Desarrollo (UNDP), el porcentaje de campesinos sin tierra aumentó del 11% al 40% en el período comprendido entre 1961 y 1975 (citado por Martínez, 1990:15). El campo se empobreció. A esto se agregó el hecho de que la oligarquía cafetera extendió sus intereses hacia la industria. Por esta razón no surgió una fuerte burguesía urbana independiente que, siguiendo el análisis de Moore (1966), hubiese afectado los intereses de la oligarquía agraria, dando así un impulso a la democratización. Las tensiones producidas por este desigual desarrollo económico pudieron ser frenadas en los años sesenta por la migración masiva de salvadoreños a Honduras y por una serie de limitadas reformas políticas (ver párrafo siguiente). La reforma agraria, que formaba para los partidos de oposición un instrumento clave para llegar a un reparto más equilibrado del crecimiento económico, resultaba sin embargo un tema tabú para la oligarquía salvadoreña. Esto se manifestó aún más después de 1969, cuando, como resultado de las tensiones entre El Salvador y Honduras (la llamada guerra del fútbol), grandes grupos de salvadoreños residentes hasta entonces en Honduras regresaron a El Salvador, aumentando la presión existente en la tierra.

Apertura política, polarización y agravamiento (1960-1979)

En los años sesenta y setenta se agudizaron las contradicciones sociales y aumentaron las tensiones políticas. En un comienzo parecía posible para la oposición política imponer cambios por medio de la vía parlamentaria. Los militares anularon sin embargo dos veces la victoria electoral de una coalición de partidos de oposición. Con esto se agotaron las posibilidades de realizar cambios por medio de las elecciones. Los movimientos populares y las organizaciones revolucionarias ganaron fuerza. La represión de la oposición por parte de militares y paramilitares aumentó. De esta manera surgió en El Salvador una situación de guerra civil. Estos desarrollos se tratarán más adelante.

Apertura política en los años sesenta: gobierno contra oposición
A finales de los años cincuenta se criticaba crecientemente al Partido Revolucionario de Unificación Democrática (PRUD), porque éste no ofrecía un espacio para la oposición política. En 1960 un grupo de oficiales jóvenes dio un golpe militar y anunció la celebración de elecciones libres. Tal como había ocurrido frecuentemente en la historia salvadoreña, este golpe militar produjo un contragolpe, realizado por militares más conservadores. Estos designaron como candidato presidencial al coronel Julio Rivera. Las consecuencias de este hecho tuvieron un gran significado en el sistema político de El Salvador, prolongándose hasta los años setenta. Rivera buscó civiles para conformar el gobierno y se acercó con este fin al recién fundado Partido Demócrata Cristiano (PDC). Dentro del PDC y después de un debate interno ganaron los ‘puristas’, bajo la dirección de Napoleón Duarte: El PDC decidió llegar al poder sólo por medio de elecciones y no aceptó participar en la junta. El coronel Rivera fundó seguidamente, ante el descontento del PDC, su propio partido político, el Partido de Conciliación Nacional (PCN), que debía proveer a la junta de una masa de seguidores propia. Existía sin embargo una diferencia importante con el prud, ya que Rivera reconocía el interés de celebrar elecciones libres, que incluyó en la constitución de 1962. El PDC había sido fundado en 1960 por representantes de la clase media urbana, quienes se habían inspirado en el trabajo de los líderes democrata-cristianos Eduardo Frei (de Chile) y Rafael Caldera (de Venezuela) (Webre,1979:53). El partido luchaba por una tercera vía y por reformas económicas y políticas, aunque era anticomunista, como ocurría con el PCN (Webre, 1979; White, 1973). El PDC experimentó un crecimiento vertiginoso: en 1964 ganó 14 de los 52 escaños en el parlamento, además de un gran número de alcaldías, entre ellas la de San Salvador. El PDC consolidó su posición en los años siguientes. La mayoría de los seguidores de este partido provenía de la capital (que crecía cada vez más), pero también los había en las provincias cerca de la capital, entre ellas Chalatenango (Webre,1979:103).

En las elecciones presidenciales de 1972 el PDC formó una coalición con dos partidos más pequeños, apuntando a la victoria electoral. Como consecuencia del fraude electoral esta coalición no resultó ganadora. El candidato del PCN, coronel Arturo Armando Molina, llegó al poder. En los meses tormentosos que siguieron, durante los cuales se celebraron separadamente elecciones para el parlamento, un grupo de militares jóvenes dio un golpe militar el 25 de marzo de 1972. Este golpe fue abortado por los servicios de seguridad y la fuerza aérea, que permanecieron fieles al presidente en funciones, Sánchez Hernández. Napoleón Duarte, quien había apoyado a los jóvenes militares golpistas, fue expulsado del país después de permanecer un corto tiempo en prisión. El PCN era en los años sesenta un partido fuerte e influyente. Este partido tuvo incluso una formidable victoria electoral un año después de la ‘guerra del fútbol’ (1970) y mantuvo durante el resto de los años setenta una base importante entre el sector campesino. El partido podía hacer uso de los recursos estatales. El partido y el gobierno estaban ligados de hecho. Esto se revelaba también en el lenguaje que los dos utilizaban. Términos como gobierno, partido y nación resultaban sinónimos (Webre 1979:19). La dirección del partido estaba compuesta por el presidente de la república y un pequeño grupo de altos oficiales.

En la descripción del PCN hecha por Alastair White en 1973, se afirmaba que los militares podían acceder a funciones gubernamentales por intermedio del PCN y también que civiles provenientes de las ciudades eran miembros del PCN y terminaban escalando puestos oficiales. White hacía énfasis en el hecho que no todos los empleados oficiales eran miembros del partido, pero que para los que no eran miembros resultaba más difícil acceder a puestos más altos.

La base del PCN mantenía corrientemente contactos personales con los líderes de partido, el personal gubernamental y los militares. Ser miembro formal tenía un interés secundario. A nivel local las estructuras militares, gubernamentales y de partido resultaban dificil de diferenciar: ‘Es justamente a este nivel que estas tres organizaciones emergen como una unidad, una tríada, cuyos miembros están separados sólo formalmente entre sí’ (White, 1973:194). Los que pertenecían a esta unidad eran llamados oficialistas o gobiernistas. El sistema político salvadoreño no fue dominado exclusivamente durante este período por los militares. Los civiles tenían también posiciones en el aparato estatal. En algunos ministerios las estructuras militares y civiles estaban fuertemente ligadas entre sí. El ministerio del Interior era particularmente conocido en este aspecto. Apoyaba a las municipalidades con mayoría del PCN y combatía a las de la oposición (White, 1973:194). El poder de los militares era grande en el gobierno local y en el proceso político. Los militares no tenían sin embargo una influencia similar en todos los ministerios. De esta manera, la Comisión Nacional de Planificación (CONAPLAN) tenía una independencia relativa de estas estructuras (White, 1973:194). CONAPLAN desarrollaba entre otros programas con financiación internacional. Desde los años sesenta surgió una diferencia entre los gobiernistas (miembros del PCN) y personas que pertenecían a la oposición (principalmente miembros del PDC). La oposición enfrentaba no sólo al otro partido, sino también al gobierno y al papel desempeñado por los militares en la política nacional. Llama la atención que los líderes del PDC usaran frecuentemente en los años sesenta y setenta la palabra ‘revolución’, mientras enfatizaban que se trataba de una revolución ‘pacífica’. El PDC creía en la posibilidad de una vía progresiva.

La militarización del campo: servicios de seguridad y paramilitares
La apertura política en los años sesenta produjo pocos cambios en el campo y se dio paralelamente con una creciente militarización. Esta militarización se fundamentó no solamente en el control y la represión, sino también en la conformación de un trasfondo político y en el control de los servicios públicos por parte de los militares. Ya a comienzos del siglo veinte se había conformado un aparato represivo que mantenía el orden en el campo. Los servicios de seguridad funcionaban en el marco de una legislación separada, la llamada Ley Agraria, vigente en el campo y que existiría hasta los años ochenta. Esta ley prohibía no sólo la formación de sindicatos, sino que se refería también en términos especialmente negativos a los trabajadores agrarios (McClintock, 1985:124-126). Las funciones de policía fueron ejecutadas hasta 1992 por tres servicios de seguridad: La Policía de Hacienda, la Policía Nacional y la Guardia Nacional. Estos servicios hacían parte del aparato militar y su dirección estaba integrada corrientemente por militares. Los soldados que habían terminado servicio estaban además obligados a participar durante un cierto período en patrullas civiles en sus lugares de residencia. Las patrullas (patrullas cantonales o escoltas militares) estaban dirigidas por comandantes locales que hacían parte del Servicio Territorial, un departamento del ministerio de Defensa (Walter & Williams, 1993:817). Eran civiles con una tarea militar (Blutstein 1971: 191-197. En la práctica se ocupaban no sólo exclusivamente de asuntos militares. Podían también desempeñar un papel en la política o el gobierno locales. Tomando como base el contingente de reservistas que alguna vez había prestado servicio en el ejército, los militares crearon en 1964 con ayuda norteamericana la Organización Democrática Nacionalista (ORDEN) (Montgomery, 1995: 55-6).

ORDEN hacía parte de la Guardia Nacional. La organización estaba integrada por una red de informantes activos en el campo, que mantenían informados a los comandantes locales y a la Guardia Nacional sobre las actividades políticas en los pueblos. Según cálculos, entre 50.000 y 100.000 personas en el campo habrían sido miembros de esta organización. La información obtenida por medio de la red de ORDEN era suministrada al Servicio Nacional de Inteligencia o SNI (convertido posteriormente en la Agencia Nacional de Seguridad Salvadoreña, ANSENAL). Una parte de los miembros de ORDEN estaba armada y disponía de un carnet de miembro que garantizaba un tratamiento suave por parte de los miembros de los servicios de seguridad (McClintock, 1985: 253). Ser miembro de ORDEN daba además determinadas ventajas, como el acceso a créditos. Por esta razón, ORDEN era más que un simple servicio de inteligencia; se desarrolló como movimiento político que combinaba un discurso de democracia liberal y progreso con un violento anticomunismo (Castro Hernández, 1976: 99-100). El movimiento existía ya antes de que se diese alguna rebelión armada con algún significado. Fue fundado con la idea de detener la difusión del comunismo. El ejército tenía a su cargo desde los años sesenta la prestación de algunos servicios públicos. Esto ocurría por intermedio de la denominada acción cívica, a través de la realización de cursos de alfabetización, consultas médicas en los pueblos y campañas de vacunación. Desempeñó además un papel crucial en la construcción de caminos (Blutstein y otros, 1971: 200). La acción cívica del ejército estaba organizada a nivel nacional por medio de la Dirección General de Acción Cívica, que había sido fundada en 1963 y hacía parte del ministerio de Defensa (Walter & Williams, 1993: 820). El director de esta sección era aconsejado por un comité nacional en el que estaban representados los ministros de Defensa, Agricultura, Salud Pública, Educación y Obras Públicas. A nivel departamental existían comités similares, que tenían a su cargo la supervisión de los proyectos otorgados a la provincia (Blutstein y otros, 1971: 198-201).

Surgimiento de una sociedad civil en el campo: iglesias y movimientos populares
Alastair White (1973) describió El Salvador a comienzos de los años setenta como un país tranquilo, donde sus habitantes no parecían rebelarse contra el gobierno y con una población campesina pasiva. Algunos años después El Salvador se había polarizado fuertemente. Surgió en corto tiempo un movimiento popular combativo que puso bajo presión al régimen salvadoreño. Al menos dos factores pueden explicar este desarrollo. De un lado, los desarrollos económicos y políticos en el período 1960 – 1975. Del otro, la movilización exitosa en el campo de campesinos y trabajadores agrarios adelantada por la iglesia católica y las organizaciones revolucionarias, en lo cual profundizo en seguida. Muchas explicaciones sobre la movilización de la población en el campo comienzan con razón con el papel desempeñado por la iglesia católica. Bajo la influencia del Concilio Vaticano Segundo (1962-1965) y de la Conferencia Episcopal Latinoamericana, celebrada en Medellín en 1969, soplaron nuevos vientos sobre la iglesia católica latinoamericana. La Conferencia Episcopal de Medellín tuvo sobre todo una gran importancia. La Conferencia proclamaba la defensa de los derechos de los oprimidos y el estímulo a las diferentes formas de organización, o bien una ‘opción preferencial para los pobres’ (Montgomery, 1995: 83).

También en El Salvador surgió un movimiento dentro de la iglesia católica que trabajaba con esta visión. Los seguidores de la denominada teoría de la liberación se concentraban especialmente en el arzobispado que (en ese tiempo) estaba conformado por cuatro provincias e incluía al 40% de la población. Surgieron diferencias políticas entre los obispos, la mayoría de los cuales se manifestó en contra de la teoría de la liberación. Pero también entre los seguidores de esta teoría surgieron diferencias de opinión. Sobre todo los sacerdotes jóvenes se mostraban partidarios de una toma de posición política y veían en el marxismo un instrumento para analizar la sociedad. Otros sacerdotes y religiosos más moderados manifestaban enfáticamente que la tarea de los sacerdotes consistía en guíar a los pobres, sin tomar ellos mismos una posición política (Montgomery, 1995: 81-9).

La organización de creyentes en comunidades de base fue un intento de romper con la tradición autoritaria de la iglesia católica. Los creyentes eran estimulados a discutir la relevancia de la biblia en el marco de su propia realidad. También eran estimulados a ponerse al servicio de la comunidad. Se calcula que en el period entre 1970 y 1976 fueron entrenadas 15.000 personas que se ocupaban tanto de asuntos religiosos como de salud pública, educación y agricultura. Esto no ocurría en todo El Salvador. La teoría de la liberación tenía una gran influencia en los municipios de Suchitoto y Aguilares (Cardenal, 1985; Pearce, 1986: 102-3). Este también era el caso en algunos municipios de Chalatenango, como en la ciudad de Chalatenango, La Palma y Dulce Nombre de María, al igual que en los municipios en la zona oriental de la provincia (Pearce, 1986: 112,117).

El surgimiento de las organizaciones revolucionarias (llamadas también organizaciones político-militares) actuó como segundo factor en la movilización del campo. Estas organizaciones desempeñaron un papel importante en la creación de los movimientos masivos. Los primeros movimientos revolucionarios surgieron a comienzos de los años setenta. Estos fueron el Ejército Revolucionario del Pueblo (ERP) y las Fuerzas Populares de Liberación Farabundo Martí (FPL). Posteriormente se sumarían tres organizaciones más. La Resistencia Nacional RN) se desprendió del ERP en 1975 después de un conflicto sobre la línea política. En 1976 se fundó el Partido Revolucionario de los Trabajadores Centroamericanos (PRTC) y en 1977 el Partido Comunista decidió pasar también a la lucha armada. Todas estas fracciones tenían un ala militar que cobijaba diferentes organizaciones populares. Chalatenango estaba casi completamente controlada por las FPL. Esta organización comenzó sus actividades en 1971 con ocho personas, bajo la dirección de Salvador Cayetano Carpio (alias Marcial). Marcial se había separado del Partido Comunista a finales de los años sesenta, donde había actuado durante varios años como presidente del partido. El debate en el PC se había concentrado en la aceptación, o el rechazo, de la lucha armada. Marcial estaba a favor, la mayoría del PC, en contra. Durante los primeros años esta organización recientemente fundada se dedicó a los entrenamientos militares, la educación, la construcción de una estructura de células, mientras cometía atracos bancarios para proveerse de recursos. La organización se dio a conocer en agosto de 1972, con motivo de un atentado con bombas perpetrado contra la embajada argentina. En sus años iniciales las FPL pensaban sobre todo en el desarrollo de una lucha urbana, ya que en la montañas de un país tan densamente poblado como El Salvador, la guerrilla difícilmente podía ocultarse. Aunque las FPL no creían en la posibilidad de poder desarrollar una clásica guerra de guerrillas, el movimiento consideraba sin embargo a los campesinos como un apoyo importante. Las FPL establecieron desde el comienzo una diferencia entre la lucha política y la militar. Después de haberse consagrado en un comienzo sobre todo a la lucha militar, las FPL decidieron en 1974 dedicarse por completo al trabajo con ‘las masas’ (Harnecker, 1991: 91). El énfasis radicaba en la lucha política, una guerra popular prolongada que debería llevar a una toma (armada) del poder. Este cambio tuvo una gran importancia para el desarrollo de las FPL. Sobre todo en el campo las FPL lograron conseguir un apoyo importante. La estructura de las FPL se componía de un número relativamente limitado de miembros, alrededor de los cuales estaba un grupo mayor, conformado a su vez por los grupos de apoyo y los simpatizantes. El trabajo de los maestros y los estudiantes (al lado de los religiosos o conjuntamente con estos) tuvo al parecer un papel destacado en la movilización de los campesinos. Muchos educadores participaron activamente en la ANDES, la Asociación Nacional de Educadores Salvadoreños, que a finales de los años sesenta y comienzos de los setenta logró convertirse en poco tiempo en un actor protagonista en el teatro de la política salvadoreña (Lungo, 1987: 62). Justamente en los años sesenta aumentó la inversión estatal en la educación, lo cual llevó a un aumento del número de educadores y escuelas en el campo. Ya desde los años sesenta los estudiantes trabajaban activamente en el campo. Un sacerdote contaba que en ese tiempo un muchacho había declarado durante la confesión ser guerrillero. En encuentros realizados en las iglesias la gente también manifestaba conocer todo lo referente al socialismo y a sus ‘variantes’ rusa, cubana y china. Para este sacerdote esto era la consecuencia de las actividades de los estudiantes que llegaban al campo los fines de semana, procedentes de San Salvador. Sobre todo entre los estudiantes de finales de los años sesenta existía el convencimiento de que la lucha política era una necesidad (Castañeda, 1993: 114).

Tanto la Universidad de El Salvador (UES) como la Universidad Centroamericana José Simeón Cañas (UCA) contaban con muchos estudiantes que estaban ligados al trabajo de la iglesia católica y a otras actividades políticas. Estudiantes de ambas universidades se hicieron miembros de los movimientos rebeldes. Muchos ya estaban relacionados con las actividades en el campo y probablemente se habían incorporado ya en un estadio temprano a las FPL. Lo mismo ocurría con los maestros. Harnecker (1991: 119,121) escribe por ejemplo que los (ex)estudiantes, los maestros y los miembros de las FPL trabajaban conjuntamente. Los puntos de contacto eran los catequistas formados por la iglesia, los cuadros del PDC y también los líderes municipales. Estos pudieron adelantar su trabajo basados en parte en las experiencias de la iglesia católica. No resulta irreal afirmar que muchos chalatecos y también sacerdotes no sabían precisamente quiénes eran miembros de las FPL, ni en que consistía la estrategia de este movimiento o incluso si las FPL tenían una estrategia. Muchos miembros de las FPL no se daban a conocer como tales y se ganaron la confianza de la población durante su larga permanencia en los pueblos. Trabajaban (como se ha enunciado antes) conjuntamente con líderes locales que tampoco eran miembros de las FPL y que en muchas ocasiones no sabían que trataban con miembros de las FPL. A la larga muchos líderes locales fueron incorporados en las estructuras de las FPL. De esta manera las FPL se infiltraron en organizaciones locales de Chalatenango, sin manifestarse como FPL Este movimiento tuvo una base local y se mostró capaz de influenciar la forma de organización local. La formación de la Unión de Trabajadores del Campo (UTC) fue un ejemplo importante. Según Harnecker (1991: 98), esto fue el producto del esfuerzo de algunos líderes eclesiásticos, líderes de la asociación sindical de educadores (andes) y algunos miembros de las FPL ocupados en un trabajo político de base. El marco directive de la unión estaba directamente relacionado con las FPL, pero para muchos campesinos miembros de la unión esta relación no resultaba nada clara, hasta bien entrados los años setenta. Mientras que las FPL jugaban un papel en la formación de la UTC, manteniendose después en contacto con su marco directivo, este movimiento supo en otros casos comprometer consigo al marco directivo de sindicatos ya existentes. Desde sus inicios las FPL habían reclutado miembros que operaban en otras organizaciones, donde a menudo habían escalado posiciones importantes. El ejemplo más claro lo constituyó la incorporación de Mélida Anaya Montes (alias Ana María), quien continuó como presidenta de la entonces poderosa andes, a pesar de haberse afiliado a las FPL. Debido al hecho que las FPL afiliaban en sus filas a líderes en funciones, este movimiento pudo formar una extensa red que incluyó toda clase de organizaciones populares y sindicatos.

Las FPL no solamente mantenían contacto con estas organizaciones, sino que también las influenciaban. De la misma manera las FPL comprometieron consigo a un número de movimientos ya existentes, entre ellos el Movimiento Estudiantil Revolucionario de Secundaria (MERS) y la organización campesina Federación Cristiana de Campesinos Salvadoreños (FECCAS). Esta última organización se convertiría, junto con la UTC, en un importante movimiento campesino y el apoyo más importante de las FPL. Después de un tiempo las dos organizaciones se fusionaron, pasando a convertirse en la Federación de Trabajadores del Campo (FTC). Hacia 1976 feccas tenía aproximadamente 3.000 miembros y la UTC, según cálculos, 10.000 (Pearce, 1985: 163). A comienzos de los años ochenta la FTC logró mobilizar miles de campesinos que reclamaban el derecho a la tierra y un aumento de salario. Las FPL tuvieron en 1975 un papel protagonista en la formación del movimiento de masas Bloque Popular Revolucionario (BPR), con FECCAS, UTC MERS y ANDES como las principales organizaciones participantes. También en este caso vale aclarar que no todos los miembros de estas organizaciones estaban enterados de la relación entre el BPR y las FPL (Harnecker, 1991: 108).

Las FPL eran a mediados de los años setenta un motor importante en la formación de un movimiento de masas. La organización estaba conformada por un grupo relativamente pequeño de personas, pero era al mismo tiempo un factor importante a nivel local, aunque invisible (y semiclandestino). La ideología de las FPL fue así ‘transmitida’a los líderes locales, algo que se expresaba entre otras cosas en el análisis marxista y la terminología usada por los movimientos campesinos (Cardenal, 1985: 452). Pero las FPL incorporaron también un número de líderes locales en sus filas, que habían sido formados por el PDC y la iglesia católica. De esta manera surgió una vía doble, con efectos fructíferos, entre las FPL y el movimiento campesino FTC. Un factor que facilitó el trabajo de las FPL en el campo radicó en que el grado de organización casi no existía allí y en que, en contraste con las ciudades, no había necesidad de luchar para conseguir esferas de influencia en detrimento de otras organizaciones (Pearce, 1986: 174).

Represión y fraude
La movilización política en el campo fue respondida a finales de los años setenta por los militares y los servicios de seguridad con una represión creciente. Esta estaba dirigida en primer lugar a frenar las actividades políticas de la oposición. Líderes sindicales, catequistas y sacerdotes se convirtieron en sus víctimas. Las actividades guerrilleras en el campo apenas existían en este tiempo. La UTC tuvo sin embargo desde su fundación en 1975 milicias armadas, encargadas de la seguridad durante las manifestaciones. Se dieron además, a partir de aproximadamente 1977, ajustes de cuentas con miembros de ORDEN. Pero en la estrategia de las FPL el énfasis radicó sobre todo en la guerra popular prolongada y en la lucha armada en las ciudades. Las elecciones presidenciales de 1977 se constituyeron en un momento importante de la escalada que habría de seguir. Al igual que en 1972, el PDC formó una coalición con dos partidos políticos más pequeños, esta vez bajo el nombre de Unión Nacional Opositora (UNO), apuntando a una segura victoria electoral. Sin embargo, debido al fraude electoral, le fue imposible llegar al poder. Las posibilidades de realizar reformas por medio de la vía electoral parecieron agotarse.

La guerra civil

Los años siguientes al fraude electoral se caracterizaron por una polarización creciente. La oposición contra el nuevo régimen del general Carlos Humberto Romero (quien había sido candidato del PCN) crecía. La represión por parte de militares y paramilitares también aumentaba (Montgomery, 1995: 72-3).

El período que va de las elecciones de 1977 hasta finales de 1979, al inicio del gobierno de una nueva junta favorable a las reformas, se considera en retrospective como el período en que germinó la guerra civil. Esta se convirtió en 1979 en un hecho, después del fracasado golpe militar de ese mismo año. Los movimientos revolucionarios formaron el FMLN y se orientaron a la lucha armada. Los Estados Unidos se involucraron activamente en el conflicto, apoyando una coalición formada por los militares y el PDC.

El golpe militar de 1979
El 15 de octubre de 1979 (tres meses después de la revolución sandinista) un grupo de militares favorable a las reformas dio un golpe militar, en un intent de evitar la guerra civil. Se formó una junta conformada por miembros de los partidos de oposición y por militares. También participaron en ella miembros de organizaciones ligadas con las organizaciones revolucionarias. La junta quería poner fin a la caótica situación del país por medio de una serie de reformas políticas y económicas. Como consecuencia de las permanentes violaciones de los derechos humanos por parte de los militares, todos los miembros de la junta y los integrantes del gabinete se retiraron a finales de 1979, con excepción de dos militares. A pesar de los fuertes indicios que mostraban el nuevo dominio del aparato militar por parte de los seguidores de la línea dura, los demócrata-cristianos formaron una coalición con los militares (la denominada segunda junta). Esta alianza produjo una polémica dentro del Partido Demócrata-Cristiano (PDC) y ocasionó una gran división. Los miembros del PDC que siguieron a la junta tenían sus esperanzas puestas en las reformas propuestas, esperando controlar la ola revolucionaria y evitando una guerra civil. En marzo de 1980, sin embargo, renunciaron algunos miembros como consecuencia de la creciente represión. Napoleón Duarte, quien para entonces ya había reingresado a la ARENA política, se convirtió en presidente de la tercera junta. Las organizaciones revolucionarias habían aceptado pasivamente en un comienzo a la junta, pero manifestaron rapidamente su pérdida de confianza en el gobierno, pasando definitivamente a la lucha armada. Este paso fue en primer lugar una reacción ante la represión en las ciudades y en el campo, debido a la cual las actividades de los movimientos de masas se convirtieron en algo peligrosísimo y de hecho imposible. El cambio de estrategia había sido dado también por la idea que El Salvador, después de Nicaragua, estaba maduro para la revolución. Para esto era necesario formar un ejército guerrillero. La idea de organizar la lucha armada había sido propagada al mismo tiempo por Cuba, que desempeñó un papel importante en la formación del FMLN. Los cinco movimientos revolucionarios formaron en octubre de 1980 el Frente Farabundo Martí para la Liberación Nacional (FMLN). La metamorfosis de los movimientos de masas en movimiento guerrilleros comenzó a finales de 1979. Las organizaciones revolucionarias se retiraron al campo. Los cinco grupos guerrilleros se organizaron en territorios más o menos delimitados, donde habían desarrollado anteriormente trabajo de base o donde existían contactos (clandestinos) con organizaciones ya existentes. El Salvador fue repartido de esta manera en zonas estratégicas que eran controladas por fracciones del (futuro) FMLN. El movimiento revolucionario adquirió un carácter eminentemente militar. Los miembros de los anteriores movimientos de masas (tales como los sindicatos campesinos UTC y FECCAS) se unieron a la guerrilla o prestaron sus servicios en el campo logístico. Esta militarización de la lucha no careció de efectos para la estructura interna de las organizaciones revolucionarias, que a partir de entonces fueron organizadas mucho más fuertemente en base a un molde militar. Castañeda (1993: 120) anotaba que los movimientos revolucionarios se vieron obligados a metamorfosearse en un ejército con un brazo político. Por esta razón estos movimientos ya no eran más lo que siempre habían querido ser: un movimiento político con una base en la población (las masas), que participaba también en la lucha militar. Después de que Duarte accediera al poder como líder de la (tercera) junta, se ejecutó a gran velocidad una serie de reformas: los bancos privados fueron nacionalizados, al igual que la exportación de café, algodón y azúcar. La reforma más importante la constituyó la reforma agraria a gran escala que iría en contra de las posesiones de la oligarquía y que había recibido el apoyo de los Estados Unidos, país que además la había financiado y preparado en parte. Los planes de expropiación iniciales abarcaban aproximadamente el 50% de las tierras de cultivo. Finalmente sólo fue expropiado el 20% (posesiones con más de 500 hectáreas). Estas tierras fueron asignadas a las cooperativas de los trabajadores del campo que habían trabajado antes en ellas. La reforma agraria tuvo sin embargo lugar bajo el estado de sitio. Aunque los militares apoyaban a los demócrata-cristianos en la implementación de la reforma, dejando de lado su tradicional alianza con la oligarquía, la represión en el campo continuó sin cesar (Montgomery, 1995: 136-140).

Sectores ultraderechistas de la oligarquía y del ejército veían sus intereses amenazados por las reformas adelantadas por la junta. Roberto d’Aubuisson, un mayor retirado del ejército, desempeñó un papel protagonista en su estrategia. Con la ayuda de salvadoreños ricos residentes en Miami y asesores de Guatemala, Taiwan y Argentina, d’Aubuisson formó una organización político-militar de extrema derecha. El Frente Amplio Nacional (FAN) puede ser visto como la rama política de la organización y resultó de hecho el antecesor de ARENA, el partido político fundado posteriormente. El FAN tenía secciones para la juventud, las mujeres y los latifundistas y consiguió movilizar a cerca de 20.000 personas en una manifestación a finales de 1979 (Pyes, 1983:52-3).

Junto a estas actividades políticas, se emprendían actividades militares. A ORDEN se le inyectó nueva energía y se formaron escuadrones de la muerte (Montgomery, 1995;132) Aunque la junta había abolido ORDEN, al igual que el servicio de inteligencia ANSENAL, d’Aubuisson fue capaz de poner a salvo una parte de los archivos y bancos de información de estas organizaciones (Stanley, 1996:149-150). Con esta base, la extrema derecha organizó de nuevo una red nacional que más tarde serviría para la fundación de ARENA. Los escuadrones de la muerte eran grupos armados que operaban en la clandestinidad y estaban conformados por militares y civiles. Estos escuadrones adelantaron sobre todo en los años ochenta campañas de terror a gran escala (Byrne, 1996:58; Grupo Conjunto, 1994:866). Habían sido formados ya a finales de los años setenta y funcionaron en los ochenta tanto desde dentro de los servicios de seguridad y de inteligencia, como fuera del ejército. La represión alcanzó en el período 1980 – 1982 un clímax macabro. El terror desarrollado por el ejército y los escuadrones de la muerte estaba dirigido contra todo aquel que fuera relacionado con la oposición. Cientos de líderes de los movimientos populares fueron asesinados, al igual que miles de activistas, simpatizantes y personas sospechosas de adelantar actividades políticas. No se hacía ninguna excepción, como lo demostró el asesinato del arzobispo Arnulfo Romero en marzo de 1980. Según la Comisión de la Verdad, d’Aubuisson fue el autor intelectual de este asesinato (Comisión de la Verdad, 1993:269). Con todo, el golpe militar de 1979 no llevó a la pacificación del conflicto salvadoreño, sino que por el contrario aumentó el caos en el país.

Guerra de baja intensidad
Los Estados Unidos desempeñaron un papel protagonista en la guerra civil salvadoreña. La estrategia estadounidense fue aquella de la la guerra de baja intensidad, dirigida a la ejecución de reformas políticas y económicas y al debilitamiento de la guerrilla salvadoreña. Sobre todo durante la presidencia de Ronald Reagan los Estados Unidos se propusieron acabar con los movimientos de liberación en la región (Barry & Castro, 1993; Moreno, 1990). Para esto resultaba necesario apoyar a los militares salvadoreños. Los Estados Unidos apoyaron al mismo tiempo el proceso hacia la transición democrática que había sido anunciado en marzo de 1981 por la junta, haciendo énfasis en la celebración de elecciones libres. Esta estrategia fue un intento de estabilizar la situación política nacional y al mismo tiempo una manera de presentar a El Salvador como una ‘nueva democracia’ ante el público y el congreso norteamericanos, como un país donde disminuían las violaciones de los derechos humanos. Los Estados Unidos operaban como el factor de unión en una coalición formada para ‘combatir la subversión’. Tanto los militares como el PDC tenían cada uno sus propias razones para trabajar conjuntamente con los Estados Unidos. Los militares necesitaban el apoyo de los Estados Unidos para derrotar a la guerrilla y salvar su propia institución (Byrne, 1996:75). El PDC veía en la nueva coalición una manera para continuar adelantando las reformas, con las cuales disminuiría el apoyo social a las alternativas revolucionarias. Los Estados Unidos se mostraron en contra de un posible golpe de estado dado por la extrema derecha junto con algunos sectores del ejercito (Byrne, 1996:63). La influencia de los Estados Unidos no llevó a la abolición de los escuadrones de la muerte, pero sí a la decisión de la extrema derecha de fundar un partido político propio para participar en las elecciones de 1982. Bajo la dirección de Roberto d’Aubuisson fue fundado a comienzos de 1982 el partido de extrema derecha Alianza Republicana Nacionalista (ARENA).

Bajo la presión creciente de los Estados Unidos, que deseaban reformas políticas, se celebraron elecciones desde comienzos de los años ochenta y se dictó una nueva constitución. Desde 1982 se celebraron elecciones parlamentarias y para los concejos municipales cada tres años. Las elecciones presidenciales se celebraron desde 1984 cada cinco años. A finales de 1983 se dictó una nueva constitución, que fue aprobada por el parlamento. En 1986 se dictó una nueva ley que concernía a los municipios, en la que se les otorgó una mayor autonomía. A pesar del título de ‘joven democracia’ o ‘nueva democracia’ dado a El Salvador a nivel internacional como consecuencia de estas reformas, en la práctica el país era una ‘democracia electoral’ (Munck, 1993). El gobierno de Napoleón Duarte (1984 – 1989) apenas tuvo poder real durante este período. El ejército, los Estados Unidos y el FMLN eran los actores principales en el campo de fuerzas salvadoreño de los años ochenta. El apoyo americano al ejército salvadoreño llevó a un aumento en el número de soldados: de 10.000 en 1980 a 56.000 en 1987, además de un fuerte mejoramiento en la calidad del material militar. La estrategia del ejército después de 1984 consistió en separar la guerrilla de la población civil, instalar defensas civiles y ejecutar programas de ayuda nacional, lo que a menudo ocurría en colaboración con ministerios u otras instancias gubernamentales (Byrne, 1996:130).

El FMLN fue sometido a presión durante el transcurso de 1984, como consecuencia de un cambio de táctica. El ejército decidió realizar más bombardeos aéreos. Esto tuvo como consecuencia un cambio drástico dentro del FMLN. La estrategia predominantemente militar dio paso a una estrategia más política. El ejército guerrillero, conformado por grandes unidades, fue dividido en pequeños grupos móviles de guerrilleros que en caso de necesidad podían reagruparse en corto tiempo. El énfasis no radicaba ya en la realización de acciones militares a gran escala, sino en la ejecución de operaciones más pequeñas y en el sabotaje económico. El FMLN trasladó además la guerra hacia todo el país, en especial hacia la capital, San Salvador, donde aumentó fuertemente el número de miembros de comandos urbanos. Un punto clave en la nueva estrategia lo formó sin embargo la atención dada a ‘las masas’, o sea la estrategia para conseguir un amplio apoyo entre la población, que a la larga debía ser movilizada en una ofensiva final (Byrne, 1996:88,132-3). En el campo se luchaba por el debilitamiento del gobierno estatal, que se expresó sobre todo en el derrocamiento o asesinato de alcaldes. El FMLN hacía también énfasis en la construcción de una red de relaciones clandestinas con la población civil que participaba eventualmente en milicias o podría ser movilizada en un futuro (la denominada estrategia de la doble cara).

El apoyo de la población en las zonas de guerra, y fuera de ellas, resultó de gran importancia, tanto para el ejército como para el FMLN. Ambos desarrollaron programas y estrategias para ganarse ‘los corazones y las mentes’ de la población. Tanto el FMLN como el ejército reconocían que la guerra era en gran parte una lucha política. Byrne (1996:121) sostiene que este era sobre todo el caso en el período entre 1984 y 1989, cuando surgió una situación de jaque entre el ejército y la guerrilla.

Arena política y sociedad civil
ARENA y el PDC se enfrentaron desde 1982 en la ARENA política. El PDC se reveló hasta 1985 como el partido más fuerte en las elecciones, aunque en 1982 ARENA obtuvo junto con el PCN la mayoría en el parlamento. Duarte ganó en 1984 las elecciones presidenciales y el PDC obtuvo en 1985 la mayoría en el parlamento. A partir de 1988 declinó la influencia del PDC. ARENA ganó en 1988 las elecciones parlamentarias y el candidato de ARENA, Alfredo Cristiani, ganó en 1989 las elecciones presidenciales. La política de gobierno de ARENA, con Cristiani como presidente, se enfocó a la liberalización de la economía y al desmonte de la reforma agraria de 1980. Como consecuencia de la militarización y la guerra, la democratización en El Salvador no se había completado, pero la ‘democracia electoral’ inició un proceso de cambios de gobierno basados en las elecciones. Esto era un fenómeno nuevo en El Salvador. Algunos partidos que formaban parte del FDR, ligado al FMLN, decidieron además después de algunos años aprovechar las oportunidades que ofrecían las elecciones. Tres partidos políticos formaron la lista conjunta Convergencia Democrática (CD) para las elecciones de 1988 (Montgomery, 1995: 208). Después de la victoria electoral de Duarte en 1984 hubo de nuevo un poco más de espacio para el desarrollo de actividades políticas. Debido a la represión de comienzos de los años ochenta, las organizaciones sociales habían practicamente desaparecido. La iglesia podía manifestarse en cierto sentido, aunque ésta había tomado un rumbo más moderado después del asesinado del arzobispo Romero en marzo de 1980. Hacia 1983 la organización popular más grande era la Unión Popular Democrática (UPD), que tenía en el campo a la mayoría de sus seguidores, se había beneficiado de la reforma agraria y apoyaba a Duarte (Montgomery, 1995:176). El número de nuevas organizaciones sociales creció desde 1984. Estas incluían sindicatos, organizaciones privadas de ayuda para el desarrollo, organizaciones defensoras de los derechos humanos, organizaciones de refugiados y organizaciones femeninas. Casi ninguna de estas organizaciones se podía ver independientemente de los contrastes políticos en el país, estando todas ellas ligadas a uno u otro partido político (PDC o ARENA) o al FMLN. Las fuerzas sociales apenas podían escapar a la antítesis insurgencia – contrainsurgencia, dominante durante la guerra. Un ejemplo de esto lo constituye la radicalización de un número de movimientos urbanos en 1986. Esto llevó a la creación de la cúpula sindical unts, que estaba fuertemente ligada al FMLN. Para ofrecer un contrapeso fue fundado poco después unoc, ligado al PDC. Estas organizaciones recibían a menudo financiación internacional, tal como se tratará extensamente en el capítulo siguiente. La apertura política de los años ochenta tuvo sin embargo consecuencias mínimas para el poder de los militares. Bajo los gobiernos de Magaña (1982 – 1984) y Duarte (1984 – 1989) se redujo en algo la influencia de los militares en la administración pública. El ejército ganó sin embargo más autonomía y su rol político no terminó, ya que los militares combatían un enemigo nacional. El poder y la red del ejército en el campo se mantuvieron además en gran parte. Después del traspaso de poder a ARENA aumentó el número de militares en funciones públicas y se acabó con los pocos cambios realizados durante los gobiernos anteriores (Walter & Williams, 1993: 825).

El proceso de paz y last res transiciones

En los años anteriores al acuerdo de paz tuvieron lugar cambios importantes a nivel regional e internacional que hicieron posible las conversaciones para lograr la paz. El acuerdo firmado el 7 de agosto de 1987 en Esquipulas, Guatemala, por los presidentes centroamericanos tuvo en este contexto una gran importancia. Los presidentes de El Salvador, Guatemala, Nicaragua, Honduras y Costa Rica acordaron en el denominado Acuerdo de Esquipulas II que ninguno de estos países se inmiscuiría en la guerra de otro y que cada gobierno iniciaría un diálogo con la oposición armada y llamaría a la celebración de elecciones libres. Este acuerdo resultaba original debido a la mínima participación de los Estados Unidos en su formación. Los Estados Unidos habían perdido temporalmente cierta influencia durante este período, sobre todo como consecuencia del asunto Irán – Contra, pero continuarían desempeñando un papel importante en Centroamérica e influenciando el curso del proceso de paz (Barry & Castro, 1991; Durkerley, 1994).

No fue el presidente Duarte quien logró adelantar negociaciones serias con el FMLN, sino el gobierno del presidente Cristiani, quien había llegado al poder en 1989. Cristiani hacía parte del ala moderada de ARENA y había prometido en su discurso inagural adelantar conversaciones con el FMLN. Dentro de ARENA se produjo a este respecto una gran polémica. Después de que se realizaron las primeras conversaciones en octubre de 1989 entre el gobierno y el FMLN, en las que también estuvieron presentes los militares y el arzobispo, los militares declararon no estar dispuestos a permitir negociaciones que socavaran el aparato militar. Cristiani declaró estar de acuerdo con ellos. Las negociaciones fueron interrumpidas a raíz del atentado contra las instalaciones del sindicato izquierdista FENASTRAS. Como consecuencia de esto, el FMLN decidió acelerar los planes para perpetrar un ataque aún mayor a la capital. El FMLN inició el 11 de noviembre de 1989 una ofensiva que llevó a la guerrilla hasta San Salvador. La dirección del FMLN se había sin embargo convencido que sólo las negociaciones que llevaran a la democratización, podrían producir algún resultado. Pero para una mayoría de los guerrilleros ‘la revolución’ había sido siempre la meta esencial y era todavía la motivación más importante de su lucha. La ofensiva contra la capital mostró que el FMLN era todavía militarmente fuerte y que éste no había ido a las negociaciones como consecuencia de su debilidad (como afirmaban los militares) sino como resultado de la situación de jaque en que se encontraban los dos bandos. Esto fortaleció la posición del FMLN en las negociaciones. Luego de la ofensiva, los Estados Unidos aumentaron su presión sobre el gobierno salvadoreño para que iniciara negociaciones serias. El asesinato en noviembre de 1989 de los seis jesuitas que trabajaban en la UCA, su criada y la hija de ella, motivó a los Estados Unidos a suspender su ayuda militar al gobierno salvadoreño (Acevedo, 1992; Dunkerley, 1994; Montgomery, 1995).

Los desarrollos internacionales se reflejaban en este proceso. Sin la caída del Muro de Berlín y la distensión política entre las dos potencias, las negociaciones en El Salvador no se habrían formalizado tan rapidamente. Los Estados Unidos permitieron por esta razón la mediación de las Naciones Unidas. Luego de la derrota electoral de los sandinistas en febrero de 1990, aumentó en los Estados Unidos la confianza en el proceso de negociaciones y elecciones libres, que podia llevar a resultados satisfactorios. La mediación de las Naciones Unidas tuvo importancia sobre todo en lo que se refería al contenido. Entre abril de 1990 y comienzos de 1992 se adelantaron negociaciones bajo la dirección de Alvaro de Soto, la mano derecha del secretario general de la ONU, Pérez de Cuéllar (ONU, 1995). Estas negociaciones mantuvieron la tensión hasta el último día, debido a que sobre todo los militares se mostraban cada vez opuestos al acuerdo. La presión de la comunidad internacional y de los Estados Unidos llevó a finales de 1991 a la firma de una importante declaración, en la cual se estipuló a grandes líneas el acuerdo de paz. El 16 de enero de 1992 se firmó el acuerdo final en el castillo de Chapultepec, en Ciudad de México. Con este acuerdo se cerraron finalmente los acuerdos parciales firmados anteriormente. El 1 de febrero de 1992 se inició la implementación de los acuerdos.

Acuerdos de paz
Las medidas más importantes en el acuerdo de paz debían llevar a la desmilitarización y la democratización de la sociedad salvadoreña. Este proceso comenzó con un cese al fuego que entró a regir a partir del 1 de febrero de 1992. El FMLN desmontaría sus estructuras militares y destruiría sus armas. Una parte importante del acuerdo trataba sobre el papel de los militares y los servicios de seguridad. Los militares perderían muchas de sus funciones y quedarían sujetos al control de las fuerzas civiles. El ejército sería reestructurado y saneado. Junto a esto, los conocidos servicios de seguridad como la Policía de Hacienda y la Guardia Nacional serían abolidos para dar paso a una nueva policía civil, la Policía Nacional Civil (PNC). En los acuerdos se había redactado también una serie de parágrafos sobre las reformas del sistema judicial y electoral. En el campo económico y social los acuerdos fueron notablemente menos ambiciosos. Se había decidido la formación de un foro donde se encontrarían los trabajadores, los patrones y el gobierno, y la ejecución de un plan de reconstrucción nacional (Acevedo, 1992; PRN en ECA 519-520). Se acordó que militares, guerrilleros y gente que se había posesionado ilegalmente de tierras (en su mayoría simpatizantes del FMLN) podrían acceder al reparto de tierras (ver capítulo 3). Se estableció una comisión nacional (COPAZ) conformada por representantes de los partidos políticos, el gobierno y el ejército, que tendría a su cargo la supervisión de la ejecución de los acuerdos. El control del cumplimiento de los acuerdos de paz quedó en manos de la Organización de las Naciones Unidas en El Salvador, una organización especial de la ONU en El Salvador (ONU, 1995).

Transiciones
El proceso de la posguerra en El Salvador puede ser analizado con base en tres transiciones (Torres Rivas y González-Suárez, 1994), a saber: (1) la transición de la guerra a la paz; (2) la democratización de la sociedad salvadoreña y (3) la liberalización de la economía salvadoreña. Todas estas tres transiciones tienen una dinámica propia, pero están estrechamente relacionadas. La transición de la guerra a la paz y la pacificación de la sociedad salvadoreña están relacionadas con los cambios económicos y políticos en el país. Con la finalización de la guerra civil se rompió con una dinámica de polarización y confrontación político-militar. Esta dinámica había surgido en la segunda mitad de los años setenta y tenía sus raíces en un sistema político autoritario y en una economía organizada en torno a una pequeña oligarquía. La finalización del conflicto armado fue un proceso en sí mismo: los militares se retiraron a sus bases y los guerrilleros a los campamentos levantados especialmente para ellos; la Comisión de la Verdad investigó las violaciones de los derechos humanos, mientras que los aparatos militarizados de la policía debieron dar paso a un aparato de policía civil. ONUSAL desempeñó un papel de mediadora en este proceso y estuvo presente hasta 1995 en todas las anteriores zonas de guerra en el país. El contraste entre el gobierno y la oposición, que había determinado hasta entonces el campo de fuerzas político, se mantuvo, pero como consecuencia de la desaparición de la dinámica de guerra se crearon espacios para nuevas iniciativas políticas y civiles. La segunda transición, que marcó el paso de un régimen autoritario y military hacia una sociedad donde los mecanismos democráticos desempeñaban un papel principal, recibió un impulso a través de los acuerdos de paz salvadoreños. Ya en los años ochenta se había iniciado la democratización, en la cual se le daba una gran importancia a las elecciones. Tal como ya se anotó en este capítulo, este proceso de democratización fue limitado. El proceso político después de 1992 se diferenció substancialmente del que se llevó a cabo antes de y durante la Guerra civil, debido a la desmilitarización del sistema político salvadoreño, el respecto por los derechos humanos y una serie de reformas constitucionales. Las elecciones de 1994, en las que se eligieron presidente de la república, nuevo parlamento y concejos municipales, fueron denominadas por esta razón ‘las elecciones del siglo’ (Spence y otros, 1994). El FMLN participó en ellas como partido político y sin haber cambiado su nombre, teniendo la posibilidad de adelantar abiertamente una campaña política y movilizarse por todo el país.

El desarrollo más importante en esta transición democrática lo constituyó el encuentro de los anteriores enemigos en la ARENA política. En las elecciones de 1994 el FMLN obtuvo el 25% de los escaños en el parlamento, así como 48 de las 262 alcaldías. ARENA fue el gran ganador de las elecciones. Su candidato, Armando Calderón Sol, fue elegido presidente y sucedió a Alfredo Cristiani. Este partido, que en el pasado había sido relacionado con los escuadrones de la muerte y que tenía una gran influencia entre la élite económica del país, ganó entonces las elecciones por distintas razones: ARENA disponía de suficiente dinero para financiar la campaña electoral, se mostraba con éxito como ‘creador de la paz’ y combinaba esto con la ideología nacionalista que había acogido desde su fundación. El partido utilizaba en su beneficio la desconfianza en las capacidades políticas de la ex-guerrilla. Había además problemas en el registro de población en las zonas ocupadas hasta 1992 por el FMLN. ARENA utilizaba de manera moderna los medios de comunicación de masas, explotaba los sentimientos de temor por la guerra y la violencia y continuaba con una cultura política en la cual los electores se identificaban con el partido ‘de gobierno’ o con el partido de oposición.

Las elecciones de 1997 para el parlamento y los concejos municipales mostraron un cambio importante. El FMLN mostró que podía contar con un apoyo mayor, convirtiéndose en un serio rival para ARENA. Las fracciones de ARENA y el FMLN en el parlamento fueron casi igual de grandes a partir de junio de 1997 y el FMLN obtuvo resultados especialmente positivos en las grandes ciudades del país, entre ellas San Salvador y algunas ciudades aledañas. El FMLN, que luego de las elecciones de 1994 había sufrido una crisis interna, se convirtió en un factor de poder real, ya fuera solo o en combinación con pequeños partidos del centro. Poco antes de las elecciones de 1997 ARENA sufrió una profunda crisis interna. Los escandalos de corrupción, la estructura jerárquica de su organización y el descontento sobre la situación económica le hicieron perder votos. ARENA se recuperó sin embargo para las elecciones de 1999, que fueron ampliamente ganadas por el candidato moderado Francisco Flores. Como resultado, los viejos rivales tuvieron que encontrarse en la ARENA política, disputándose el poder político. Estos desarrollos pueden considerarse como una ruptura revolucionaria con el pasado. La guerra civil produjo indirectamente un sistema politico liberal-democrático, aunque esta no hubiese sido la intención inicial del FMLN. Debido a que estas reformas políticas fueron impuestas por un movimiento revolucionario, este proceso puede ser considerado como una democratización ‘desde abajo’ (Paige 1998:330-7).

La tercera transición es aquella de una economía agraria con un sector industrial relativamente pequeño y protegido que pasó a convertirse en una economía abierta en la que se intentó promover y diversificar la exportación a través de una (nueva) integración con la economía mundial. El gobierno de Cristiani adelantó una política económica neoliberal y limitó la influencia del estado en la economía. Puso término al monopolio estatal en la exportación del café y el azúcar y privatizó de nuevo el sistema bancario. Las cooperativas que habían surgido como resultado de la reforma agraria de 1980 fueron presionadas para dividirse en pequeñas empresas particulares. Los bancos quedaron de nuevo en manos de familias que pertenecían a la vieja oligarquía, lo que llevó a una fuerte concentración del capital bancario (Briones y Ramos 1995:22). Este nuevo sector bancario orientó sus intereses, junto con el sector comercial, hacia las consecuencias económicas de la emigración salvadoreña hacia los Estados Unidos. Cerca de un millón de salvadoreños (una quinta parte de la población) trabajaba a mediados de los años noventa en los Estados Unidos y enviaba regularmente dólares a sus familias en El Salvador. Estas transacciones bancarias superaron paulatinamente los ingresos tradicionales provenientes del café. Junto con el dinero llegado por concepto de ayuda para el desarrollo, estas transacciones formaron cerca del 20% del producto nacional bruto (FUSADES, 1996). La nueva élite financiera obtuvo los beneficios de este desarrollo y una posición influyente, en parte a costa de los sectores agrario e industrial (Mena & Arriola, 1995). Como consecuencia de estos desarrollos, la producción de café ya no es la columna vertebral de la economía salvadoreña. El café sigue constituyendo el principal producto de exportación agrario y formó en 1995 el 36% del valor total de las exportaciones (FUSADES, 1996).

La política neoliberal de los gobiernos de Alfredo Cristiani y Armando Calderón Sol resultó beneficiosa para la nueva élite financiera. Las consecuencias de esta política parecieron en un primer momento favorables. Produjo (también en los últimos años de la guerra civil) un crecimiento del PIB, mientras la inflación se mantenía a un bajo nivel y se limitaba el déficit presupuestal (FUSADES, 1996). Ante este crecimiento surgieron sin embargo interrogantes desde distintos lados. Se critica sobre todo la dependencia de la corriente de dólares que entraba al país (Boyce, 1996; Umaña, 1997). La gran corriente de dólares hacia El Salvador mantiene bajo el precio del dólar, lo que hace poco atractivas las exportaciones. Por esta razón se desarrollan insuficientemente la agricultura y la industria. Existe la pregunta si este desarrollo puede generar a largo término un suficiente crecimiento económico. Aunque las cifras oficiales sobre la pobreza solo han bajado ligeramente y el reparto de ingresos sigue siendo muy desigual, la emigración de salvadoreños hacia los Estados Unidos ha tenido sobre todo un efecto suavizador.

Conclusión
Una élite pequeña con intereses en el cultivo y la exportación de café dominó la sociedad salvadoreña desde comienzos del siglo diecinueve hasta la guerra civil. A pesar de la modernización de la economía salvadoreña después de la Segunda Guerra Mundial, el café siguió siendo la columna vertebral de la economía. En este período también tuvieron lugar algunas reformas políticas, que fueron desmontadas cuando la oposición (moderada) se hizo demasiado fuerte. Esto se demostró sobre todo con los fraudes electorales de 1972 y 1977. La falta de oportunidades para traducir en reformas y por la vía parlamentaria la oposición y el descontento crecientes, estaba estrechamente relacionada con los intereses de una pequeña élite de latifundistas. La concesión de más libertades políticas y de un espacio para la oposición hubiese llevado a la larga a una reforma agraria, que iría en contra de los intereses oligárquicos. Los militares no permitieron hasta 1980 que esto sucediera. El último medio que utilizaron fue la represión y el fraude. Pero los militares intentaron también consolidar su poder de otras maneras. Participaron ellos mismos en política (PCN) y organizaron a la población en el campo (ORDEN).  Los movimientos revolucionarios intentaron comprometer consigo a los movimientos sociales o fundaron ellos mismos sus propios movimientos. Aunque la estrategia y los objetivos de estos movimientos diferían en muchos puntos de los expuestos por los militares, existía también aquí un encadenamiento de estructuras políticas y militares. En términos de ‘associational cultures’, los años setenta y ochenta se caracterizaron por la politización y la militarización de la sociedad civil. Las distintas organizaciones y los movimientos sociales estuvieron casi siempre ligados con uno de los partidos en lucha. Las tres transiciones discutidas en este capítulo están estrechamente relacionadas entre sí. La estructura económica cambió durante la guerra civil, la oligarquía cafetera perdió importancia y esto permitió la democratización. Resulta paradójico que la democratización haya comenzado ya durante la guerra civil. El año de 1992 fue sin embargo escenario de un cambio importante. Se rompió entonces definitivamente con la dinámica de la confrontación político-militar, que tenía sus raíces en el sistema político autoritario y en la estrategia de lucha contra la rebelión desarrollada por los Estados Unidos. Los militares se retiraron a sus bases y dejaron de desempeñar el rol político que se habían atribuido desde 1931.

En combinación con una serie de reformas constitucionales, la desmilitarización le dio un contenido al proceso de democratización. Las organizaciones de ayuda para el desarrollo tuvieron que orientarse hacia estas nuevas relaciones. En el capítulo siguiente trataré el rol desempeñado por la ayuda internacional durante la guerra civil y los años que siguieron.

Published in:  Chris van der Borg – Cooperación externa, gobierno local y reconstrucción posguerra – ISBN 978 90 5170 748 9 – 2003


De werkvloer van het Koninkrijk. Over de samenwerking van Nederland met de Nederlandse Antillen en Aruba. Inhoudsopgave

In 1654 wordt door de vergadering van de Heren XIX, het bestuur van de West-Indische Compagnie, verzucht dat het behouden van Curaçao een te grote last betekent voor de Compagnie. De banden met Nederland blijven. Eeuwen later, in 1998, verschijnt een bundel opstellen Breekbare banden en in 2001 luidt de titel van een departementaal gedenkboek Knellende Koninkrijksbanden. In De werkvloer van het Koninkrijk wordt verslag gedaan van de samenwerking tussen Nederland en de ‘warme delen’ van het Koninkrijk in de periode dat min of meer vanzelfsprekend werd overeengekomen dat de Nederlandse Antillen en Aruba deel uit blijven maken van het Koninkrijk der Nederlanden.

Het eerder dominerende dekolonisatie perspectief van aanstaande onafhankelijkheid is daarmee van de baan. De teneur van de samenwerking in Koninkrijksverband verandert en wordt meer en meer aangestuurd onder het adagium ‘blijvend, niet vrijblijvend’. De geldstroom uit Nederland naar de Nederlandse Antillen en Aruba valt als ontwikkelingshulp niet te legitimeren en heeft averechtse gevolgen. De formeel verankerde gelijkwaardigheid van de partners manifesteert zich in de praktijk van de verhoudingen steeds vaker in een spagaat van ongelijkheid waarvan Nederland de maat bepaalt.

Toch is Nederland niet bij machte te voorkomen dat een ‘sociale kwestie’ op Curaçao onstaat die ‘overloopt’ naar ‘Antillen-gemeenten’ in Nederland. De moraal van het Koninkrijk is niet zo helder als voorheen. Wat zal het Koninkrijk voor de Caribische landen nog kunnen betekenen wanneer grenzen vervagen en Nederland steeds meer deel uitmaakt van Euroland?

Het boek De werkvloer van het Koninkrijk (Rozenberg Publishers, 2002) nu online:

De werkvloer van het Koninkrijk I: Inleiding 
De werkvloer van het Koninkrijk II: Kernbegrippen
De werkvloer van het Koninkrijk III: Spagaat van ongelijkheid
De werkvloer van het Koninkrijk IV – Ontsporing van de samenwerking 
De werkvloer van het Koninkrijk V – Formaat van de samenwerking 
De werkvloer van het Koninkrijk VI – De vertegenwoordigheid van Nederland  
De werkvloer van het Koninkrijk VII – Een doekje voor het bloeden
De werkvloer van het Koninkrijk VIII – De moraal van het koninkrijk
De werkvloer van het Koninkrijk IX – Edward Heerenveen – Epiloog

Plus: Video Antilliaans verhaal – Aflevering 1

Lammert de Jong (1942 – 2024) studeerde aan de Vrije Universiteit in Amsterdam waar hij promoveerde. De titel van zijn proefschrift was Bestuur en publiek. Vanaf 1985-1998 was hij gedurende tal van jarenwerkzaam als Vertegenwoordiger van Nederland in de Nederlandse Antillen. Daarvoor werkte hij als wetenschappelijk medewerker bestuurskunde in Lusaka, Zambia (1972-1976). In de volksrepubliek Benin was hij directeur (veldleider) van de Ontwikkelingsorganisaties Stichting Nederlandse Vrijwilligers (1980-1984). Als adviseur Koninkrijksrelaties bij het ministerie van Binnenlandse Zaken en Koninkrijksrelaties heeft hij 2000 zijn ambtelijke loopbaan afgesloten.

Omslag: Het kantoor van de Vertegenwoordiging van Nederland in de Nederlandse Antillen is gevestigd in het gebouw dat op de omslag is afgebeeld, de Rouvilleweg 39. Dit stadshuis is vermoedelijk in de eerste helft van de 18e eeuw tot stand gekomen (Fundashon Pro Monumento en de Werkgroep Monumento habrí 2001, (Open Monumentendag). Sinds 1979 is het gebouw eigendom van de Stichting Monumentenzorg Curaçao. Vanaf 1983 is het pand verhuurd aan de Nederlandse Vertegenwoordiging. Het gebouw is opgenomen in de serie delftsblauwe borden met land- en stadshuizen van de Stichting Monumentenzorg Curaçao. Delftsblauw komt meer voor in de Nederlandse Antillen, het thema van één van de carnavalsgroepen 2002 op Curaçao is delftsblauw.

Valuta
De koers van de Antilliaanse gulden (Naf) en later ook de Arubaanse munt, de Arubaanse florijn (Afl) is gekoppeld aan de US-dollar ($) tegen een koers van Naf 1,79 per dollar. Vanaf 1980 loopt de koers van de dollar op. In april 1985 bereikt de Antilliaanse gulden zijn hoogste koers ooit ten opzichte van de Nederlandse gulden met Hfl 1,96 per Naf 1,00.[i] Daarna daalt de US-dollar en vanaf 1990 schommelt de koers rond Naf 1,00 voor Hfl 1,00. In 2000 stabiliseert de koersverhouding zich op een hoger niveau: Naf 1,00 voor Hfl 1,21 (januari) en Hfl 1,43 (december). In 2001 blijft de koers op dit niveau met als hoogste koers: Naf 1,00 voor Hfl 1.44 (juli).[ii

Noten
i. Edo Haan, Antilliaanse Instituties. De economische ontwikkeling van de Nederlandse Antillen en Aruba, pag. 46. Labyrint Publication 1998.
ii. Ministerie van Binnenlandse Zaken en Koninkrijksrelaties, DGCZK, FEA, faxbericht 21.01.2002.