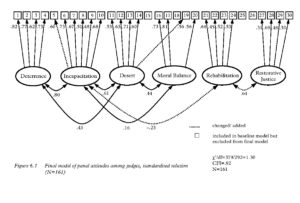
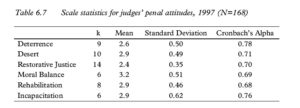
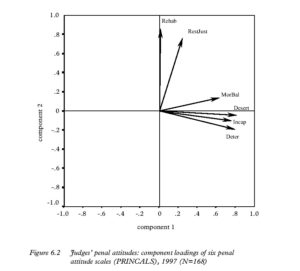
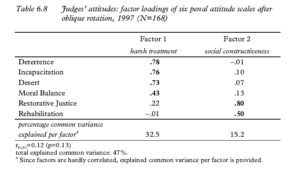
Punishment And Purpose ~ Penal Attitudes

Justice3.1 Introduction
In the previous chapter it has been argued that the practice of legal punishment in itself is morally problematic because it involves actions that would be considered wrong or evil in other contexts. The practice of legal punishment therefore demands a sound (moral) justification. Questions relating to the justification and subsequent goals of punishment have been considered in depth in a number of theoretical and philosophical approaches.

The gamut of theoretical perspectives concerning the justification and goals of punishment has been narrowed down to the general categories of Retributivism, Utilitarianism, Restorative Justice and mixed or hybrid theories. Paying due attention to the main controversies that (still) shape theoretical debate, Chapter 2 elaborated in some detail on the core arguments of these accounts of legal punishment. Radical theories were introduced, but not elaborated, since it was argued that they are of little relevance to the focus of this book, namely the study of attitudes of magistrates within the criminal justice system.

This chapter takes a more detailed look at the concept of penal attitude and its measurement. Penal attitudes are defined as attitudes towards the various purposes and functions of punishment. In turn, these purposes and functions of punishment are deduced from the philosophical theories discussed in the previous chapter. Section 3.2 elaborates in some more detail on the ‘attitude’ concept in general, and ‘penal attitudes’ in particular. A number of different approaches to the definition and use of the concept of penal attitudes is briefly presented. Section 3.3 explores and justifies the arguments of why it is important to try to measure such attitudes. It is argued that the measurement of penal attitudes is essential for any study that is directly or indirectly concerned with the link between moral theory and practice. Section 3.4 discusses various strategies that can be used for measuring penal attitudes including some of the practical and methodological issues. Research experiences in the Netherlands and abroad are introduced both for illustrative purposes and to highlight the pros and cons of the different approaches (and should not be viewed as an exhaustive review of such research).

3.2 What is a penal attitude?
In the previous section penal attitudes have been broadly defined as attitudes towards the various goals and functions of punishment. Although such a definition introduces the object of the attitudes, the actual meaning of the concept attitude remains unexplained. Before elaborating further on penal attitudes and their measurement, a somewhat more detailed discussion of the attitude concept is therefore merited.

Many texts concerning the study and measurement of attitudes mention Gordon Allport’s influential work (1935) as the historical bench mark for the application of the attitude concept in social-psychology. Indeed, Allport was among the first to systematically analyse and define the term attitude. However, as his own ‘History of the concept of attitude’ shows, many scholars before him had attempted to define and use it for scientific purposes (Allport, 1935, pp. 798–810). Allport traces the first use of the attitude concept in psychology back as far as 1862. After reviewing sixteen definitions of ‘attitude’ and identifying some common and useful elements, he presents his own definition of attitudes:
An attitude is a mental and neural state of readiness, organized through experience, exerting a directive or dynamic influence upon the individual’s response to all objects and situations with which it is related (Allport, 1935, p. 810).

Allport’s definition contains elements of the concept of attitude that are still generally accepted today.[i] However, to some this definition might seem unduly complex (Oskamp, 1977). Moreover, as Fishbein and Ajzen (1975) pointed out, “conceptual definitions will be most useful when they provide an adequate basis for the development of measurement procedures without trying to elaborate on the theoretical meaning of the concept” (Fishbein & Ajzen, 1975, p. 6).

Traditionally, attitudes were said to be partitioned into three components: cognitive, affective, and conative (action tendency). There are, however, questions about the empirical validity of this partitioning because in practice the individual components may prove to be indistinguishable (McGuire, 1969; Oskamp, 1977). Furthermore, this partitioning has led to much confusion about the true meaning of the concept. It is therefore not surprising that in an extensive literature review, Fishbein and Ajzen (1972) found almost 500 different ways that were designed with the aim of measuring the concept attitude. However, they argue, many of these attempted to place a subject on a bipolar dimension indicating a “general evaluation or feeling of favorableness toward the object in question” (p. 493). Fishbein and Ajzen suggest that the term ‘attitude’ should be reserved solely to refer to a person’s location on the affective dimension concerning a particular attitude object. The evaluative nature of attitudes is reflected by many types of attitude measurement that focus on a person’s rating on ‘like-dislike’, ‘agree-disagree’, ‘favourable-unfavourable’, ‘good-bad’ or ‘approve-disapprove’ scales. Some of the best known examples of such attitude scales are those developed by Thurstone, Guttman and Likert.[ii]
Stressing the evaluative nature of attitudes, a widely accepted definition of the concept is: (…) a learned predisposition to respond in a consistently favorable or unfavorable manner with respect to a given object (Fishbein & Ajzen, 1975, p. 6).

However, as Ajzen pointed out years later (1988), attitudes, though still primarily reserved for the affective dimension, may also be inferred from expressions of beliefs (i.e., cognition) about the attitude object and expressions of behavioural intentions (i.e., conation) toward the attitude object (Ajzen, 1988). In fact, as Hogarth argued, the word ‘evaluative’ in the definition already implies both a belief (cognition) about an object and an emotional response (affect) to it (Hogarth, 1971). From an operational point of view, this seems to be the most manageable approach to the attitude concept and as such it will be endorsed in this study.

The essence of the definition is that an attitude is learned (through experience, education, social and cultural environment), is evaluative in nature and has a motivational function with respect to behaviour. Furthermore, ‘attitude’ is a theoretical construct that has to be inferred from measurable responses toward an object (Ajzen, 1988, p. 4). Attitude objects may be things, places, persons, events, concepts or ideas (Oostveen
& Grumbkow, 1988).

In the present context the adjective ‘penal’ refers to the attitude object of interest to this book. Thus, in general, we are concerned with the study of attitudes with respect to punishment. In particular, our interest lies in scrutinising the link between moral legal theories of punishment and the practice of punishment. To further this endeavour, the attitude object(s) have been further restricted to the central concepts of the theories of Retributivism, Utilitarianism and Restorative Justice.

3.3 Why measure penal attitudes?
It has been argued, from a moral point of view, that theories can and should bind the practice of punishment to certain order and regularity (see Chapter 2). Moral theory of legal punishment is expected to serve as a critical standard for the practice. In other words, we would expect our practice of punishment to reflect a solid underlying legitimising framework. Officials within the criminal justice system frequently tend to justify their institution and the concrete practice of punishment by referring to legitimizing aims and values drawn from moral theories of punishment (Duff & Garland, 1994). Accordingly, the evident moral worth of philosophies and theories of punishment leads one to expect a consistent link between theory and practice. Closer inspection of sentencing practice, however, suggests that, although a link between (moral) theory and practice may well be present, it is not as evident and straightforward as one might expect or wish. As Tunick has put it:
I believe there is an ideal of justice underlying our practice of legal punishment, an ideal that sometimes gets obscured, lost in the shadows of the institutions of criminal law (Tunick, 1992, p. viii).

At an aggregate level, overlooking longer periods of time, autonomous dynamics seem to underlie the sentencing process. Such dynamics, however, appear to be independent of the offences committed or the social context in which the system is operating (Michon, 1995; Michon, 1997). Furthermore, even though such dynamics may be demonstrated, they do not necessarily reflect underlying legitimising views about functions and goals of punishment.

At the more specific level of concrete sanctions in individual cases or in groups of similar cases, the quest for consistent underlying views concerning justification and purpose is perhaps even more complicated. At this level research has repeatedly shown substantial differences between individual judges and between district courts concerning sentencing decisions in similar cases (Berghuis, 1992; Fiselier, 1985; Grapendaal, Groen, & Van der Heide, 1997; Kannegieter, 1994). Furthermore, it proves to be especially difficult to infer underlying purposes or philosophies of punishment from the actual practice of sentencing (Myers & Talarico, 1987).

This is especially true in instances concerning the relation between offence seriousness and severity of punishment. For instance, with rehabilitation in mind, the more serious the offence, the more deviant the offender’s personality is supposed to be, and therefore the longer the offender must be detained in order to rehabilitate. A similar relation between offence seriousness and severity of punishment holds for deterrence, incapacitation, and retribution (Fitzmaurice & Pease, 1986, pp. 49–51; Pease, 1987). Most sentences can be argued a posteriori to have had the intention of serving any combination of purposes or any purpose exclusively (cf. Van der Kaaden & Steenhuis, 1976). As such, one might even argue that moral legal theory concerning punishment merely serves as a convenient pool of rationalisations that can be drawn from eclectically (cf. Van der Kaaden, 1977).

Even if all judges would be completely consistent (within and between themselves) in their sentencing practices, it would still be impossible to infer an underlying philosophy solely from the sentences passed. Additional (external) statements concerning purposes of punishment would be helpful.[iii] One might expect to find such guiding principles in the Penal Code. In Dutch Penal Code, however, no such information is to be found (Hazewinkel-Suringa & Remmelink, 1994; Nagel, 1977; Van der Kaaden, 1977 ). Neither a general justification, nor purposes at sentencing are provided in the Dutch Penal Code.[iv] But even if ‘rationales for sentencing’ (Council of Europe, 1993) were to be formalised, the mere existence of such reasoned expositions is not enough to guarantee their adoption by sentencing judges, nor can examination of sentences establish whether they have been applied consistently.

Thus, if we are to study the link between moral legal theory and the practice of punishment, the measurement of judges’ penal attitudes is an inevitable prerequisite. We need to be able to measure penal attitudes in a manner consistent with moral legal theory. If there is a legitimising (moral) view or framework underlying the practice of sentencing today, it should somehow be reflected in the minds of the sentencing judges. If a general justification and purposes of punishment were prescribed in Dutch Penal Code, we could ‘simply’ check if judges’ attitudes reflect such prescriptions. In the absence of both formal prescriptions and guiding principles, it is therefore important to measure judges’ attitudes and to search for communal moral points of view with possible implications for sentencing. The first necessary step is to establish that the various theoretical arguments and concepts have some meaning whatsoever in the minds of magistrates. Second, we would have to decide whether judges’ understanding of those concepts reflects a consistent, relevant and legitimising perspective of justice for the practice of sentencing.

In summary, moral theories can only ‘bind’ the practice of punishment if the officials involved in the practice know of, understand, and adopt (at least parts of) those theories. The notion of ‘penal attitudes’ must be central in any study concerning the link between moral theory and practice. The measurement of penal attitudes will play a critical role not only in establishing the link between moral theory and practice of punishment, but also in assessing implications for legislative change and policy implementation (Bazemore & Feder, 1997). For example, in order to encourage more consistency in sentencing, sentencing committees within the Dutch judiciary are currently coordinating the formulation of ‘starting points’ in sentencing. Such a system of starting points, however, presupposes the existence of an underlying vision (Lensing, 1998). Detailed knowledge about the visions of Dutch magistrates may determine the success and acceptance of such starting points. It is conceivable that judges interpret and validate goals and means of sentencing in different ways. If we want to harmonise such differences, we need to be able to explicitate them objectively (Van der Kaaden, 1977). Furthermore, longitudinal assessment of penal attitudes, as well as their measurement among different professional groups (e.g., prosecutors, probation officers) may be of crucial importance for shedding light on some of the fundamental dynamics underlying our criminal justice system.

3.4 Approaches to the measurement of penal attitudes
This section provides a brief review of a number of approaches to the measurement of penal attitudes. The specific definition of our attitude object (as described in Section 3.2) will be relaxed in order to allow us to draw examples from a wider range of research experiences.

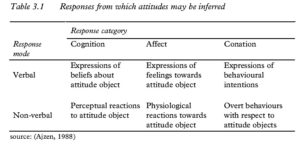
In Section 3.2 it was argued that ‘attitude’ is a theoretical construct. As such, attitudes are not open to direct observation. Instead, attitudes have to be inferred from peoples’ responses to attitude objects. Such responses are believed to be expressions of attitude (De Vries, 1988). These expressions may be verbal or non-verbal in nature and, in general, are measurable. Table 3.1 shows the types of measurable responses towards objects from which attitudes may

Table 3.1 Responses from which attitudes may be inferred

Table 3.1 Responses from which attitudes may be inferred

thus be inferred. The table was extracted from Ajzen (1988, p. 5). Because attitudes have to be inferred from verbal or non-verbal expressions, concerns for reliability and validity of the measurement abound. We will pay due attention to such concerns. Although Table 3.1 shows the various types of responses from which attitudes can be inferred, methods for measuring those responses may vary within and across the cells. A particularly useful and important general distinction between measurement methods is one which considers differences between qualitative and quantitative approaches to attitude measurement.

Qualitative approaches to attitude measurement generally focus in depth on relatively few cases. “It goes beyond how much there is of something to tell us about its essential qualities” (Miles & Huberman, 1984, p. 215). Qualitative research methods include unstructured or semi-structured interviews with open-ended questions (Rubin & Rubin, 1995), think-aloud protocols (Ericsson & Simon, 1984; Newell & Simon, 1972), group interviews and conversation analysis (e.g., focus groups: Morgan (1993)), observations of overt behaviour and content analysis of documents or transcripts. These methods produce data in the form of words rather than numbers (Miles & Huberman, 1984). Although some level of quantification (coding) is not uncommon in qualitative research, in general it does not rely on statistical methods of inference. Rather the qualitative researcher emphasises in-depth interpretation of the often detailed qualitative data at hand (Swanborn, 1987).

Quantitative approaches, on the other hand, focus on relatively large numbers of cases. They are aimed at producing quantitative or easily quantifiable data. Quantitative research methods generally involve the use of (inferential) statistics in order to search for or test common and generalisable patterns of association or causation. Quantitative approaches to attitude measurement usually concern extensive use of uni- and/or multidimensional scaling techniques with data obtained through questionnaires.

Scaling methods are used to scale persons, stimuli or both persons and stimuli (McIver & Carmines, 1981). One of the most widely used unidimensional scaling methods is Likert scaling (Likert, 1970; McIver & Carmines, 1981; Swanborn, 1988). A Likert scale produces a single score for a person representing his or her degree of favorableness toward a particular object. Some other well-known unidimensional scaling techniques are Guttman scaling and Coombs scaling (cf. McIver & Carmines, 1981; Summers, 1970; Swanborn, 1988). In contrast with the Likert scale, which is subject (i.e., person)-centered, the scales developed by Guttman and Coombs produce scale values (on one continuum) for both persons and stimuli. Of course, the choice of method should depend on the research questions. In contemporary attitudinal research, however, most researchers seem to prefer the use of Likert scales. Likert scaling procedures are relatively simple, easy to use and generally appear to produce results at least as reliable as the other, more complex methods.

Multidimensional scaling techniques involve the simultaneous assessment of respondents’ positions vis-à-vis more than one latent trait (i.e., dimensions). Furthermore, ultidimensional methods, such as Principal Components Analysis (Dunteman, 1989), Factor Analysis (Kim & Meuller, 1978; Kim & Mueller, 1978), Multidimensional Scaling (MDS) (Kruskal & Wish, 1978), HOMALS and PRINCALS (Gifi, 1990; Van de Geer, 1988) may be used to determine the dimensionality underlying responses to a set of items. In other words, they are used to determine the number and composition of empirically (and preferably theoretically) discernible latent traits in a particular set of data. As such, in empirical research, multidimensional methods frequently precede unidimensional scaling in order to determine how many and which attitude scales should be constructed as well as which items should be included in those scales.

Before elaborating on some examples of different approaches to attitudinal research in a judicial setting, one more methodological issue regarding certain types of attitude measurement needs to be addressed. As mentioned above, concerns for reliability and validity abound in any type of attitude measurement. Moreover, ‘single item measures’ of attitude are especially prone to problems of reliability and validity. Although such single item scales are frequently referred to as ‘Likert-type scales’, they should not be confused with attitude scales obtained through the Likert procedure, which involves summation of multiple items.[v] In single measures of attitude, respondents are asked to report directly on the attitude of interest using a single scale for favorableness or agreement. A single measure can never fully represent a complex theoretical construct. Rather, such a single measure simply captures part of that construct. This is a matter of validity. Furthermore, single measures tend to be unreliable: repeated measurements are not as highly correlated as one might expect or wish.

This is due to random error in measurement. In multiple item scales, the random errors involved in the separate items are assumed to cancel each other out through the combination procedure, yielding a much more reliable final scale. Although most methodologists agree that multiple item scales are superior to single item scales (McIver & Carmines, 1981; Nunnally, 1981), single item scales are still widely used.

Apart from, but related to, methodological issues in scaling, the researcher interested in a particular attitude must decide on how to select or derive the items (attitude statements) that will be used for the measurement. Again, different approaches are possible. Among these are eclectic or pragmatic approaches, theory driven approaches and phenomenological approaches. Below, a number of research experiences with attitude measurement in a judicial setting are discussed to illustrate different approaches.[vi]

3.4.1 Quantitative research
Multiple measures
One comprehensive and well known quantitative study of the sentencing process is Sentencing as a Human Process by Hogarth (1971). Magistrates’ attitudes play a central role in this frequently cited study. Given the impact Hogarth’s study had in this field of research as well as the systematic and well documented methodology he applied, we will give it more attention than several other studies.

Confronted with substantial disparity in sentencing in Ontario, Canada in the 1960’s, Hogarth set out to examine and explain the sentencing process among Canadian magistrates. He distinguished between three main classes of independent variables: variables related to the cases dealt with, legal and social environment (constraints), and personality and backgrounds of the magistrates (Hogarth, 1971, p. 18). In considering the personality of magistrates, Hogarth chose to focus on ‘larger psychological units’, i.e., attitudes. He argued that attitudes represent “a compromise between inner forces of individual magistrates and their definitions of the external world to which they relate” (p. 24). As such, he conceived attitudes as information-processing structures (p. 101). Hogarth’s definition of the concept attitude is quite conventional and concurs with our view of the concept discussed in Section 3.2 above. His attitude object, however, is much more widely defined. Hogarth considers judicial attitudes. Judicial attitudes include all attitudes relevant to the judicial role which the individual magistrate has adopted.

In determining the method of attitude measurement, Hogarth argued against inferring judicial attitudes from judicial conduct (i.e., overt behaviour) because that would lead to circularity in reasoning when explaining the behaviour. Instead, he chose to construct attitude scales through specifically designed questionnaires. Hogarth’s approach to the selection of attitude statements (items) that are used for scale construction is phenomenological.

This approach can be contrasted with the theoretical approach to item selection in which items are logically derived from existing theories on the subject. In the theoretical approach, “the researcher makes a priori theoretical assumptions about the existence of certain attitudes held by the subjects of investigation” (p. 103). In the phenomenological approach, on the other hand, items are selected from evaluative statements made by the subjects of investigation themselves. The phenomenological sources of evaluative statements which Hogarth used include sentencing principles stated by magistrates in reported cases, articles published by magistrates, reports of study groups, decisions of courts of appeal and speeches by judges related to crime and punishment (p. 107). The pool of attitude statements thus obtained was narrowed down in the course of three pilot studies involving various types of subjects such as students, police officers, and probation officers.

For his main study, Hogarth selected a sample of 116 probation officers, 103 police officers, 50 law students, 59 social work students, and 73 magistrates. He used Principal Components Analysis with orthogonal (varimax) rotation of the components to derive attitude scales from a pool of 107 items. Five rotated principal components emerged from the analysis, explaining almost 60 percent of the total variance in responses. The first component is labelled justice. It covers items that seem related to the concern that crime be punished in proportion to its severity (just deserts).

The second component is labelled punishment corrects and involves items related to individual prevention through treatment and individual deterrence. The third component is labelled intolerance and involves items not directly related to crime, but, rather, social deviance in general. The fourth component is labelled social defence and involves items related to general deterrence and denunciation of crime. The fifth and final component is labelled modernism and relates to ‘new-world’ puritanism versus values associated with the modern welfare state. It involves items concerning the use of alcohol, crime, need for self-discipline and antagonism to social welfare measures (p. 129).

Although Likert scales analogous (in terms of items) to the five components turn out to be quite reliable (split half reliability), the rotated principal components had better predictive value regarding the Canadian judges’ sentencing behaviour. This finding was obtained through regression analyses. Before drawing any definite conclusions about the impact of judicial attitudes on judges’ sentencing behaviour, Hogarth’s analyses proceeded with including variables related to the cases dealt with, and legal, social and situational constraints. Results showed sentencing by Canadian magistrates
(…) as a dynamic process in which the facts of the cases, the constraints arising out of the law and the social system and other features of the external world are interpreted, assimilated, and made sense of in ways compatible with the attitudes of the magistrate concerned (Hogarth, 1971, p. 343).

These findings concur with Hogarth’s view of attitudes as important information-processing structures. Although the judicial attitudes themselves may not be the most important single factor determining the outcome of a sentencing process, they play an important role in the way judges perceive (filter) the world around them (p. 367).

Hogarth was among the first to systematically analyse the sentencing process in a quantitative manner using a wide range of independent variables including judges’ attitudes. Although criticisms regarding some of the methods are possible[vii], the study had considerable impact and served as an important impetus for future research.

Examples of more recent studies in which similar quantitative approaches to the measurement of (penal) attitudes were used, include those carried out by Carroll et al. (1987) and by Ortet-Fabregat and Pérez (1992). Carroll et al. set out to find coherent patterns of association (‘resonances’) among sentencing goals (‘penal philosophies’), causal attributions, ideology and personality. They described two studies: one with law and criminology students and one with probation officers, both in Chicago, U.S. They factor-analysed a pool of 104 sentencing goal items.[viii] Three meaningful factors emerged from the analysis:
satisfactory performance of the criminal justice system, punishment (harsh treatment) and rehabilitation.

Subsequently, for further analyses, the highest loading items were selected for inclusion in summated rating scales (i.e., Likert scales).

The same procedure was applied to construct scales for attributions of crime causation, ideology and personality. For both students and probation officers, further analyses indicated two types of coherent patterns among the variables. The first revealed a conservative and moralistic pattern: a punitive stance toward crime; belief in individual causes of crime; lower moral development of offenders; authoritarianism; dogmatism; and political conservatism. Carroll et al. viewed the second pattern as being more liberal in nature: rehabilitation; deterministic view on causes of crime; higher moral development of offenders; and belief in the powers and responsibilities of government to correct social problems (Carroll et al., 1987).

Ortet-Fabregat and Pérez (1992) discussed two studies aimed at describing and comparing attitudes of different types of professionals within the criminal justice system in Catalonia, Spain toward causes, prevention and treatment of crime. The first study used a sample of students, while the second study used rehabilitation teams and social workers from prisons, prosecutors, judges and lawyers, corrections officers and police officers. The main purpose of the first study was to develop scales measuring the attitudes towards causes of crime (cf. Carroll et al., 1987), prevention, and treatment. The authors’ approach to the selection of items was eclectic, theoretical and phenomenological. They eclectically obtained items from existing attitude scales (e.g., Brodsky & Smitterman, 1983), theoretically from scientific literature about the topics and phenomenologically from communication with professionals in the criminal justice system. Causes of crime were represented by 22 items, prevention by 25, and treatment by 22. Each set of items was separately analysed using Principal Components Analysis with orthogonal rotation. Two principal components appeared to underlie attitudes toward causes of crime: hereditary and individual causes, and social and environmental causes. Analysis of the prevention items also resulted in two components: coercive prevention and social intervention prevention. Analysis of the treatment items resulted in one substantive underlying component, which was labelled assistance versus punishment. Analogous summated rating scales (i.e., Likert scales) were constructed for subsequent use in the second study with criminal justice professionals. The second study aimed at describing and comparing mean scores on the attitude scales between the various professional groups in the sample. Results indicated that, overall, a social and rehabilitation approach to the causes, treatment and prevention of crime was favoured (Ortet-Fabregat & Pérez, 1992). Apart from this overall impression, any differences found were in the directions that could be expected considering the different professional roles of the groups. For instance, rehabilitation teams and social workers from prisons were less favourable towards coercive prevention and more favourable towards social intervention prevention than were law enforcement officers.

Single measures
Single measures generally focus on concrete sentencing goals, such as rehabilitation, retribution and deterrence. Respondents are either asked to indicate their favourableness toward the concepts on separate rating scales or requested to rank a number of sentencing goals. Some of the studies concern ratings for sentencing goals in general whilst others relate to specific cases. Examples of studies in which such measurement procedures are used include those carried out by Forst and Wellford (1981), Henham (1990), and Bond (1981).

To provide an empirical foundation for the formulation of sentencing guidelines for the federal court system in the U.S., Forst and Wellford carried out an extensive survey on the goals of sentencing and perceptions of sentencing disparity. They conducted interviews with 264 federal judges, 103 federal prosecutors, 110 defence attorneys, 113 probation officers, 1248 members of the general public, and 550 incarcerated federal offenders (Forst & Wellford, 1981). Respondents were asked to rate the importance that they in general attached to general deterrence, special deterrence, incapacitation, rehabilitation, and just deserts on five-point scales. In order to improve validity of the measurement, all respondents were first provided with definitions of these concepts. Judges were also asked about the severity of their sentences when, for a given case, they had a specific sentencing goal in mind. Furthermore, the general ratings for the sentencing goals were used to explain judges’ sentencing decisions in 16 hypothetical cases. Results indicated that among judges general and special deterrence were found to be especially important, followed, in decreasing order of importance, by incapacitation, rehabilitation and just deserts. Prosecutors and probation officers also found deterrence and incapacitation more important than rehabilitation and just deserts. Among defence attorneys and prison inmates, rehabilitation received strongest support. Judges indicated that rehabilitation, if intended, clearly makes a sentence more lenient. Using the hypothetical cases, with length of the prison term as dependent variable, regression analyses showed that judges’ perceptions of the goals of sentencing could explain 40 percent of the variance.

Henham (1988; 1990) examined English magistrates’ sentencing ‘principles’ as well as their sentencing behaviour. Henham interviewed 129 magistrates using structured questionnaires. He asked the magistrates to rate the general sentencing objectives of reformation, punishment, general deterrence, individual deterrence and protection of society on five-point scales.[ix] Furthermore the magistrates were asked to select a particular sentencing objective for each of five hypothetical criminal cases. Results showed that, in general, English magistrates attached greatest importance to protection of society, followed by, in decreasing order of importance, individual deterrence, general deterrence, punishment and reformation. Correlations between these ratings led Henham to speculate that magistrates find it difficult to discriminate amongst the various objectives (p. 115). However, this may well be due to error resulting from Henham’s measurement method (i.e., single measures). Furthermore, magistrates appeared to be consistent in terms of the general and case specific views that they hold themselves. However, contrary to Hogarth’s findings, Henham found no evidence to “support the view that penal philosophy is a particularly important mechanism in the selective perception of information regarding legal constraints by sentencers” (Henham, 1990, p. 151).

Bond and Lemon (1981) carried out a study among 157 English magistrates to determine the effect of experience and training on importance attached to sentencing objectives and sentencing behaviour. Respondents were asked to give a general rating of importance for individual deterrence, general deterrence, reformation, retribution, and protection of society. Subsequently for eight hypothetical cases, judges were requested to indicate the appropriate sentence. Results indicated that as a result of experience, magistrates became less inclined to perceive their role in sentencing as one concerned with reformation of offenders and more inclined to see it as concerned with deterrence and protection of society. Furthermore, increasing experience leads to less sympathetic views of offenders (p. 133). Training, which magistrates receive on the bench, appeared to moderate these effects.

Apart from measuring favourableness toward certain sentencing goals with rating scales, several other methods have sometimes been used. Some researchers asked respondents to mention the goal(s) they aim to achieve with a sentence either in a general sense, or in the context of a specific case. An example of such an approach is Kapardis’ research.[x] Kapardis (1987) used nine cases with 168 English magistrates. Judges were asked to pass sentence and indicate which goal(s) they wanted to achieve. The most frequently stated aim among magistrates was individual deterrence, followed by punishment, reform, protection of society, general deterrence, denunciation and reparation. However, widely different sentences were sometimes given in the same case and with the same penal aim in mind.

Kapardis found no consistency between judges’ penal philosophies (in terms of sentencing objectives) and punitiveness in sentencing behaviour (p. 198). A second example of a study concerning judges in criminal courts using other methods than rating scales, is the study carried out by Bruinsma and Van Grinsven (1990). Although this study was not directly focused on measuring individual penal attitudes it is an exception to the general lack of quantitative studies in the Netherlands in this area of research. Bruinsma and Van Grinsven chose abstract sentencing goals as the starting point of their analyses. Propositions were deduced from these sentencing goals. For instance, concerning the sentencing goal of general prevention, the deduced proposition was: ‘The more serious the offence, the harsher the punishment’ (Bruinsma & Grinsven, 1990, p. 136). In order to empirically test these propositions, Bruinsma and Van Grinsven transformed them into decision rules, incorporating case- and offender characteristics. Assuming that the amount of material damage is a good indicator for seriousness, the resulting decision rule for the above proposition was: ‘The greater the material damage caused by the offence, the harsher the punishment’ (p. 136). The researchers realised that if they found empirical confirmation for the decision rules, it would not necessarily imply that the ‘underlying’ sentencing goals had indeed been aimed for.

This is due to unavoidable difficulties involved in inferring underlying purposes from the actual practice of sentencing discussed in Section 3.3. Instead, they argued that failure to empirically confirm a decision rule does merit the conclusion that the underlying sentencing goal had not been applied. In the above manner, propositions and decision rules were deduced from a number of sentencing goals. Bruinsma and Van Grinsven tested their decision rules using a random sample of 1210 cases heard by police judges at district courts in the Netherlands. Results indicated that Dutch police judges are only to a limited extent guided by the decision rules that were deduced from sentencing goals.

3.4.2 Qualitative research
In this section we will discuss examples of qualitative research carried out in the Netherlands. The reason for this decision is that research on attitudes among Dutch criminal justice officials in general, and judges in particular, is very scarce (Frijda, 1996; Van Duyne & Verwoerd, 1985; Van Koppen, Hessing, & Crombag, 1997). In so far as Dutch research directly or indirectly involved (penal) attitudes, views or opinions, it has been predominantly qualitative in nature. The methods used involve interviews, dossier and protocol analysis, discussion groups, and participant observation. As such, this section not only illustrates relevant methods of qualitative research, but also outlines the general state of affairs of such research in the Netherlands. The studies discussed include those carried out by Enschedé et al. (1975), Van der Kaaden and Steenhuis (1976), Van Duyne (1983; 1987), Van Duyne and Verwoerd (1985), Kannegieter and Strikwerda (1988), and Kannegieter (1994).

From 1952 until the end of 1954, Enschedé kept systematic notes of the cases he heard as a police judge[xi] in the District Court of Rotterdam. His notes on 244 cases of theft in the Rotterdam harbour area were later analysed by Moor-Smeets (Enschedé et al., 1975, pp. 25–58). Because Enschedé found it difficult to motivate his sentences in more than superficial terms and frequently lacked the time to register his motivation, analysis of the reasons for the sentences was seriously impaired. However, perusal of the sentences passed in relation to characteristics of the offences, together with a general disregard for characteristics of offenders, led Moor-Smeets to speculate that Enschedé’s point of view was more likely to be general preventive in nature than special preventive (p. 41).

Following the analyses by Moor-Smeets, Swart (Enschedé et al., 1975, pp. 59–93) attempted to concentrate in greater detail on judicial views and opinions on sentencing. He combined two methods of investigation.

First, subjects were asked to pass sentences in nine versions of a hypothetical theft case. Participants were also asked to motivate their judgement.

Second, after passing and motivating the sentences, participants discussed their decisions and views with each other. Eleven such sessions were held in ten different districts in the Netherlands, with a total of 162 participants. Most participants were members of the judiciary (judges and prosecutors). Results indicated substantive variation in sentencing decisions and motivations within each version of the case. Since participants received the same hypothetical cases, Swart points to personality characteristics of participants as the most probable cause of this variation (p. 81).

With reference to Hogarth’s research findings, Swart speculates about the selective perception and interpretation of case characteristics by participants as a result of their personal views (p. 62, p. 82). However, incompleteness and superficiality of the written motivations provided by (only half of the) participants offered only fragmentary insight in such factors. In discussing the cases, participants showed clearly differing opinions on sentencing objectives. In each case, a wide variety of objectives was endorsed by different participants. Moreover, participants seemed to lack a common frame of reference for discussing sentencing objectives with each other. Furthermore, participants who had different objectives in mind passed the same sentence, while participants with the same objectives in mind passed different sentences (p. 83). The general impression emerging from these analyses was not one that conforms to the idea of sentencing as a rational, goal-orientated practice.

Van der Kaaden and Steenhuis examined prosecutors’ views and behaviour in the Arnhem jurisdiction[xii], the Netherlands (Van der Kaaden & Steenhuis, 1976). The first stage in their research involved a questionnaire in which participants were asked to determine and motivate a sentence in two (real) robbery cases. Subsequently, after inventarisation of responses, discussion groups were organised with the prosecutors in each district in the region. In the discussion groups, participants were asked to explain their sentencing decisions and motivations. The prosecutors were encouraged to comment on each other’s responses. Results showed large variations in sentencing demands in both cases. For instance, in one of the cases, decisions varied from dismissal up to 12 months unconditional imprisonment with a compulsory hospital order. These differences could not be attributed to different views on sentencing objectives. As in Swart’s analysis, participants who had the same objectives in mind passed different sentences while participants who had different objectives in mind passed the same sentence. Because the meaning of the various sentencing objectives was obviously interpreted very differently by different prosecutors, a second round of discussions was organised. This time, the meanings of the objectives retribution, special and general prevention, affirmation of norms, and conflict resolution were extensively discussed. Confusion about the meaning of these concepts abounds. Like Swart, Van der Kaaden and Steenhuis conclude that sentencing does not appear to be a very rational practice. Rather, in essence, sentencing appears to be a highly personal matter (p. 19–20).

Van Duyne carried out two observation studies, one with prosecutors (1983; 1987), the other with judges in the plural chamber of a district court (1987; 1985). In order to gain more insight into the decision making processes of prosecutors, Van Duyne focussed on seven prosecutors at the District Court Alkmaar, the Netherlands. He asked them to think aloud while handling ten real cases. Van Duyne found the decision making processes of the prosecutors to be less complicated than expected. The decision making appeared to be one-dimensional: prosecutors selected only those characteristics of a case for consideration which were consistent with a particular ‘dimension’. Examples of such dimensions are ‘professionalism’, ‘social misfit’ or ‘rehabilitation’ (Van Duyne, 1987, p. 147).

Despite this ‘simple decision making’, large discrepancies were found in sentencing demands in each case. Reasons for these discrepancies, Van Duyne argued, include the fact that prosecutors may differ substantially in their choices of the dimensions, in the weights attached to the selected characteristics of a case and in their opinions about proper punishment (Van Duyne, 1987, p. 147). Furthermore, unless specifically requested, very few prosecutors mentioned sentencing objectives. When asked specifically, retribution and prevention were the most frequently mentioned sentencing objectives. According to Van Duyne the fact that most prosecutors did not initially mention sentencing objectives should not be taken to imply that such objectives are irrelevant: purposeful action does not necessarily require decision making with prominent and clearly formulated objectives in mind (Van Duyne, 1983, p. 189). Sentencing objectives, Van Duyne concluded, do play an important role, but this is at a more implicit level and only among a wide range of individual variables related to perceptions of the working environment and task conception.

Through participant observation,[xiii] Van Duyne and Verwoerd (Van Duyne, 1987; 1985; Verwoerd, 1986) examined the collective decision making processes in a panel of judges sitting at one of the district courts in the Netherlands. They attended deliberations in chambers and later analysed 27 transcripts. Punishment objectives such as rehabilitation, retribution or deterrence were seldom mentioned explicitly in the deliberations. Moreover, the decision making seemed very casual to the extent that one of the researchers compared it to haggling in the marketplace (Van Duyne, 1987). No indication was found between sentencing objectives perceived by judges and their actual sentencing behaviour (Verwoerd, 1986). However, the absence of overt verbal statements and discussions pertaining to sentencing objectives does not necessarily imply such considerations to be unimportant for the individual judges (cf. De Keijser, 1999; Van den Heuvel, 1987).

Kannegieter and Strikwerda (Kannegieter, 1994; 1988) set out to examine disparity in sentencing in minor criminal cases. They focused on public prosecutors’ and judges’ views on sentencing. In 1987 they interviewed 18 prosecutors and 17 police judges in the district courts of Leeuwarden, Groningen and Assen, the Netherlands. In the first part of the interview, respondents were asked to demand (prosecutors) or pass (judges) a sentence on a written case that they received some time before the interview. Some information pertaining to personal characteristics of the offender was omitted in the case dossier in order to determine the relative importance of such factors. The additional information was only given if a participant asked for it. After participants had made their decision, they were asked to motivate it. Results showed a great deal of variation in decisions on this one case. The type and severity of punishment could not be consistently related to sentencing objectives. Answers to questions about sentencing objectives were given in very superficial terms. In general, however, there seemed to be agreement that special prevention was the main objective in their sentencing decisions. Despite such agreement on the main general goal, means to attain that goal were viewed very differently (Kannegieter & Strikwerda, 1988, pp. 60–61). Furthermore, almost half of the judges stated their scepticism about the realisation of sentencing objectives.

3.4.3 Some final remarks
In summary, a number of widely used quantitative and qualitative approaches to the measurement of attitudes, opinions or views in judicial settings have been discussed. Most of the studies were aimed at explaining sentencing behaviour using psychological (attitudinal) characteristics of the sentencer. The findings of these studies seem to vary as much as the sentencing behaviour that most researchers report. In this chapter, the studies discussed were used mainly as examples of different measurement approaches. However, even if we had carried out an exhaustive literature review, given the wide variety of methodologies and types of respondents, it would have been extremely difficult to draw general conclusions. Perhaps a meta-analysis (cf. Mullen, 1989; Rosenthal, 1984) of such studies would provide some more general insights. Such a meta-analysis would require coding of variables such as research method, type and number of respondents, types of cases used, year of research and country of research. Concerning the Dutch situation, there is one aspect that seems to emerge from all the qualitative research reviewed. This concerns the confusion or disagreement among criminal justice officials about the meanings of various sentencing objectives as well as the researchers’ inability to find consistencies between sentencing philosophies and sentencing behaviour.

Despite such findings, most authors still allot an important role to the personal views of sentencers. Frequently this is done in a way similar to Hogarth, by stating that psychological characteristics determine the way in which people perceive and interpret the world around them. Concerning the views of the participants in the different studies, one cannot escape the impression that opinions about goals and functions of punishment are not very relevant or interesting to them. Of course this does not necessarily imply that such attitudes or opinions are absent or do not play a role in a less obvious or indirect manner.

NOTES
i. For a detailed critical discussion of the separate elements in Allport’s definition of attitude, see McGuire (1969).
ii. See Summers (1970) and Fishbein (1967) for these and other scaling techniques.
iii. In 1993, the Council of Europe has strongly recommended its member states to explicitly express ‘sentencing rationales’ in their Penal Codes in order to reduce inconsistency in sentencing (cf. Council of Europe, 1993). These recommendations reflect a firm believe in the relevance and impact of theoretical and philosophical concepts for the practice of sentencing.
iv. For a critical discussion on the absence of justification and purposes of sentencing in Dutch Penal Code, see Nagel (1977, pp. 30-40). See also Walker (1985, pp. 105-106) who critically argues that many penal statutes’ silence on the purposes of punishment is deliberate and has political reasons.
v. The term Likert-type scale is frequently used for the method of scoring, implying (usually) a five-point scale ranging from ‘completely agree’ to ‘completely disagree’. Furthermore, an integral part of the Likert procedure is determining internal consistency of the summated scale through item analysis.
vi. Preparatory work carried out by I. Bakker has been very helpful as the basis for the following sections. See Bakker (1996).
vii. For instance, one might argue that Hogarth’s phenomenological approach for deriving attitude scales involves a circular aspect. The scales were derived from evaluative statements of the same population to which they are applied. Furthermore, orthogonal rotation of the principal components yields uncorrelated scales: such orthogonality is artificial and may not do justice to meaningful and important correlation between particular attitudes.
viii. How exactly this pool of items was obtained, remains unclear. The authors mention that the items were selected from a larger pool of items which was written to reflect the dimensions under study (Carroll et al., 1987, p. 110).
ix. Henham used and adapted Hogarth’s purposes of sentencing (Henham, 1990).
x. A similar approach was chosen by Ewart and Pennington (1987).
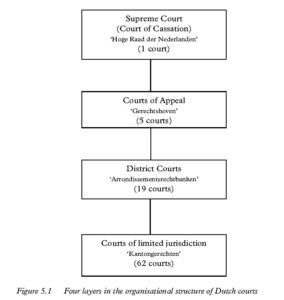
xi. See Section 5.2 for an introduction to the organisation of Dutch criminal courts.
xii. That is, ‘Hofressort’ Arnhem: see Section 5.2.
xiii. One other example of research with participant observation in a judicial setting is Van de Bunt’s research (1985) on decision making by public prosecutors in the Netherlands.


Punishment And Purpose ~ Development Of A Measurement Instrument

Justice4.1 Introduction
In Chapter 3, the concept of penal attitude was examined in some detail. Furthermore, the point was made that, while research on psychological characteristics of magistrates is quite common in some other countries (e.g. United States, England, Canada, Germany), in the Netherlands this type of research seems to be a ‘blank spot’ (Snel, 1969). The few (predominantly qualitative) studies that were carried out have led to rather inconclusive results concerning magistrates’ penal attitudes. Furthermore, no systematic quantitative study on this topic has been carried out in the Netherlands thus far. We consider this to be a serious deficiency in criminological and psychological research on the Dutch magistrature.
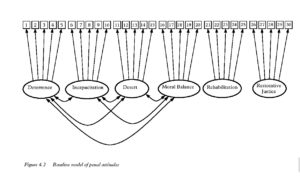
The present chapter therefore focuses on the systematic process of developing a theoretically informed measurement model of penal attitudes. Section 4.2 discusses the measurement approach that we have adopted. However, our approach, like any other, is accompanied by a number of methodological and practical concerns. Each of these will be given due attention. Section 4.3 elaborates on the process of translating the relevant theoretical concepts into measurable variables (i.e., operationalisation) resulting in an initial version of the measurement instrument. In Section 4.4, the procedure and results of the first application of the instrument with Dutch law students (N=266) are discussed. Implications of this study for subsequent refining or revising the measurement instrument are then considered in Section 4.5. Section 4.6 describes the further steps in the development of the measurement instrument. The procedure and results of a second empirical study with Dutch law students (N=296) are reported. The results of this second study are compared to those of the first study thus allowing a measure of reliability (i.e. replicability) to be obtained. Finally, in Section 4.7, results of the second study with law students are used as the foundation for a basic (structural) model of penal attitudes. To further validate the measurement instrument, to confirm results of the studies with law students and to explore the structure of penal attitudes, this model will be tested in Chapter 6 using data collected from judges in Dutch criminal courts. The position we adopt is that the development of a theoretically integrated model of penal attitudes contributes to a better understanding of how moral legal theory becomes translated into practice by criminal justice officials.

4.2 Measurement approach
We have opted for a quantitative approach to the measurement of penal attitudes. Several considerations guided this choice. The point of departure is a theoretical one. The interest is in determining whether concepts that are central in moral legal theories are measurable and meaningful for Dutch judges. Furthermore, we want to unveil the general structure of penal attitudes held by Dutch judges. These goals imply the use of (inferential) statistics which require quantitative data. We believe that a scaling approach designed to measure penal attitudes using more indirect questions (items) related to the theoretical concepts will yield most valid results. Given previous Dutch experiences with qualitative research involving judges’ views (see Section 3.4.2), the efficacy of such an approach for our purposes is questionable. The qualitative studies reviewed in the previous chapter show that Dutch judges (and prosecutors) rarely reveal their penal philosophies spontaneously. Direct questioning concerning magistrates’ penal attitudes mostly yielded superficial answers and showed that there was much confusion about the meaning of the relevant concepts. Our approach may shed more light on the personal views of judges than has been achieved with more qualitative approaches.

Research using such a quantitative approach has its own specific requirements related to validity, reliability and sample size. A further concern is related to the specific population of interest to the study. As a result of training and experience, judges tend not to think in terms of general problems in law and sentencing. Unlike the social scientist who aims at generality, judges are used to reasoning within the framework of a specific case. In other words, they are accustomed to interpreting and perceiving problems in the light of specific cases (Vranken, 1978). This may have consequences for judges’ perception of, and willingness to respond to, general questions in structured questionnaires.

Given our preference for a quantitative scaling approach to the measurement of penal attitudes, two further decisions needed to be made. The first was the choice between using single or multiple measures for measuring the relevant concepts. As discussed in Section 3.4, given reliability and validity problems related to single measures of theoretical concepts, multiple measures appear preferable. This choice seems to be especially relevant given the fact that most qualitative research found a lot of confusion among magistrates about the meanings of concepts related to functions and goals of punishment. A subsequent decision relates to the method for selecting suitable items. The choice between a phenomenological and a theoretical approach to selecting items was quite easy. Because of our explicit theoretical point of departure, a theoretical approach to item selection was the obvious choice. Moreover, the definition of our attitude objects (see Section 3.2) logically implies such a theoretical approach for selecting attitude statements.

4.3 Selection and formulation of attitude statements
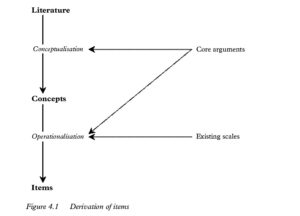
The theories discussed in Chapter 2 represent our point of departure for the process of selecting and formulating attitude statements. Deriving attitude statements first involved conceptualisation of the theories, followed by a phase of operationalisation. Within each approach, we identified the central concepts. Given our discussions in Chapter 2, many of these concepts were quite evident from the outset. The process of identifying central concepts was further complemented and facilitated by studying and selecting core-arguments from the relevant theoretical literature. Such core arguments were statements taken from the literature which we believed to reflect the central issue(s) of a particular approach. At this empirical stage of the study we looked at the relevant theories from an operational point of view. This resulted in the decision not to consider some of the sophisticated metaphysical concepts and arguments for the measurement instrument.[i]

Conceptualisation was followed by operationalisation into attitude statements. The selected core-arguments from the literature and examples from some existing attitude scales constructed by others (cf. Carroll, Perkowitz, Lurigio, & Weaver, 1987; Hogarth, 1971; Ortet-Fabregat & Pérez, 1992) proved to be helpful tools for operationalising the theoretical concepts.[ii] Great care was taken to make sure that each theoretical concept was represented by multiple statements (items). In a later stage, statistical criteria were applied to select the best items from the initial item pool.

The process of conceptualising Utilitarianism resulted in the prevention of future crime through deterrence, incapacitation and rehabilitation.[iii] For Retributivism the central concepts were (just) desert, infliction of suffering, temporal perspective on past behaviour, and restoring the moral balance in society. The central concepts in the Restorative Justice approach were orientation on victim, active role for offenders, crime as a social conflict, reparation and compensation, and discontent with the current criminal justice system.

The expressive function of punishment (censuring and affirmation of norms)[iv] was found to play a role in all three approaches in one way or the other. Thus, because the expressive function of punishment is not expected to differentiate between the approaches, it was considered to be unsuitable for subsequent operationalisation.

Punishment4.1

Derivation of items

Some examples of core arguments and final attitude statements for the relevant theoretical approaches best illustrate the process of conceptualisation and operationalisation. Examples of arguments from the utilitarian literature are:
The obligation of judges, correctional officials, and legislators to serve the public implies that they have a moral duty to try to reform offenders (…) (Glaser, 1994, P. 722). (P)unishments and the means adopted for inflicting them should, consistent with proportionality, be so selected as to make the most efficacious and lasting impression on the minds of men (…) (Beccaria, 1764/ 1995, p. 31).

Punishment must not be employed at all if it is inefficacious or unprofitable through creating more misery than it prevents, or if it is needless in the sense that the mischief of an offence can be checked by non-punitive measures and so at a ‘cheaper rate’ (Hart, 1982, p. lxi).

The above arguments reflect the concepts of rehabilitation, deterrence, and the guiding principle of utility. These arguments proved helpful in formulating the following attitude statements:
The central focus of the criminal justice system should be on the principle of correction.
The potential for general prevention should determine the severity of punishment. If there is no advantage to be gained from punishment, it should either be waived or be purely symbolic in nature.

Similarly, core-arguments from retributive literature were extracted. Arguments from retributive literature led to identifying, amongst others, the concept of moral balance. A disrupted moral balance can be restored through, for instance, annulling unfairly gained advantages.[v] Some resulting attitude statements are:
By means of punishment, an unfair advantage is annulled.
By undergoing punishment, a criminal pays off his debt to society.

The latter statement is an example of one inspired by an existing item used by Hogarth:
Criminals should be punished for their crime in order to require them to repay their debt to society (Hogarth, 1971, p. 130).

Concerning the Restorative Justice approach, examples of core-arguments selected from the literature are:
A new criterion for evaluating the process is introduced: that it should be satisfactory for both parties, not only the victim but also the offender (Wright, 1991, p. 113). Aiming at the resolution of a conflict and the reparation of the loss seems to be more constructive for social life than balancing an abstract juridico-moral order (Walgrave, 1994, p. 68).

Reparation should encourage the reintegration of victims into legal proceedings as individuals with justified claims. Victims should receive active support in obtaining reparation, and this right should have priority over punishment by the state (Messmer & Otto, 1991, p. 2).

These extracts from the Restorative Justice literature reflect some central concepts in this approach. Corresponding attitude statements include:
The victim of a crime should be allotted a central position in criminal proceedings.
The best form of punishment is one which, given the harm caused by the crime, maximises the possibilities for restitution and compensation.
The resolution of conflict is a neglected goal in our criminal justice system.
A criminal process can only be qualified as a success when both offender and victim are satisfied with the outcome.

Following this pattern, operationalisation of the main theoretical concepts resulted in an initial pool of 76 items. Before proceeding to apply the measurement instrument to a sample of law students, this pool of 76 attitude statements was further refined in two ways.

First, two Dutch criminal law students were given a questionnaire containing the 76 items.[vi] Each item could be responded to using a five-point scale ranging from 1 ‘completely disagree’ to 5 ‘completely agree’. After the students had completed the questionnaire, each item was extensively discussed in a subsequent evaluation session. They were encouraged to comment on any aspect of item-wording or content that they found unclear or confusing.

Second, after making the necessary adjustments to a number of items, the revised questionnaire was extensively discussed with a professor of criminal law at Leiden University who also works as a deputy judge.[vii] This latter session completed the fine-tuning phase.

4.4 Study I[viii] 
The aim of this study was to explore and interpret the underlying structure in Dutch law students’ responses to the attitude statements. As such, the analyses would give a first indication of the usefulness of the measurement instrument. Is the instrument effective for consistently discerning various underlying concepts or, put in another way, can the instrument effectively measure penal attitudes? If the instrument would fail to discriminate between theoretically meaningful concepts, serious doubts either about the validity of the instrument or about the existence of the attitudes it is supposed to measure would have to be considered.

Furthermore, statistical criteria in conjunction with theoretical concerns have been used to select items from the initial pool of 76 items. In this way, the most adequate items for subsequent studies are singled out. Finally, results of Study I have been used to identify deficiencies in the measurement instrument which also led to necessary revisions that wouldhave to be made.

4.4.1 Data collection and sample
For study I, data were collected from (criminal) law students at the University of Groningen, Erasmus University Rotterdam, University of Nijmegen, and Leiden University. In February 1996, with the help of faculty staff, 374 questionnaires were distributed to students who were attending criminal law lectures. The questionnaire contained the 76 attitude statements in random order. Responses were to be given on five-point scales, ranging from ‘completely disagree’ to ‘completely agree’. Completed questionnaires were returned in pre-paid response envelopes. Students who returned the completed questionnaire received a giftvoucher with a monetary value of 10 Dutch Guilders (about US $ 5).

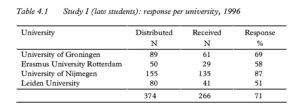
Table 4.1 Study I (law students): response per university, 1996

Table 4.1 Study I (law students): response per university, 1996

Within one month, 266 completed questionnaires were returned, yielding an overall response rate of 71 percent. Table 4.1 shows the response rates per university. The Table shows response rates to vary from relatively low in Leiden (51%) to exceptionally high in Nijmegen (87%). All questionnaires returned were completed with notably few missing responses. The average age of the law students in the sample is 22.9 years (standard deviation 3.3). More than half (52%) of the respondents were between 18 and 22 years old. The majority of the students in the sample were female (59%), with the Erasmus University Rotterdam showing the highest proportion of females (76%). Most students (64%) were either in their third or fourth year of law study. The remaining 36 percent were all second year law students from Nijmegen.

4.4.2 Analysis and results
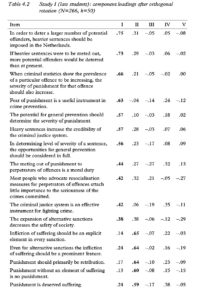
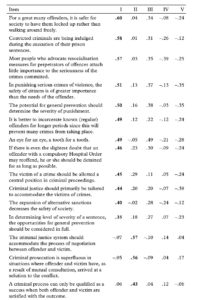
Principal components analysis (PCA) with orthogonal (varimax) rotation of the axes was first used to explore the underlying structure in the data. [ix] Primary criteria for determining the number of principal components to retain were the ‘scree’ graph (a plot of the latent roots or ‘eigenvalues’ against components) and interpretability of components. Inspection of the ‘scree’ graph suggested retaining five principal components.[x] Interpretation of these five components was quite straightforward (see below) and related eigenvalues were greater than one. As such the analysis with the 76 items resulted in an initial solution with five principal components. Next, our aim was to select the most adequate items from the initial pool of 76.

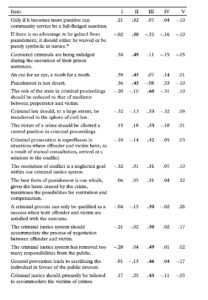
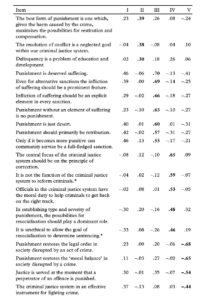
Using statistical criteria, we wanted to identify items that contributed little to this solution and could therefore be left out of subsequent analyses. It was decided that items had to exceed a component loading of 0.4 on any of the five components after rotation. Twenty-six items that did not meet this criterion were removed. Further inspection of these 26 items, revealed that they could be considered either too complex or ambiguous in wording. Subsequently, the analysis was repeated with the 50 remaining items. The five principal components (after varimax rotation) resulting from the analysis on these items were essentially the same as in the initial analysis and were readily interpretable. These principal components accounted for 40% of the total variance in responses. Table 4.2 shows the 50 attitude statements and their respective component loadings on five principal components.

Table 4.2 Study I (law students): component loadings after orthogonal rotation (N=266, k=50)

Table 4.2a Study I (law students): component loadings after orthogonal rotation (N=266, k=50)

The first principal component involves items related to general prevention, mainly through (general) deterrence, and was labelled Deterrence. The second component contains items that refer to deserved suffering and ‘harsh treatment’. Subsequently, this second component was labelled Desert. All items which have high loadings on the third component relate to the various aspects of the Restorative Justice approach. Subsequently, it was labelled Restorative Justice. The fourth component involves items related to restoring a disrupted moral and legal order in society. It involves the general retributive justification for the practice of punishment (cf. Chapter 2). This component was labelled Moral Balance. The fifth and final component concerns statements which predominantly focus on personality and deficiencies of offenders and potential for reform or correction. This fifth component was labelled Rehabilitation.

Punishment4.1.2

Table 4.2b Study I (law students): component loadings after orthogonal rotation (N=266, k=50)

Table 4.2c Study I (law students): component loadings after orthogonal rotation (N=266, k=50)

Table 4.2c Study I (law students): component loadings after orthogonal rotation (N=266, k=50)

Table 4.2d Study I (law students): component loadings after orthogonal rotation (N=266, k=50)

Table 4.2d Study I (law students): component loadings after orthogonal rotation (N=266, k=50)

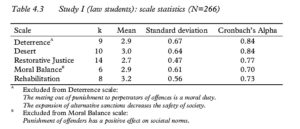
According to this five-dimensional structure underlying responses to the attitude statements, summated rating scales were constructed. The items included in the scales are the same as the high loading items on the separate principal components in Table 4.2. To determine internal consistencies of the scales, item analysis was carried out. Cronbach’s Alpha was calculated for each separate scale.

Table 4.3 shows the scale labels, number of items included in each scale (k), means, standard deviations and Cronbach’s Alphas. For theoretical reasons, three items were excluded from the rating scales. These items are noted at the bottom of table 4.3. The reported means and standard deviations were computed after the summated scales had been divided by their respective numbers of items. The table shows that, in this study, Deterrence yields an Alpha of 0.84, Desert 0.84, Restorative Justice 0.77, Moral Balance 0.70, and Rehabilitation 0.73. These Alphas indicate internal consistencies of the scales to be ranging from quite acceptable to good.

Table 4.3 Study I (law students): scale statistics (N=266)

Table 4.3 Study I (law students): scale statistics (N=266)

Results of Study I suggest that Deterrence and Rehabilitation, stemming from the utilitarian approach, are clearly distinguishable and measurable components in penal attitudes. The retributivist items form two separate attitude scales: restoring the Moral Balance and Desert. Attitude statements referring to the various components of Restorative Justice all converge on one Restorative Justice dimension. As such, Restorative Justice is the only approach among the three that can empirically be represented by a single homogeneous attitude scale. Empirically, restorative justice, therefore, seems to offer a more integrated account of punishment than the other approaches. Through the process of item analysis, the five summated rating scales were shown to be internally consistent.

One of the goals of this study was to identify deficiencies in the instrument. Reviewing the scales that emerged from the analyses, reveals that one of the central concepts in the utilitarian approach, Incapacitation, did not emerge as a separate dimension. Instead, most incapacitation items were among the 26 removed after the initial analysis. Further inspection of the original incapacitation items led us to believe that the failure to reproduce this dimension is due to a flawed formulation of the relevant attitude statements. Since incapacitation is one of the central concepts in the utilitarian approach, it was decided to formulate a number of new Incapacitation-items for subsequent studies. The procedure adopted will be discussed in more detail in the next section.

The final question posed to the students asked them to report any difficulties they encountered in responding to the attitude statements. Almost 37 percent of the students responded to this question. Half of these responses were remarks concerning difficulties with the generalising and case-independent nature of the statements. This problem was anticipated in Section 4.2 above. Since all respondents conscientiously completed the questionnaires and response patterns appeared to be quite consistent and interpretable, the generalising nature of the statements seems to have been more of an annoyance to these students than a factor that seriously impeded the measurement. It was decided, however, that the generalising nature of the statements would need to be clearly justified and explained when dealing with judges in Dutch criminal courts.

In summary, the initial corpus of 76 items has been narrowed down to the 50 most adequate items. Principal components analysis and reliability analysis have shown these 50 items to form theoretically meaningful, readily interpretable and internally consistent scales for penal attitudes. However, new attitude statements pertaining to the utilitarian concept of incapacitation are required.

4.5 Revision
Before discussing procedure and results of the second study with law students, the formulation of a number of new Incapacitation items will first be discussed. This is an important step since the measurement instrument appeared to be seriously deficient in relation to this utilitarian concept.

The following procedure was used. A one-page questionnaire was distributed among all available colleagues at NISCALE (about 20). This number included some lawyers and a deputy judge. Some of the important general criteria which the formulation of attitude statements must meet (cf. McIver & Carmines, 1981; Swanborn, 1988) were first explained. Several examples of attitude statements were then given and the concept of Incapacitation was explained in some detail. Respondents were then asked to formulate one or more attitude statements pertaining to Incapacitation. This procedure produced 32 suggestions for statements. These were thoroughly reviewed after which eight statements were finally selected.

The resulting new attitude statements were:
* To ensure the safety of citizens, perpetrators of serious crimes should be incarcerated for as long as possible.
* For a great many offenders, it is safer for society to have them locked up rather than walking around freely.
* In punishing serious crimes of violence, the safety of citizens is of greater importance than the needs of the offender.
* It is better to incarcerate known (regular) offenders for longer periods since this will prevent many crimes from taking place.
* Unless the perpetrator of a serious crime receives an unconditional prison sentence, he will continue to pose a threat to society.
* If there is even the slightest doubt that an offender with a compulsory Hospital Order may reoffend, he or she should be detained for as long as possible.
* Locking up serious offenders makes no difference for safety in the streets.
* Career criminals ought to be punished more severely than others. These new items were incorporated in the questionnaire for Study II.

4.6 Study II
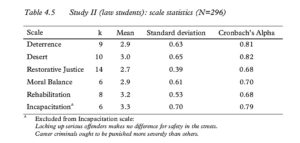
Study II was carried out with three objectives in mind. First, replicability of the five scales developed in Study I would be examined. Second, this study would signify a renewed endeavour to measure the important utilitarian concept of Incapacitation. The third objective of this study was to use the results as the foundation for formulating a baseline model representing the structure of penal attitudes. As such, Study II was to further the development of a theoretically integrated model of penal attitudes which is examined in Chapter 6 with data collected from Dutch judges.

4.6.1 Data collection and sample
For Study II, data were collected from (criminal) law students at two universities other than those used in Study I. It concerned the University of Utrecht and the University of Amsterdam. In January 1997, with the help of faculty staff, 496 questionnaires were distributed among law students attending criminal law lectures. The questionnaire contained 58 items in random order: 50 items from Study I plus eight new Incapacitation items.[xi] As in study I, responses were to be given using five-point scales ranging from ‘completely disagree’ to ‘completely agree’. Completed questionnaires were to be returned in pre-paid response envelopes. After returning the completed questionnaire, respondents received a giftvoucher with a monetary value of 10 Dutch Guilders (about U.S. $ 5).

The number of returned questionnaires was 296 in total, yielding a quite acceptable response rate of 60 percent. Table 4.4 shows response rates per university.

Table 4.4 Study II (law students): response per university, 1997

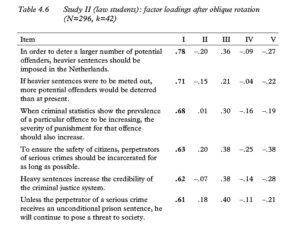
Table 4.4 Study II (law students): response per university, 1997

The average age of the law students in the sample was 23.2 (standard deviation 4.7) with 80 percent of the sample being between 18 and 24 years old. Furthermore, like in the first study, the majority (60%) of the law students was female. The proportion male to female students was roughly the same at both universities. The majority of respondents were either in their second (39%) or third (39%) year of law study. The remaining respondents were fourth year law students.

4.6.2 Analysis and results
The first goal of Study II was to examine the replicability of the rating scales extracted in the previous study. Five attitude scales, identical to those constructed in Study I, for Deterrence, Desert, Restorative Justice, Moral Balance, and Rehabilitation were formed and internal consistencies were re-examined. Furthermore, item analysis was carried out with the eight new Incapacitation items in an attempt to form an internally consistent rating scale for this concept.

Table 4.5 shows the scale labels, number of items included in each scale (k), means, standard deviations and Cronbach’s Alphas. As in the previous study, reported means and standard deviations were computed after the summated scales had been divided by their respective number of items. Results indicate that although most Alphas have dropped somewhat in value in comparison to those in Study I, the scales retain quite acceptable to good internal consistencies, with Cronbach’s Alpha’s ranging from 0.68 to 0.82. In other words, the scales of attitudes toward Deterrence, Desert, Restorative Justice, Moral Balance, and Rehabilitation, developed in Study I, have been shown to be replicable and to remain internally consistent with a different sample of law students.

Concerning the Incapacitation items, a scale including all eight items yielded a Cronbach’s Alpha of 0.72. Item analysis, however, revealed two items with very low corrected item-total correlation (0.16 and 0.11). Excluding these two items significantly improved internal consistency of the scale, resulting in an Alpha of 0.79. The excluded items are shown at the bottom of Table 4.5.

Table 4.5 Study II (law students): scale statistics (N=296)

Table 4.5 Study II (law students): scale statistics (N=296)

In summary, theory-based attitude scales have been constructed, refined and replicated. The scales display good internal consistencies. The central constructs in the three moral theories of Utilitarianism, Retributivism and Restorative Justice are meaningful and measurable concepts in the minds of Dutch (criminal) law students.

The true litmus test for the tenability of this theoretically integrated measurement instrument, however, must lie in the measurement of penal attitudes among judges. The third objective of Study II was therefore to use these data as the foundation for a baseline model representing the structure of penal attitudes. To further validate the measurement instrument, confirm results of the two studies with law students and examine the structure of penal attitudes, the baseline model was to be tested with data collected from judges in Dutch criminal courts. The development of this baseline model of penal attitudes using data from Study II is discussed in the next section.

4.7 Towards a structural model of penal attitudes
This section discusses the development of a baseline model of penal attitudes. The model is tested in Chapter 6 as a ‘structural equation model’. The purpose of constructing a structural model of penal attitudes is twofold. First, based on the results of the studies with law students, an attempt will be made to empirically confirm the structure of penal attitudes using data obtained from judges in Dutch criminal courts. Second, it is believed that a model of this type will deepen theoretical and empirical insights in the structure of penal attitudes among criminal justice officials.

Since the anticipated sample size of the study among magistrates was fairly Limited[xii], parsimony in the number of items to be selected for the structural model was an important concern. It was decided that factor analysis on the data of Study II using oblique (‘direct oblimin’) rotation of the axes would be the most appropriate technique for selecting items and modelling correlations between the underlying concepts. Factor analysis is the appropriate technique at this stage because it explicitly assumes the existence of an underlying theoretical structure. Analysis with oblique rotation allows for theoretically meaningful correlations between rotated factors. Furthermore, the analysis enables the researcher to formulate and apply objective criteria for excluding items.

Prior to the dimensional analysis, frequency tables of the separate items were inspected. Two restorative justice items[xiii] invoked relatively little variance in responses. Relatively few students agreed on these items while the others showed variations in degree of disagreement. Although these two items have been included in the Restorative Justice summated rating scale, the radical nature of these items was expected to invoke less variance among responses of Dutch judges relative to other Restorative Justice items. Given our concerns for parsimony in selecting items for inclusion in the structural model, the decision was made to exclude these two items from factor analysis and instead focus on items that were expected to invoke more variance in responses. The two Incapacitation items with low item to total correlations were also not considered for further analysis. The remaining 54 items were subsequently factor-analysed.

Concern for interpretability in combination with inspection of scree plots and eigenvalues (cf. Section 4.4.2) suggested a factor solution in five dimensions to be the most appropriate. This initial solution was very similar to the PCA solution of Study I (see Table 4.2), which is not surprising given the strong replicability of consistent rating scales reported in the previous section. To narrow down the set of items further, it was decided that to be included in further analyses, items would have to meet a factor loading of at least 0.35[xiv] on one of the five rotated factors. Twelve items did not meet this criterion and were subsequently removed. The remaining 42 items were re-analysed, extracting five factors.

In the resulting factor solution, the five rotated factors explain 36% of the shared variance in responses to the 42 attitude statements. Table 4.6 shows the factor loadings (i.e. structure coefficients) of the items on each of the five rotated factors. While we constructed six internally consistent rating scales in the previous section, only five dimensions emerged from this factor analysis. Inspection of Table 4.6 reveals the reason for this finding. The first rotated factor collapses Deterrence and Incapacitation items. Apparently, the (new) Incapacitation items correlate to such a degree with Deterrence items that, even though both concepts could be represented by strong separate rating scales (see Table 4.5), they are collapsed on one and the same dimension. If we were to interpret this common underlying dimension, we would call it ‘prevention through harsh treatment’.[xv] The second rotated factor is readily interpretable as a Restorative Justice factor.[xvi] The third factor represents Desert. The fourth factor covers Rehabilitation. The fifth and final factor is restoration of the Moral Balance.[xvii] Interpretation of this five-dimensional factor structure thus clearly concurs with results from Study I.

Table 4.6 Study II (law students): factor loadings after oblique rotation (N=296, k=42)

Table 4.6a Study II (law students): factor loadings after oblique rotation (N=296, k=42)

Punishment4.6b

Table 4.6b Study II (law students): factor loadings after oblique rotation (N=296, k=42)

Table 4.6c Study II (law students): factor loadings after oblique rotation (N=296, k=42)

Table 4.6c Study II (law students): factor loadings after oblique rotation (N=296, k=42)

Table 4.6d Study II (law students): factor loadings after oblique rotation (N=296, k=42)

Table 4.6d Study II (law students): factor loadings after oblique rotation (N=296, k=42)

As mentioned above, for reasons of parsimony, results of these analysis were used to select a limited number of items for inclusion in the baseline model of penal attitudes. The selection of items was influenced by two counteracting considerations. On the one hand, selecting few items would mean too narrow a theoretical representation of the respective concepts. Selecting many items to represent each latent variable in the model, on the other hand, would, given limited sample size, be undesirable from a statistical point of view. It was therefore decided that for each factor five items with the highest loadings per theoretical construct would be selected. Since the counteracting considerations do not result in prescription of an exact number, the choice of five items per latent variable was the researcher’s judgement-call.

The method of rotation allowed for theoretically relevant correlations between the factors. Substantial correlations between factors were to be utilised in formulating the baseline structural model of penal attitudes. Table 4.7 shows the factor correlation matrix.

Punishment4.7

Table 4.7 Study II (law students): factor correlation matrix (N=296)

Table 4.7 shows three substantial positive correlations (bold typeface) between rotated factors. They represent correlations between concepts that are clearly distinguishable but are generally associated with ‘harsh treatment’. These represent associations between Deterrence & Incapacitation, Desert and Moral Balance. These correlations were subsequently used for modelling associations between the latent variables in the baseline structural model of penal attitudes. Although the first factor in Table 4.7 covers both Deterrence and Incapacitation, the theoretical distinction[xviii] between these utilitarian concepts was considered to be important enough to justify their representation by two separate latent variables in the model. The closeness between these concepts was modelled through an added correlation between the respective latent variables in the baseline structural model. Furthermore, the factors correlating with factor I in Table 4.7, were subsequently modelled to correlate both with Deterrence and with Incapacitation. The baseline model thus includes six latent variables. Figure 4.2 presents the resulting baseline structural model of penal attitudes based on the analyses of student data. Table 4.8 shows the selected items with item numbers corresponding to those depicted in the structural model of Figure 4.2. This model is tested in Chapter 6 using data obtained from judges in Dutch criminal courts. Before doing so, however, Chapter 5 provides a brief outline of the legal context of the study.

Punishment4.8

Table 4.8 Items in the model of penal attitudes

Figure 4.2 Baseline model of penal attitudes

Figure 4.2 Baseline model of penal attitudes

NOTES
i. For instance, concepts like ‘objectively valid morality’ and ‘subjective immorality’ in Polak’s retributive approach, or the notion of a social contract in Beccaria’s utilitarian approach. See Chapter 2.
ii. The fact that some existing items were phenomenologically derived by the original researchers does not make our scales less theoretical because only those items were chosen that represented our theoretically selected concepts.
iii. In this text the terms rehabilitation and resocialisation are used interchangeably (see Chapter 2).
iv. See Feinberg (1970) for an extensive discussion of the expressive function of punishment.
v. A number of such core arguments from retributivism related to restoring the moral balance were reviewed and discussed in Section 2.4.3.
vi. I thank Ylan de Waard and Marjolein Weitenberg for their cooperation.
vii. I thank Hans Nijboer for his cooperation.
viii. Procedure and results of Study I have been previously published in De Keijser (1998).
ix. Factor Analysis using ‘principal axis factoring’ yielded the same results. Because our aim in this first empirical phase of the study is more explorative in nature, principal components analysis is reported.
x. The slope of the line through the eigenvalues decreased substantially after the fifth component. See Dunteman (1989) and Kim and Mueller (1978) for concise discussions of criteria for the number of components to retain.
xi. The three items that were excluded from the rating scales of Study I (see Table 4.3) were retained in the item pool for study II.
xii. This will be discussed in Section 6.2.
xiii. The role of the state in criminal proceedings should be reduced to that of mediator between perpetrator and victim. Criminal law should, to a large extent, be transferred to the sphere of civil law.
xiv. Factor loadings refer to coefficients in the structure-matrix. These coefficients represent simple correlations of the variables with the factors. The choice for a minimum factor loading of 0.35 is, of course, somewhat arbitrary. However, with sample size 296, factor loadings need at least be 0.30 to be statistically significant at the 1% level (Stevens, 1996, p. 371). Because we had to deal with a large number of items, the choice of 0.35 as a cut off point seemed quite reasonable.
xv. This first factor is ‘contaminated’ with two Desert items (loadings 0.58 and 0.49) and two Restorative Justice items (loadings 0.45 and 0.44).
xvi. The item in this factor with the lowest loading (0.30) is a Rehabilitation item. This contaminating item has a loading of 0.26 on the Rehabilitation factor.
xvii. This last factor is contaminated by one Deterrence item which also has a substantial loading (0.37) on the first factor.
xviii. This is the distinction between individual prevention through incapacitation and general prevention through deterrence.


Punishment And Purpose ~ Intermezzo: Legal Context Of The Study

Justice5.1 Introduction
This chapter provides a concise outline of the legal context of the empirical studies that are reported in the following chapters. As such, it aims at describing only those aspects of the Dutch legal system and some of the practical issues involved that are considered to be the most relevant for our purposes.[i]

Section 5.2 first describes the organisational structure of Dutch criminal courts. The internal structure of the courts as well as hierarchy and competences amongst them are discussed. Subsequently, section 5.3 provides a brief outline of the Dutch sentencing system. A number of aspects of Dutch criminal procedure are described and the roles of the police, prosecutor, defence, probation service and judge(s) are discussed. Section 5.3 concludes with describing the main provisions in Dutch penal code (P.C.) pertaining to sanctions and sentencing. It will be demonstrated that Dutch penal code invests judges with wide discretionary powers in sentencing. Section 5.4 discusses these discretionary powers in more detail. The discretionary powers have prompted concerns for equality in sentencing. A number of (informal) aspects that influence and constrain judges’ discretion in sentencing are discussed as well as the main controversies that surround the issue of equality in sentencing.

Figure 5.1 Four layers in the organisational structure of Dutch courts

Figure 5.1 Four layers in the organisational structure of Dutch courts

5.2 Organisation of Dutch criminal courts[ii]
All cases in the Netherlands are tried by professional judges. Juries or layassessors are unknown. Candidate judges are appointed after completing six years of magistrate training (RAIO-training) subsequent to obtaining a law degree from a Dutch university. Aside from following a six year magistrate training, candidates with a law degree who have more than six years of experience in a legal profession may also be eligible for appointment. The organisational structure of the Dutch judiciary is regulated in the ‘Judicial Organisation Act’ (Wet op de Rechterlijke Organisatie). The court system is organised in four layers. Figure 5.1 shows the organisational structure of Dutch courts.[iii] Conventional Dutch terminology is printed in smaller typeface in Figure 5.1. The courts of limited jurisdiction form the lowest level in the hierarchy shown in Figure 5.1. In criminal cases these courts hear mostly misdemeanors (‘summary offences’).[iv] Cases in these courts are tried by judges sitting alone and are open for appeal to district courts by both the prosecution and the defence. The district courts will try the appeal cases de novo.

Felonies (serious cases) are tried by district courts.[v] The internal structure of a district court in criminal cases is such that a distinction can be made between judges sitting alone (unus iudex), panels of judges and judges of instruction (investigative judge). The most common types of judges sitting alone are judges handling juvenile cases (kinderrechter) and judges who hear cases in which the prosecution demands a penalty up to six months imprisonment. The latter type of judge bears the somewhat misleading name ‘police judge’ (politierechter), while they have nothing to do with the police. A special type of police judge is the economic police judge who hears cases involving the ‘Economic Offences Act’. Since by law (art. 369 C.C.P.) police judges cannot impose harsher sentences than six months of imprisonment, all more serious cases are brought before a chamber of the court which sits in panels of three judges.

Although there is a panel of judges for economic cases, in practice virtually all economic criminal cases are heard by the economic police judge sitting alone (Nijboer, 1999). If the defendant is found guilty, single sitting judges generally give their oral verdict immediately. When a case is tried before a panel of judges the verdict will be given on a later date after the judges have deliberated in chambers. Deliberations in chambers are secret. The verdict of a panel of judges is unanimous and will be given two weeks after the trial. The judge of instruction, also called ‘investigative judge’ is, in specified circumstances, responsible for pre-trial decisions pertaining to investigations and detention (art. 63 C.C.P.). The decisions of a district court, sitting as a court of first instance, are open for appeal to one of the courts of appeal. Courts of appeal are organised at a regional level and try cases de novo. The territorial jurisdiction of a court of appeal is called Hofressort. Each of the five hofressorts accommodates a number of district courts (up to four). All cases in courts of appeal are tried by panels of three justices.

Both the defence and the prosecution have the right to appeal for cassation on a decision from a court of appeal by the Supreme Court (court of cassation). In a full hearing, the Supreme Court sits in panels of five justices. The Supreme Court cannot reconsider the facts of the case; it can only decide on issues of law. If the Supreme Court decides the facts to be in need of further consideration, it refers the case to a lower court after reversal.[vi]

The decision of the prosecutor in relation to which court and which type of judge or panel of judges should try a case is, first, a matter of socalled absolute and relative competence of the courts. Second, it is a matter of competence of different types of judges within the courts. Absolute competence relates to the question which type of court is competent to try a particular case. This depends largely on the severity of the offence. Absolute competence is regulated in the ‘Judicial Organisation Act’. Relative competence concerns the question which court, given a certain type, is competent to try a particular case. This depends largely on geographical borders between jurisdictions. Relative competence is regulated in the Dutch Code of Criminal Procedure. Competence of different judges or panels of judges within a court depends on type of offence, type of offender and severity of the offence.

5.3 The Dutch sentencing system
General criminal law (commune strafrecht) in the Netherlands is laid down in two codes. The substantive law is codified in the Penal Code (P.C.) and criminal procedural law in the Code of Criminal Procedure (C.C.P.). Other areas of criminal law include military criminal law, criminal law of war, socio-economic criminal law, fiscal criminal law and traffic criminal law. This brief discussion, however, will concentrate on general criminal law.

In section 5.2 the organisational structure of Dutch criminal courts was presented. In order to clarify the judicial context for the study still further, this section will provide an outline of the Dutch sentencing system. Following a concise introduction to criminal proceedings in the Netherlands, sentencing and criminal sanctions will be elaborated upon.[vii]

A criminal case first enters the system through the police (except for tax cases). Police investigations are carried out under the authority of the public prosecutor’s office or an investigative judge. Police officers are required to produce written records (processen-verbaal) of their investigative activities. These written records then become part of the official case file. Case files play a significant role in Dutch trials. They provide important sources of evidence and information relevant for sentencing decisions.

The police reports cases that are eligible for criminal prosecution to the public prosecutor’s office. The public prosecution is organised according to the same structure as the courts (see section 5.2). Public prosecutors’ offices (parketten) are attached to the district courts and courts of appeal. The prosecutor’s work involves supervision of criminal investigations, prosecution at trial and execution of imposed sentences. During pre-trial investigations, a suspect may be kept in police custody without the possibility of bail. After pre-trial investigations are concluded, the prosecutor may decide to bring the case to court. The Dutch prosecutor is granted discretionary powers (expedience principle; opportuniteitsbeginsel) in deciding which cases are to be brought to trial (art. 167 and art. 242 C.C.P.). Before trial, the case file, including all relevant written reports, is available to the prosecution, the judge and the defence.

The probation service, a non-governmental organisation, may be involved in all stages of a criminal process. Its tasks include producing presentence social enquiry reports on defendants for the criminal justice agencies, providing assistance to offenders in all stages of the criminal process, and preparing and implementing alternative sanctions.[viii] If requested, social enquiry reports by the probation service are usually included in the case file.

In court, interaction between judge(s), prosecutor, accused and his counsel focuses on the evaluation of the written reports in the case file. In general, the parties make little use of their right to summon witnesses or experts to the trial (Nijboer, 1999). Unless the court has decided otherwise, the accused is not obliged to be present at trial (Tak, 1993). Such proceedings in absentia may, or may not, be in the presence of a defence counsel. During trial, the judge plays an active role in questioning the defendant and witnesses (if present). Interaction during trial unfolds according to a standardised sequence of events. After the trial is formally opened and the judge[ix] has identified the accused by name, age, date of birth, profession and residence, the prosecutor recites the summons and presents a list of witnesses and objects that have been seized.[x] Subsequently, the judge(s) question(s) witnesses, experts and the defendant. The prosecutor then proceeds to request conviction and the specific sanction that he wishes to be imposed (requisitoir). Next, the defence counsel may speak and then the defendant is always given the final word.[xi]

When the hearing is concluded, the phase of deliberation and judgement commences. As mentioned in section 5.2, judges sitting alone (unus iudex) usually give their judgement immediately while panels of judges present their judgement after a period of two weeks. Deliberation and judgement have to proceed according to requirements dictated in the articles 348 and 350 C.C.P. First a number of formal questions need to be answered explicitly. These questions concern the validity of the summons, the (relative and absolute) competency of the court, the prosecutor’s right to institute criminal proceedings and absence of reasons to suspend prosecution (art. 348 C.C.P.). Only after each of these questions has been answered in the affirmative may the court proceed to examine the socalled ‘material’ questions (art. 350 C.C.P.). These involve examining whether or not the facts alleged by the prosecutor have been proven, whether these facts constitute an offence codified in the penal law, whether the accused is eligible for punishment (i.e., absence of justifications and excuses) and, finally, deciding on the sanction.

In Dutch penal code a distinction is made between punishments and measures; both are sanctions. The principal punishments (hoofdstraffen) are imprisonment, detention,[xii] community service and fine (art. 9 P.C.). A fine may be combined with imprisonment or detention. Community service was introduced into the penal code in 1989 (art 22b P.C.). By law, community service may only be imposed as a substitute for an unconditional prison sentence with a maximum of six months. If substituted, six months of imprisonment is equated with 240 hours of unpaid work.[xiii] The defendant is required to make a formal request to the court for a community service order instead of going to prison.[xiv] Punishments may be combined with measures. The most important measures are the compulsory hospital order, deprivation of the proceeds of crime, withdrawal of seized objects from free circulation and the compensation order (discussed in section 2.7).

The penal code specifies minimum terms for the principal punishments in general. For instance, the penal code specifies a minimum of one day imprisonment (art. 10 sub 2 P.C.) and a minimum fine of five Dutch Guilders (art. 23 section 2 P.C.). Furthermore, specific maximum terms are specified for each separate offence codified in the penal code, for instance, four years imprisonment for theft (art. 310 P.C.). The difference between the general minima and specific maxima for sentences implies a high degree of discretionary power for Dutch judges (discussed in more detail in section 5.4).[xv]

A conditional or suspended sentence is considered to be a mode (or modality) of punishment. Apart from some provisions, a sentence may be completely or partially suspended (art. 14a P.C.).[xvi] The court usually specifies certain conditions which have to be met by the defendant during the operational period (proeftijd) of the suspended sentence. The general requirement that the convicted person must not re-offend during the operational period of the suspended sentence is always part of the condition (Tak, 1993). Additional special conditions may include damage compensation, admission to a psychiatric care institution, deposit of a sum of money in a fund for victims of crimes, deposit of bail or other special conditions pertaining to the offender’s behaviour (art. 14c section 2 P.C.). This latter type of special conditions frequently involve participation in courses such as social skills training, vocational training and alcohol or drugs education, mostly supervised by the probation service.

Recently a change of legislation on alternative sanctions has been proposed (Tweede Kamer der Staten Generaal, 1998). When this legislation is enacted, community service and training and educationprogrammes will merge into a new formal principal punishment called ‘assignment punishment’ (taakstraf)[xvii]. This principal punishment, constituting a maximum of 480 hours, will be independent of the prison sentence. In the proposed change of legislation, it would even be possible to combine the assignment punishment with a prison sentence. Since at the time of carrying out our empirical studies this legislation was still in the draft phase, it will not be considered further.[xviii]

5.4 The discretionary powers of Dutch judges
The previous section pointed out that Dutch courts have a wide discretion in sentencing. The formal limits of this discretion are determined by the difference between the general minima (applicable to all offences) and the specific maxima (per individual offence) of principal punishments. Over and above, combinations of principal punishments with various measures and special conditions concerning (partly) suspended punishments provide the court with an enormous array of sentencing options.

In the practice of punishment, apart from the general requirement of equality, discretion in sentencing is subject to a number of influences and constraints. First of all in the phase of judgement and deliberation, the punishment requested by the prosecutor is the starting point for determining the sentence.[xix] As such, it has a strong directive influence on sentencing. The extent to which the prosecutor and investigative judge in the pre-trial phase have employed remand in custody also tends to have a (strong) directive influence at sentencing. Sentencing discretion of individual judges in panels of judges is further influenced by deliberations in chambers. Dissenting opinions are not permitted. In order to reach a common verdict, judges need to negotiate and compromise (cf. Van Duyne, 1987; Van Duyne & Verwoerd, 1985). Furthermore, within each court judges aim for consistency through mutual consultation and by formulation of sentencing policies for distinct categories of offences.

District court judges also tend to take into account the policy of the court of appeal residing over their jurisdiction. An additional constraint on the discretion is the court’s obligation to motivate its sentence.[xx] Moreover, a well-motivated sentence would contribute to the public’s confidence in the criminal justice system (cf. Enschedé, 1959). This obligation, has, however, resulted in predominantly superficial and evasive standard phrases. One important explanation presented for the vague and superficial level of motivation of sanctions is the absence of one generally accepted normative theory on the functions and goals of sentencing: there is no agreement on the goals of punishment (Corstens, 1995; Koopmans, 1997). We will return to this point shortly.

Dutch judges cherish their discretionary powers. They do so because they feel this allows them to ‘do justice’ to the unique aspects and circumstances of specific cases and individual offenders. At the same time, however, the principle of equality (in sentencing) is also valued highly in Dutch law. Obviously, both aspects may present conflicting demands on sentencing (cf. Blad, 1997; Corstens, 1995; Kelk & Silvis, 1992; Mevis, 1997). The wide discretionary powers of Dutch courts have prompted concerns for equality in sentencing. With respect to the principal punishments, a number of studies have shown significant (regional) differences in sentencing in the Netherlands (cf. Berghuis, 1992; Fiselier, 1985; Grapendaal, Groen, & Van der Heide, 1997). These findings have instigated wide ranging discussions in relation to (in)equality in sentencing as well as to various methods to attain a greater level of consistency in sentencing (e.g. Corstens, 1998; Fiselier & Lensing, 1995; Justitiële Verkenningen, 1992; Special issue Trema, 1992). Some authors, however, caution against an excessive fixation on equality in sentencing. They argue that current developments may lead to a type of bureaucratic equality at the expense of the ability to individualise sentencing to fit the unique aspects and circumstances of specific cases and individual offenders (Kelk, 1992; Kelk & Silvis, 1992). Lack of uniformity in sentencing is the inevitable outcome of attempts at individualisation (Green, 1961).

Initiatives to attain a greater level of consistency in sentencing include structured deliberations between chairpersons of the criminal law divisions of the courts, attempts to formulate ‘band widths’ or ‘starting points’ for sentencing in certain types of cases, and the development of and experimentation with computer supported decision systems and computerised databases (cf. Justitiële Verkenningen, 1998). Recently, an advisory committee has proposed the establishment of a ‘council for the administration of justice’ to co-ordinate these developments and to formulate nonbinding directives for sentencing (Leemhuis-Stout, 1998).[xxi]

Although such initiatives may prove to be valuable, they seem to presuppose the existence of a commonly shared vision on the goals and functions of punishment (Lensing, 1998). As has already been suggested, the lack of such agreement may lead to superficial standard phrases being used in motivation of sentences. It may also have consequences for the acceptance and application by judges of, for instance, non-binding sentencing directives. The fact is that at the present time we know very little about judges’ visions and preferences concerning the functions and goals of punishment.

NOTES
i. For more detailed and exhaustive discussions on the Dutch legal system, see, e.g., Chorus et al. (1999).
ii. This section is largely based on discussions on the organisation of the Dutch criminal justice system in Nijboer (1999) and Van Koppen (1990).
iii. This figure was extracted and slightly modified from Van Koppen (1990, p. 754).
iv. This discussion is limited to criminal cases.
v. Of course there are exceptions. These, however, are left undiscussed.
vi. The Supreme Court can render summary decisions if the appeal does not involve issues of law (art. 101a Judicial Organisation Act). Such is done by a panel of three judges.
vii. This discussion is largely based on Nijboer (1999) and Tak (1993).
viii. See Janse de Jonge (1991) for a detailed theoretical and historical analysis of the Dutch probation service.
ix. The chairperson in case of a panel of judges.
x. Usually these are already present in the case file (Corstens, 1995).
xi. In practice problems pertaining to evidence seldom arise during trial (Nijboer, 1999).
xii.Detention differs somewhat from imprisonment in terms of execution and consequences. Detention is reserved primarily as a principal punishment for lesser offences.
xiii. To convert a prison term to a number of hours of unpaid work, judges make use of a conversion table. See Vegter (1997).
xiv. Otherwise community service might qualify as slave labour in the sense of article 4 E.C.H.R.
xv. See De Hullu et al. (1999) for an inventory and discussion of the maximum sentences specified in the Dutch penal code.
xvi. Community service orders cannot be suspended.
xvii. In practice, the term taakstraf is already widely employed.
xviii. See Mevis (1998) and Valkenburg (1998) for detailed discussions of the proposed legislation.
xix. In appeal cases the sentence of the court of first instance is usually the starting point.
xx. See, especially, article 358 section 4 C.C.P. and article 359 sections 5 and 6.
xxi. In fact such a council has been proposed several times before (Leemhuis-Stout, 1998, p. 27).


Punishment And Purpose ~ Penal Attitudes Among Dutch Magistrates

Justice6.1 Introduction
In previous sections a theoretically informed instrument and model for measuring penal attitudes has been developed. The instrument has first been applied to a sample of Dutch law students and then, after some revision, replicated with a second sample of law students. From both an empirical and theoretical point of view, analyses led to the conclusion that a six-dimensional structure is most appropriate and tenable for describing penal attitudes. Factor- and scale-analyses showed Deterrence, Incapacitation, Desert, Moral Balance, Rehabilitation and Restorative Justice to form internally consistent and readily interpretable dimensions and scales.

Results from the factor- and scale analyses on law students’ data have served as the foundation for a basic Structural Equation Model (SEM) of penal attitudes (the so-called baseline model). This baseline model was presented in Section 4.7. To further validate the measurement instrument and confirm results of the studies with law students, the baseline model is tested with data collected from judges in Dutch criminal courts. Such a sequence of analyses involving the use of data from different samples is believed to be effective for simplifying, refining and confirming a basic model (Bryant & Yarnold, 1995).

After testing the structural equation model we will proceed to construct corresponding summated rating scales. This will be carried out in a manner similar to that discussed in previous sections. The rating scales of penal attitudes will subsequently be used for more descriptive purposes. These rating scales will also re-appear in Chapter 8 where they will play an important role in analyses concerning magistrates’ views in concrete sentencing situations.

In Section 6.2 the process of data collection and some of the pitfalls involved are discussed. The organisation of Dutch criminal courts from which data were collected was described in the previous chapter. Section 6.3 describes response rates in some depth and Section 6.4 provides some background statistics of the sample of Dutch judges involved in this study. After these preparatory sections, the structural equation model is put to the test in Section 6.5. Subsequently definitive summated rating scales pertaining to the theoretical concepts are constructed and described in more detail in Sections 6.6 and 6.7. The chapter concludes with a concise discussion of the salience of penal attitudes among Dutch magistrates and their own perceptions of colleagues’ penal attitudes in Section 6.8.

6.2 Data collection
Data for our study have been collected from judges and justices in the criminal law divisions of the District Courts and the Courts of Appeal. Judges in Courts of Limited Jurisdiction were not of interest to this study since aside from civil cases, they hear mostly misdemeanours. Neither were justices in the Supreme Court of interest. These justices do not consider the facts of a case, but instead focus on issues of (formal) law. Therefore, only judges and justices from the 19 District Courts and the five Courts of appeal have been included in this study.[i]

A first step in preparing for data collection was to compile a list containing the names and court addresses of all judges working in the criminal law divisions of the district courts and courts of appeal. The list excluded deputy judges.[ii] Compiling the list was quite laborious. Two sources of names were available as a starting point: The ‘List of Names of the Dutch Judiciary’ (Dienst Rechtspleging van het Ministerie van Justitie, 1997) published by the Ministry of Justice and the ‘Guide to the Dutch Judiciary’ (Berger-Wiegerinck et al., 1997). Judges in the Netherlands are appointed to a court, not to a specific division (e.g. civil law, criminal law, administrative law) within the court. Furthermore Dutch judges frequently rotate between the divisions of a court. Because of this functional mobility, existing lists of names do not specify the division of a court a judge is working in. This problem was resolved by submitting requests for this supplementary information to each court’s registry. One district court refused to supply this information. An ‘educated guess’ as to which judges were working in the criminal law division was obtained from a lawyer in that particular region of the country. One court of appeal also refused to supply this information. The chairman of the criminal law division of this court of appeal, however, named the number of judges in his division and kindly agreed to distribute the questionnaires. The list was completed in May 1997.[iii]

Table 6.1 Numbers of judges in criminal law divisions of Dutch district courts and courts of appeal (boldface) according to the list, May 1997

Table 6.1 Numbers of judges in criminal law divisions of Dutch district courts and courts of appeal (boldface) according to the list, May 1997

Table 6.1 shows the numbers of judges in criminal law divisions of the district courts and courts of appeal on the list. Given the somewhat imprecise methods that were sometimes used to collate these numbers, they should be treated with some caution. The imprecisions will most likely lead to a slight underestimation of the true number of judges in criminal law divisions in Dutch district courts and courts of appeal. However, although such minor imprecisions are likely, we have no reason to expect severe underestimation.

Since the population of interest to this study is fairly limited in magnitude (N=385, see below), from the outset response has been a pivotal matter of concern. It is generally acknowledged that surveys by mail frequently suffer from (extremely) low response rates, even for short questionnaires. An additional problem that is especially pressing in mailed questionnaires is the danger of (too many) unanswered questions (cf. Dillman, 1978). These problems threaten external validity. Although not a great deal of empirical research has been carried out with the Dutch judiciary, this problem has already impaired some previous research (e.g. Van der Land, 1970). Response problems may be caused by numerous factors such as characteristics of the population, sensitivity of the research topic(s), presentation of the questionnaire, specific wording of particular questions, concerns for anonymity, attitudes towards (social science) research, timing of follow-ups and length of the questionnaire. To maximise response, all aspects of a study should be designed to create the most positive overall image (Dillman, 1978, p. 8). In making the necessary preparations for data collection, due attention has therefore been paid to as many of these aspects as possible.

Most judges in the Netherlands are members of a professional association called the ‘Netherlands Association for the Judiciary’[iv]. It was believed that a letter of recommendation from the chairman of the criminal law division of this association would provide an important impetus for judges to respond positively to our requests for co-operation. The chairman kindly agreed to provide such a recommendation. A copy of this letter of recommendation accompanied all questionnaires. To further encourage response rate, two weeks before sending out the actual questionnaires, letters of introduction were sent to the chairpersons of the criminal law divisions in all courts and courts of appeal. This letter of introduction stated the objectives of the research project. Furthermore the letter asked if they would be kind enough to notify the judges in their divisions that a questionnaire pertaining to this particular research project was forthcoming. Finally, careful attention was paid to the lay-out of the questionnaire and all questionnaires contained clear instructions.

The questionnaires were posted in June 1997. Each questionnaire was accompanied by the above mentioned letter of recommendation as well as a letter containing some background information on the research project and a request for co-operation. Two weeks after mailing the questionnaires, a reminder was sent to all judges restating the importance of response for external validity of the project and once again kindly requesting their co-operation. Judges were not required to reveal their identity. Completed questionnaires were to be returned anonymously in unmarked, pre-paid response envelopes. Respondents were also asked if they would be willing to co-operate in a follow-up study. If they agreed to do so, they were asked to write their name and address on a separate slip of paper. To safeguard anonymity, this slip was to be returned in a separate pre-paid envelope. Apart from a number of general questions and some questions pertaining to socio-economic characteristics, the bulk of the questionnaire consisted of attitude statements. These attitude statements were identical to those included in the second study with law students.

Table 6.2 Response rate per court, July 1997

Table 6.2 Response rate per court, July 1997

6.3 Response
Over a period of two months, completed questionnaires were received by mail. By the end of July 1997 a total of 168 questionnaires had been completed and returned. The resulting overall response rate is 44 percent. Although a sample of 168 might be judged by some to be somewhat low for purposes of quantitative analyses, it should be noted that this number constitutes almost half of the population of judges in Dutch criminal courts. Table 6.2 shows response rates calculated per district court and per court of appeal. The table reveals a fair amount of variance in response rates. The highest response rate of 77 percent was obtained from the district court in Utrecht while the lowest response rate of 13 percent was obtained from the court of appeal in ‘s-Hertogenbosch. In most courts, however, between 30 percent and 50 percent of judges in the criminal law divisions completed and returned the questionnaire. Low response rates combined with small absolute numbers of respondents in particular courts indicate that it would be unwise to make statements pertaining to individual courts or differences between courts based on these data. Furthermore, for the same reason, detailed descriptions of data per court might endanger the anonymity of judges in particular courts. When relevant, such data will therefore only be reported after the courts have been grouped at the territorial level of jurisdiction of the courts of appeal[v].

Table 6.3 shows percentages of responding judges grouped at the territorial level of jurisdiction of the courts of appeal (hofressort). The first column of the table shows percentages in the sample (N=168), while the second column shows percentages in the list (N=385). Table 6.3 shows no substantial over- or underrepresentation of judges from particular jurisdictions.

Table 6.2 Response rate per court, July 1997


Of the 168 responding judges 106 (63%) stated their willingness to be involved in the follow-up study.[vi] In summary, given that the total number of judges who were eligible to take part in this study is fairly limited (385), from the outset response rate has been a pivotal matter of concern. Paying due attention to the various aspects that were believed to be important in enhancing judges’ willingness to participate has produced a final response rate of 44 percent. Although response varies substantially between courts, grouped at the level of hofressort the five jurisdictions are represented proportionally in the sample.

6.4 Sample
The questionnaire contained some questions pertaining to background characteristics such as age, gender, specific function, experience in the criminal law division and previous occupation. Table 6.4 reports the grouped age distribution in the sample. Age distribution in the sample ranges from 30 to 69.[vii] The average age of responding judges coincides with the median and is 48.1 years (within a standard deviation of 8.5 years).

Table 6.4 Age distribution of judges in criminal law divisions in Dutch district courts and courts of appeal, percentages, 1997 (N=167)

Table 6.4 Age distribution of judges in criminal law divisions in Dutch district courts and courts of appeal, percentages, 1997 (N=167)

In a survey of composition characteristics of the Dutch judiciary, De Groot-van Leeuwen observes a steady decline in average age of Dutch magistrates between 1951 and 1986. The average age of all judges was 53.2 in 1951 and 49.6 in 1986 (De Groot-van Leeuwen, 1991, p. 65). While the data reported here pertain to a subset of all judges[viii], with some caution the mean age of 48.1 might be taken as an indicator of further rejuvenation of the Dutch judiciary.[ix] Substantially correlated with age is the amount of experience judges report in practicing criminal law (r=0.61). The average amount of experience reported is 6.7 years (within a standard deviation of 5.6 years). Experience ranges from two months to over 30 years, while two thirds of the judges have between one and eight years of experience. In the list 33 percent of all judges are female while 28 percent of responding judges are female. This means a slight under-representation (by 5%) of female judges in the current sample.

Respondents were also asked about the specific function that they occupy in the criminal law division of their court.[x] Available functions were juvenile judge, police judge, trial judge in a panel of judges at a district court, trial judge in a panel of judges at a court of appeal and judge of instruction (investigative judge). All respondents from courts of appeal sit in panels of judges. At the district courts only 20 percent of judges carry out one single task in the court. In most cases this task is that of judge in a panel of judges. The remaining judges who perform just one function either work as a juvenile judge, police judge or judge of instruction. The vast majority (80%) of judges in district courts report to perform two or even three functions in the court. Table 6.5 shows the most common combinations of functions in district courts.

Table 6.5 Most common combinations of functions in district courts, percentages, 1997 (N=138)

Table 6.5 Most common combinations of functions in district courts, percentages, 1997 (N=138)

It should be emphasised that the situation reported in table 6.5 is a volatile one. Judges in district courts are not just mobile between divisions of the courts; also within the criminal law division, functions are quite easily alternated, added or reduced. The particular function or combination of functions is not a constant in time. In relation to the gamut of functions available in the criminal law divisions, judges in the district courts certainly appear to be widely employable generalists within the system. The vast majority of judges do not practise law in isolation from other judges. Even judges who carry out a single function as unus iudex are highly likely to participate in a panel of judges in the near future or have done so in the recent past.

As indicated in Section 5.2, there are two ways for candidate judges to become eligible for appointment after obtaining a university degree in law: a candidate must either have followed the six-year magistrate training (RAIO training), or have a minimum of six years experience in a legal profession. Table 6.6 shows the professions of respondents directly prior to their appointment as judge. The percentages in Table 6.6 cumulate to more than 100 percent, due to a number of judges reporting some combination of these professions prior to their appointment as judge. Comparing data from the years 1951, 1974 and 1986, De Groot-van Leeuwen (1991, p. 67) observes a decline in the percentage of judges recruited from the six year magistrate training (59% in 1951, 57% in 1974, 45% in 1986). In the present sample, one third of the judges has gone through the six year magistrate training (RAIO) prior to being appointed as judge. This could be indicative of a further decline in the proportion of judges recruited from magistrate training in favour of judges recruited from other legal professions.

Table 6.6 Profession prior to appointment, percentages, 1997 (N=168)

Table 6.6 Profession prior to appointment, percentages, 1997 (N=168)

More judges come from advocacy (27%) than from any other legal profession. Only 6 percent of the judges have came from the Public Prosecutors Office. Most of the remaining judges have either a background in business, university law faculties or the civil service. In summary, no substantial systematic flaws have been noted in sample composition. Respondents’ average age is 48. Number of years of experience in practising criminal law averages seven years and increases with age. Almost a third of the sample is female. Only 20 percent of respondents practice criminal law in isolation from others as unus iudex. Furthermore, two thirds of responding judges have been recruited from other legal  professions, while one third has gone through the six-year magistrate training prior to their appointment as judge.

6.5 Testing the structural equation model of penal attitudes
This section is divided in two parts. The first part discusses analysis and results of the baseline structural equation model of penal attitudes presented in Section 4.7. The second part is focused on theoretical interpretation of the findings.

6.5.1 Analysis and results
Structural equation models for this study have been estimated with EQS (Bentler, 1992) using the maximum likelihood method.[xi] Input for all analyses was the observed variance-covariance matrix (not presented). Goodness-of-fit was evaluated using information from χ2 test results, the Comparative Fit Index (CFI) and from inspection of standardised residuals.[xii]

Traditionally, model fit in structural equation modelling (SEM) used to be evaluated by the χ2 test. However, there has been an increasing dissatisfaction with this goodness-of-fit measure because X2 significance testing is heavily influenced by sample size. The judges’ data comprise a sample of relatively small size (N=168). Therefore, χ2 test results are used to asses model fit in two ways. First, by comparing fit of different models, i.e., comparing the modified model to the baseline model (Bentler, 1992); second, by computing the χ2 to degrees of freedom ratio. A rule of thumb is that good model fit may be indicated when the χ2 to degrees of freedom ratio is less than 2 (cf. Tabachnick & Fidell, 1996).

The comparative fit index (CFI), provided by EQS, is one of the numerous goodness-of-fit indices which has been developed as an alternative to the χ2 significance test. The CFI takes into account the number of degrees of freedom of the model, but is not affected by sample size (Bollen, 1990). According to Bentler (1990) the index is the least (negatively) biased in small samples among those provided by EQS. The CFI should be over .90 to indicate satisfactory model fit.

Standardised residuals indicate the difference between the observed sample covariances and the covariances predicted by the model (in standardised form). Generally, the residuals should be small, their distribution should be (roughly) symmetric and centered around zero. One should not find residuals with extreme values (cf. Tabachnick & Fidell, 1996). Initially, the baseline model of penal attitudes among Dutch judges, that was presented earlier in Figure 4.2, did not fit the data satisfactorily. After removing five outliers and three cases with many missing responses on the relevant variables, a CFI of .79 and a χ2 value of 664.96 (df=399, p<.001) were obtained. Some minor modifications to the baseline model were necessary to arrive at an acceptable final model: four observed variables (items) were excluded and two observed variables were assigned to another latent variable. Regarding correlations among the latent variables (the structural part of the model), one correlation was dropped and two correlations were added to the model. The final model (N=161) resulted in a CFI of .92. The χ2 test result was 378.75 (df=292, p<.001), yielding a χ2 to degrees of freedom ratio of 1.30. Both measures indicate satisfactory model fit. Furthermore, goodness-of-fit is supported by the considerable decrease (286.21) inχ2 value of the final model compared to the baseline model. The standardised residuals showed a symmetric distribution, centered around zero, without notable extreme values. A higher degree of fit might have been achieved by freeing (adding) more parameters and cancelling some others, or even by exclusion of more observed variables. In principle however, we set out primarily to examine a pre-conceived theoretical structure. Therefore, model modifications presented here are few and only to a very limited extent motivated from a data-driven point of view.

Figure 6.1 Final model of penal attitudes among judges, standardised solution (N=161)

Figure 6.1 Final model of penal attitudes among judges, standardised solution (N=161)

Figure 6.1 shows the standardised solution of the final model. Comparison of the baseline model of Figure 4.2 with the final model in Figure 6.1 reveals the revisions that were made to arrive at acceptable model-fit.

In Figure 6.1, the item-numbers correspond to those previously reported in Table 4.8. The modifications to the baseline model are clearly marked. Dotted connections in the Figure show parameters that were changed or added. Grey shaded items in the model indicate variables that were included in the baseline model but excluded from the final model.

Figure 6.1 shows that parameters concerning two items (5, 19) needed change of latent variables to improve fit. Inspection of these two items and the respective latent variables shows that this does not change the theoretical interpretation of the model at all. Item 5 (“Most people who advocate resocialisation measures for perpetrators of offences attach little importance to the seriousness of the crimes committed”), a Deterrence-item in the baseline model now becomes part of the Incapacitation factor. Taking the content of this item into consideration, there seems to be no theoretical reason to reject this change. Indeed regarding Deterrence and Incapacitation this item can be perceived as quite equivocal. Item 19 (“The meting out of punishment to perpetrators of offences is a moral duty”) is now associated with the Desert factor instead of the Moral Balance factor in the baseline model. Both these latent variables are components of retributivism: Moral Balance is expected to function more like a general justifying aim while Desert serves to provide the goal at sentencing. Given this close theoretical interlinkage between both latent variables, the fact that 19 changed from Moral Balance to Desert, is not damaging to the theoretical structure as a whole. Further theoretical interpretation of the model is discussed in the following section.

6.5.2 Interpretation
As expected Deterrence and Incapacitation are highly correlated latent variables in the model (r=0.80). Theoretically these concepts are distinguishable within the utilitarian approach. Together, however, as noted in Section 4.7, they represent a mix of individual and general prevention characterised by ‘harsh treatment’. Judges (as well as law students) most likely view deterrence and incapacitation as prevention through harsh treatment, probably with the prison sentence in mind. Apart from a high correlation between Deterrence and Incapacitation, Figure 6.1 shows both these utilitarian concepts to be substantially correlated to the retributive concept of Desert (r=0.43, r=0.61 respectively). Although Desert stems from a different philosophical theory, these concepts clearly have something in common. A plausible explanation is fairly evident. Each of these concepts is generally associated with punitiveness, or, rather, harsh treatment in general. Concerning the Dutch practice of punishment, Hoefnagels (1980) has argued earlier that these theoretically distinct concepts are frequently used quite arbitrarily to justify harsh treatment. Moral Balance seems laterally related to these ‘punitive’ concepts, mainly through its correlation with the retributive concept of Desert (r=0.44). From a theoretical point of view this latter correlation is quite natural since restoring the moral balance is a general justifying aim within the retributive doctrine (see Chapter 2). Although the individual concepts associated with punitiveness and harsh treatment remain discernible at both a theoretical and an empirical level, they are substantially correlated. It is therefore important to note that in terms of, for instance, a severe prison sentence, punitiveness can be justified by a variety of theoretical arguments and may be aimed at achieving different goals. The philosophical roots of such harsh treatment may vary considerably and cannot be unveiled or understood just by looking at the concrete sanction that was meted out.

Juxtaposed to the punitive concepts in Figure 6.1, we find Rehabilitation and Restorative Justice. Modelling an extra correlation between Incapacitation and Rehabilitation significantly improved fit, as did modelling an extra correlation between Rehabilitation and Restorative Justice (see dotted parameters in the structural part of the model).[xiii] Although Rehabilitation and Incapacitation are both utilitarian methods for individual prevention, the correlation between the two is a negative one (r=– 0.23). From all ‘punitive’ concepts, incapacitation is perhaps most readily indicative of the prison sentence. Since the 1970’s it has become generally accepted that imprisonment and resocialisation may be in conflict. While resocialisation and rehabilitation were priorities in detention policy during the 1970’s, today in prison policy they have been more or less abandoned in favour of ‘safe, humane and efficient’ execution of the prison sentence (cf. De Keijser, 1996; Hirsch Ballin & Kosto, 1994).

Interpretation of the added correlation between Rehabilitation and Restorative Justice is somewhat less trivial. While these concepts do not seem to be associated substantially with the punitive concepts discussed above, they do have a substantial positive correlation (r=0.64) with each other. As discussed in Chapter 2, an important impetus for the development of the Restorative Justice approach has been a high degree of dissatisfaction with the existing retributive and utilitarian approaches. In the Restorative paradigm the objective of a judicial intervention is not to punish, nor to re-educate, but to restore and compensate for the damage done. At first sight, this might even lead one to expect a negative correlation between Rehabilitation and Restorative Justice. How then can such a substantial positive correlation between Rehabilitation and Restorative Justice be explained? The answer to this question is twofold.

First, there is an inclination in the Netherlands of mixing conflict resolution as proposed (in a more radical form) by Hulsman (see Chapter 2) and other restorative aspects with resocialisation. Moreover, there appears to be a tendency in Dutch sentencing practice to regard restoration or conflict resolution not as autonomous objectives, but as a means to achieve resocialisation. In other words, Restorative Justice has not (yet) developed as a full alternative paradigm in the minds of Dutch magistrates.

Rather, in Dutch penal practice, restorative aspects are still seen as a means of helping to bring about behavioural changes in offenders. Bentham stated that a sanction is better learned and makes a longer lasting impression in the mind of the offender when it bears an analogy to the offence (Bentham, 1789 /1982, ch. XV, sct. 7–9; see Chapter 2). Regarding the qualitative aspects of the offence, confronting offenders with the harm they have inflicted and obliging them to make reparation is quite promising in terms of lasting impressions and therefore has the potential to resocialise.

This is best illustrated by Dutch community service sentences which, ideally, bear analogy to the offence (cf. Ploeg & Beer, 1993). The second and related explanation for the correlation between Rehabilitation and Restorative Justice is that the Restorative paradigm does not disqualify rehabilitation and resocialisation of offenders. In the restorative justice literature, resocialising effects of a restorative intervention are regarded as probable and desirable spin-offs (e.g., Bazemore & Maloney, 1994; Walgrave, 1994; Weitekamp, 1992). Resocialising aspects of restorative interventions, though not the primary objectives, are therefore explicitly acknowledged by proponents of the restorative paradigm. In short, while Restorative Justice and the utilitarian concept of Rehabilitation are quite distinct from a theoretical perspective, in (Dutch) practice they are very much intertwined. Both Rehabilitation and Restorative Justice concentrate on socially constructive aspects of the reaction to offending. Rehabilitation involves socially constructive aspects of the offender and his position in society. The Restorative Justice view is mainly concerned with socially constructive aspects concerning the position of the victim and its relation to the offender. In penal practice, both views may be considered complementary.

In summary, the baseline model of penal attitudes that was constructed in Chapter 4 with data obtained from Dutch law students (see Figure 4.2) has been tested with data obtained from judges in Dutch criminal courts. The baseline model required only minor modifications before an acceptable degree of fit could be reached. Rather than proving our initial findings to be flawed, these modifications have improved our understanding of penal attitudes held by Dutch judges. Although, given the sample size, some prudence is called for results concur with previously formulated ideas concerning the structure of penal attitudes and are viewed as yet another confirmation of the validity and usefulness of the measurement instrument. In this study the risk of capitalising on chance is reduced by concurrent results of different empirical studies: in three different samples, two student samples and one judge sample, (basically) the same structure in penal attitudes was found. By this replication of results, the substantive meaning of the proposed model is therefore strongly supported. Results suggest two general dimensions to underlie judges’ penal philosophies: harsh treatment on the one hand and social constructiveness on the other.

6.6 Rating scales for penal attitudes
The structural equation model above involved the simultaneous estimation of two components: a measurement model concerning relationships between observed and latent variables and a structural model concerning interrelations between latent variables. In this section rating scales are constructed representing the various theoretical constructs (latent variables). Interrelations between such rating scales will no longer be constrained by the simultaneous estimation of a measurement model. Instead, we can now safely assume that the scales constitute valid and reliable representations (as intended) for the theoretical constructs and proceed as if they were observed variables.

Table 6.7 Scale statistics for judges’ penal attitudes, 1997 (N=168)

Table 6.7 Scale statistics for judges’ penal attitudes, 1997 (N=168)

The rating scales for judges are based on the same items that were used in the two studies with law students. The items used in the structural equation model are, of course, parts of the respective summated rating scales. Table 6.7 shows the number of items in each scale, means, standard deviations and internal consistencies of the scales. The summated scales have been divided by the respective numbers of items included in the scales. The Table shows internal consistencies for the six scales to be fair and quite acceptable, ranging from 0.68 (Rehabilitation) to 0.78 (Deterrence). Comparison of the scale means suggests that, on the whole, Dutch judges have a somewhat more favorable attitude towards restoring the Moral Balance (mean score 3.2), than towards any of the other sentencing objectives. The mean score on the Restorative Justice scale (2.4) is lower than that on any of the other scales.

Standard deviations reported in Table 6.7 show a fair amount of variance in summated rating scale scores. Although standard deviations provide insight in variance in scores on the separate scales, it would be desirable to have an objective standard against which to compare the distributions. Such a standard is provided by the standard normal distribution. Values for kurtosis and skewness can be transformed to z-scores and subsequently tested for significant deviation from the standard normal distribution (Tabachnick & Fidell, 1996). Transformations of these values into zscores (not displayed) showed that none of the scales were significantly more peaked or flat compared to the normal distribution. Regarding skewness, only the Moral Balance scale was found to be significantly, but not very substantially, negatively skewed (–.57, z=–3.0, p<.01). Apart from this exception, there were no further significant departures from normality in the scales.

Before turning our attention to some more detailed analyses of differences between Dutch judges in terms of penal attitudes, interrelationships and dimensionality underlying the six attitude scales have been further examined by applying yet another technique. The six summated rating scales have been analysed using PRINCALS: PRINCipal components analysis by Alternating Least Squares (Gifi, 1990; Van de Geer, 1988). After variables are transformed according to the ‘ALS’-algorithm the technique proceeds quite similarly to ordinary principal components analysis (PCA). However, contrary to ordinary principal components analysis, PRINCALS allows data of various measurement levels (interval, ordinal, nominal) to be analysed simultaneously. Furthermore, interpretation is facilitated by the programme’s graphically orientated output.

Figure 6.2 shows the results of the PRINCALS analysis on the six rating scales.[xiv] This is a so-called vector diagram. The vectors in Figure 6.2 represent component loadings of the rating scales in an unrotated twodimensional space.[xv] The ‘importance’ of the scales in the (twodimensional) solution is represented by the length of the vectors. More importantly for present purposes, however, is the relative orientation (angles) of the vectors. An increasingly small angle between vectors indicates an increasingly high correlation between the respective scales, and vice versa. If two or more vectors coincide, they correlate perfectly. A perpendicular orientation of vectors, on the other hand, indicates zero correlation.

Figure 6.2 to a high degree visualises interrelationships that were estimated between latent variables in the structural equation model of Figure 6.1. Two main ‘clusters’ of vectors can be discerned in Figure 6.2:

1. Rehabilitation and Restorative Justice;
2. Moral Balance, Desert, Incapacitation, Deterrence. The fact that the terms ‘punitive concepts’ and ‘non-punitive concepts’ have been used above, might be taken to imply that both types of concepts are part of a common underlying punitiveness dimension.

This, however, is not the case. Although highly correlated amongst themselves, sentencing objectives freely associated with punitiveness (Deterrence, Incapacitation, Desert, and, to a somewhat lesser degree Moral Balance) are virtually uncorrelated with the ‘non-punitive’ objectives of Rehabilitation and Restorative justice: in Figure 6.2 both clusters of vectors are positioned in a near-perpendicular (orthogonal) orientation. If there had been a true underlying punitiveness-dimension to these concepts, the respective vectors would be pointing in opposite directions, that is, be highly negatively correlated. Therefore, in the minds of Dutch judges a favorable attitude towards Desert, for instance, does not necessarily imply a negative attitude towards Rehabilitation and Restoration. In fact, the attitude towards Desert has no predictive value for attitudes towards Rehabilitation and Restoration.

Figure 6.2 Judges’ penal attitudes: component loadings of six penal attitude scales (PRINCALS), 1997 (N=168)

Figure 6.2 Judges’ penal attitudes: component loadings of six penal attitude scales (PRINCALS), 1997 (N=168)

At first sight one might be tempted to view Figure 6.2 as the visualisation of something that comes very close to the hybrid penal philosophy that is said to be dominant in the Netherlands: the general justification for punishment, its essence, is provided by retribution. Below the limits defined by retribution, notions of utility determine the choice concerning mode and severity of punishment.[xvi] Interpreting Figure 6.2 as such, restoring the Moral Balance in society would then be seen to represent the general retributive justification. The Moral Balance vector is positioned between Rehabilitation and Restorative Justice on the one hand, and Incapacitation, Desert and Deterrence on the other. All vectors in the Figure are, in varying degree, positively correlated with Moral Balance. It should be noted, however, that the Moral Balance vector is shorter than the other vectors.

After some careful consideration, however, several reasons should lead one to conclude that Figure 6.2 does not represent such a hybrid penal philosophy. First, Moral Balance provides the general justification with Restorative Justice and Desert among the remaining (uncorrelated) perspectives while the hybrid theory would prescribe only utilitarian principles to guide the further choice of punishment. Secondly, the figure cannot and does not imply a hierarchy among penal objectives as is supposed in the hybrid approach. Thirdly, there is no place in the hybrid theory for restorative justice. Fourthly, from both a theoretical and a practical point of view concepts such as Rehabilitation and Desert are hardly reconcilable.

The fact that such concepts are neither substantially positively nor negatively correlated leads one to suspect another process underlying Figure 6.2. Although sentencing objectives related to harsh treatment, irrespective of their philosophical roots, correlate highly amongst each other and Rehabilitation and Restorative Justice correlate highly as well, the choice for a guiding principle in concrete sentencing situations may be largely determined by eclectic considerations. One perspective does not a priori exclude the other, although the attitude towards restoring the Moral Balance in society is more or less reconcilable with whichever perspective is favoured. The fact that these general attitudes towards punishment are not characterised by mutually exclusive categories will facilitate eclecticism in the more concrete stadia of the sentencing process.[xvii] The discussion can be further illustrated when we consider the results of a factor analysis with the six rating scales of penal attitudes. Factor analysis on the attitude scales with oblique rotation of factors (with eigenvalue greater than one) resulted in two uncorrelated factors (r=0.12, p=0.13).

Table 6.8 Judges’ attitudes: factor loadings of six penal attitude scales after oblique rotation, 1997 (N=168)

Table 6.8 Judges’ attitudes: factor loadings of six penal attitude scales after oblique rotation, 1997 (N=168)

Deterrence, Incapacitation, Desert, and (to a somewhat lesser extent) Moral Balance have high factor loadings on the first factor, while Restorative Justice and Rehabilitation have high factor loadings on the second factor. The factor loadings are presented in Table 6.8. Two independent dimensions underlying the six attitude scales were once again identified. The first factor is labelled harsh treatment. The second factor, uncorrelated with the first, covers the socially constructive perspectives. Clearly, and not surprisingly, this analysis confirms the previous findings. Since the two dimensions are uncorrelated, one would expect particular characteristics of the offence and the offender to determine the balance between these perspectives in concrete cases.

Clearly in the minds of magistrates interrelations between the concepts measured do not reproduce the abstract philosophical frameworks of penal doctrine as described in Chapter 2. Judges may not be expected to fully reproduce the structure of abstract penal doctrine: ‘general philosophical principles become translated into the specific, concrete and, inevitably, more limited rules’ (Hogarth, 1971, p. 69). Although the various concepts from moral legal theory have proven to be distinguishable, meaningful and measurable, associations between the concepts may be seen to reflect some kind of practical penal philosophy (cf. Hogarth, 1971). Judges’ attitudes in general seem to merge into a more streamlined and pragmatic approach to punishment. The question arises whether such a practical and pragmatic ‘penal philosophy’ can still legitimise the practice of punishment in a consistent and normatively acceptable manner. This question will be elaborated upon further in Chapter 8.

In summary, the theoretical constructs derived from the various theoretical positions have proved to be consistently meaningful and measurable concepts in the minds of magistrates. After confirmatory analyses using structural equation modelling in Section 6.5, we proceeded to construct rating scales representing the respective theoretical concepts. The scales for Deterrence, Desert, Incapacitation, Moral Balance, Restorative Justice and Rehabilitation exhibited quite acceptable internal consistencies, ranging from 0.68 to 0.78. In-depth examination of interrelationships between the scales using varying techniques showed a pattern of association among the concepts that was readily interpretable and very similar to that estimated in the structural equation analyses. If one would insist on further reduction of the dimensionality in these data, the observed patterns of association among the scales pointed to two underlying uncorrelated dimensions: harsh treatment and social constructiveness.

6.7 Penal attitudes and background characteristics
Although our research efforts have been focused on the measurement of penal attitudes and determining interrelationships between attitudes toward various sentencing objectives, a limited number of judges’ background characteristics were available for some further analyses. In the previous sections the measurement and structure of penal attitudes have been discussed and examined in detail. This section relates judges’ penal attitudes to a number of background characteristics. Apart from the specific court or court of appeal where a judge works, information pertaining to characteristics such as age, gender, specific function in the criminal law division, experience in the criminal law division and previous occupation were available. Each of these characteristics has been described in more detail in Section 6.4. To unveil any possible influences that these background characteristics might have on judges’ penal attitudes, a PRINCALS analysis was carried out in much the same way as with the six rating scales in the previous section. This time, the full potential of the PRINCALS method is utilised because we are simultaneously analysing data of different measurement levels.

Of the background characteristics mentioned above, only gender, age and years of experience appeared to be substantially related to penal attitudes. This was established by examining the so-called ‘row sums’ of the background characteristics in the PRINCALS output in concurrence with (univariate) analyses of variance (not displayed) of these background characteristics with the rating scales. Of course age and experience are confounded (r=0.61 as reported in Section 6.4). It was assumed that experience is the characteristic that really matters here. Therefore, a final PRINCALS solution was generated using only experience, gender and the six scales for penal attitudes.

While the scales were analysed as ordinal variables, ‘gender’ and ‘years of experience’ have been included in the analysis as nominal variables.[xviii] In calculating co-ordinates for categories of nominal variables, in contrast to ordinal variables, there are no restrictions regarding relative orientation (ordinality) of the co-ordinate points. Figure 6.3 displays the result of this PRINCALS analysis. The format of this figure is somewhat different from the previous figure. The scales in Figure 6.3 are no longer represented by vectors, but rather by straight lines running through the respective category points (1 through 5) of each scale. The figure depicts associations between variables and categories simultaneously in several ways. As in Figure 6.2 angles between scales still represent correlations. Perpendicular projections of seperate category points of gender and experience onto the scales will show the general (average) position of judges with that characteristic on the particular scale. Furthermore association between nominal category points is represented by their closeness in space.

Figure 6.3 Judges’ penal attitudes, gender, and experience (PRINCALS), 1997 (N=168)

Figure 6.3 Judges’ penal attitudes, gender, and experience (PRINCALS), 1997 (N=168)

Associations between the penal attitudes need no further explanation since the relative orientation of the respective lines represents the same structure as in Figure 6.2. Figure 6.3 shows that male and female judges have different attitudes concerning the concepts related to harsh treatment. Male judges do not stand out in terms of excessive ‘punitiveness’. Female judges, however, are less favourable towards Incapacitation, Deterrence and Desert than their male counterparts.

Furthermore, Figure 6.3 shows differences between more and less experienced judges in terms of their penal attitudes. Criminal judges with 9 years experience or less[xix] have relatively favourable social constructive attitudes while simultaneously they tend to be situated on the ‘mild’ sides of the scales representing Moral Balance, Incapacitation, Deterrence and Desert (harsh treatment). Criminal judges with extensive experience up to 32 years, however, have less favourable attitudes towards social construction. Simultaneously, these more experienced judges have a more favourable attitude towards ‘harsh treatment’ than their less experienced peers (cf. Bond & Lemon, 1981). It must be noted, however, that differences between experience categories in terms of socially constructive attitudes are predominantly due to differences in Rehabilitation attitudes and not to differences in Restorative Justice attitudes.[xx] Various (rather trivial) explanations for this observation come to mind. One explanation might be that more experienced judges have become increasingly disappointed with the ‘socially constructive’ potential of the criminal justice system. The resulting ‘numbness’ leads to more favourable attitudes towards harsh treatment of offenders. At this stage, however, such an explanation is mere speculation. Before even beginning to elaborate on such explanations, one has to prove that this phenomenon is really due to experience, not to other variables that may differ in time. A reasoned explanation would require longitudinal study of penal attitudes in conjunction with in-depth analyses of other variables.

In summary, analyses relating some background characteristics of respondents to their penal attitudes, showed gender and experience both to have substantial impact. Female judges showed less favourable attitudes to ‘harsh treatment’ than did their male colleagues. Furthermore, preferences towards ‘harsh treatment’ increase with the amount of experience while, at the same time, support for social construction is dropping.

6.8 Salience and assessment of colleagues’ attitudes
Before penal attitudes will be examined in the light of concrete sentencing situations in the following chapters, one final issue needs to be addressed. In Chapter 3, the attitude concept was already discussed in some detail. Attitudes, it was argued, are supposed to have a motivational function with respect to behaviour (see Section 3.2). The extent to which an attitude is likely to guide behaviour is believed to be influenced by the salience (i.e., accessibility) of the attitude toward a particular object. Consistency between attitude and behaviour is therefore expected to increase with (amongst other things) attitude salience (Ajzen, 1988, pp. 79–80).

Table 6.9 Salience of judges’ penal attitudes, percentages, 1997 (N=168)

Table 6.9 Salience of judges’ penal attitudes, percentages, 1997 (N=168)

Although in the practice of sentencing there are many formal, social and situational constraints and influences on magistrates’ behaviour, some general indication of penal attitude salience would be welcome as complementary information in the context of this study. Such an indication was obtained by asking respondents how often they discuss various (normative) aspects of punishment such as the general justification and goals at sentencing with their colleagues. Table 6.9 shows the judges’ responses to this question.

Table 6.9 shows that relatively few judges (14%) never or rarely discuss justifications and goals of punishment with colleagues. While 46 percent of the magistrates sometimes discuss these topics with their peers, 40 percent of the magistrates discuss functions and goals of punishment frequently (35%) or even often (5%) with their colleagues. In general, therefore, penal attitudes should be quite accessible (salient) in the minds of judges in Dutch criminal courts.

A final bit of information concerning judges’ penal attitudes was obtained by asking them about their perception of attitudinal variation among Dutch judges in criminal courts concerning goals of punishment. Furthermore, they were asked to give an indication of in how far they thought their own penal attitudes were different from those of their colleagues. Both questions were answered using seven-point scales ranging from 1 ‘no difference’ through 7 ‘a great deal of difference’. Table 6.10 shows responses to both questions.

Table 6.10 Judges’ penal attitudes: perception of differences among colleagues (N=161) and of self versus others (N=157), percentages, 1997

Table 6.10 Judges’ penal attitudes: perception of differences among colleagues (N=161) and of self versus others (N=157), percentages, 1997

Average scores on both scales are also provided in the table which shows that judges in general seem to perceive a fair amount of differences in penal attitudes among their colleagues (Mean 4.4). Only 29 percent of respondents perceive little or no differences in judges’ penal attitudes.[xxi]

When asked about the degree to which respondents believe their own penal attitudes to diverge from those of their colleagues, the opposite pattern emerged. Not many judges find their own attitudes to be very different from their colleagues’ attitudes (Mean 3.4). Only one fifth of the judges perceive a fair amount of difference between their own attitudes and those of their colleagues. This confirms a finding earlier reported by Hogarth that regardless of their own penal attitudes, judges tend to view themselves as being in the mainstream of thinking. Possibly this is caused by a process of selective perception of others’ penal attitudes (Hogarth, 1971).

Finally, as might be expected, the two perceptions reported in Table 6.10 are substantially correlated (r=0.50, p<0.01): a judge who perceives his penal attitudes to differ from those of his colleagues is quite likely to perceive a lot of difference in general and vice versa. These perceptions, however, are not significantly affected by the number of times judges discuss these matters with their colleagues.

In summary, taking the frequency of discussing topics related to functions and goals of punishment as an indicator of penal attitude salience (i.e., accessibility), we may conclude that, in general, penal attitudes are quite readily accessible in the minds of Dutch judges. However, despite frequent discussions among magistrates, they perceive a fair level of differing attitudes among themselves while, at the same time, think that their own attitude is not much different from others’.

NOTES
i. See Section 5.2 for a discussion of the organisation of Dutch criminal courts.
ii. Each court has a number of deputy judges. The list excluded this group since their primary occupation is usually other than being a judge in a criminal court. Some judges working in one court are deputy in another court. As such, they would be included in the list. Many other deputy judges are either members of the law faculties of the various Dutch universities or work as attorney.
iii. Below the phrase ‘the list’ will be repeatedly used and refers to this self-compiled list of names of judges and justices in the criminal law divisions.
iv. Nederlandse Vereniging voor Rechtspraak (NVvR).
v. i.e., hofressorten; see Section 5.2.
vi. See Chapter 7 and Chapter 8.
vii. By law, the maximum age for judges in Dutch courts is fixed at 70.
viii. Only judges in criminal law divisions in district courts and courts of appeal.
ix. It might, however, also be indicative of the tendency of younger judges to be somewhat more willing to respond.
x. The term ‘function’ is used here to refer to different types of judges as described in Section 5.2.
xi. I thank Rien van der Leeden for his invaluable help with these analyses.
xii. See De Keijser (2000) for a concise introduction to structural equation models and EQS. See also Bentler (1986, 1990, 1992), Bollen (1989, 1990) and Jöreskog & Sörbom (1993) for more detailed discussions of structural equation modelling.
xiii. Note that these correlations concur with correlations reported in Table 4.7. These correlations were, however, not used in the baseline model because they were found to be relatively insubstantial.
xiv. Prior to the analysis, the scales have been recoded so that they ranged from the integers 1 (relative negative attitude) to 5 (relative positive attitude).
xv. 15 Princals component loadings: Rehabilitation (.02; .84), Restorative Justice (.26; .78), Moral Balance (.62; .15), Desert (.82; –.07), Incapacitation (.78; –.10), Deterrence (.80; –.21).
xvi. See Chapter 2 for a discussion of this and other hybrid theories.
xvii. See Chapter 2 for a discussion of eclecticism as a sentencing strategy.
xviii. Years of experience has been recoded in three categories: ‘less than three years’, ‘four through nine years’ and ‘ten through thirty-two years’.
xix. The figure shows that females are somewhat better represented among the relatively lesser experienced judges than males.
xx.  This was revealed through univariate analysis of variance.
xxi. Hogarth had asked Magistrates from Ontario a similar question with similar outcome: the majority of Canadian judges felt that there is lack of uniformity concerning sentencing philosophy (Hogarth, 1971, p. 182).


Punishment And Purpose ~ Punishment In Action: Development Of A Scenario Study

Justice7.1 Introduction
It has been argued that measurement of penal attitudes in a manner consistent with moral legal theory is a prerequisite for determining the relevance of moral theory in the actual practice of punishment. While Chapter 4 focused on developing and validating a theoretically integrated measurement instrument and model of penal attitudes, Chapter 6 involved the actual examination of Dutch judges’ attitudes towards the goals and functions of punishment. Results show that penal attitudes can be measured in a manner consistent with moral legal theory. The relevant (theoretical) concepts prove to be measurable and meaningful for Dutch judges. It has also been shown that the general structure of penal attitudes reveals a streamlined and pragmatic approach to punishment among Dutch judges. Although identifiably founded on the separate concepts drawn from moral theory, their approach appears to be dominated by two general perspectives: harsh treatment and social constructiveness. Since these were found to be uncorrelated, we expected particular characteristics of the offence and the offender to determine the balance between these perspectives in concrete cases.

Apart from measuring general penal attitudes and exploring the underlying structure, studying the relevance of moral legal theory for the practice of punishment involves yet another important aspect. A necessary further step is to explore the relevance and consistency of goals at sentencing (i.e. sentencing objectives) in concrete criminal cases. Judges’ decisions may be affected by the goals they pursue in general as well as in any particular sentence (Blumstein, Cohen, Martin, & Tonry, 1983). Thus having succesfully measured general penal attitudes, we now concentrate on preferred goals at sentencing in concrete cases. We believe that both types of findings (i.e., general penal attitudes and goals at sentencing) complement each other. Both types of data are necessary to acquire an overall and well-founded impression regarding the link between moral legal theory and the practice of punishment.

With this in mind, a scenario study was carried out. The study was designed to measure judges’ preferences for sentencing objectives in concrete cases and to determine the relevance and consistency of these preferences in the light of their sentencing decisions. Furthermore, judges’ preferences for sentencing objectives in concrete cases are compared to their general penal attitudes. Because the scenario study involves hypothetical criminal cases and requires judges to pass sentence, we refer to Chapter 5 for discussions on the Dutch sentencing system and Dutch judges’ discretionary powers in sentencing. In Section 7.2 the goals of the scenario study are discussed. Section 7.3 describes the method. In order to counterbalance unintentional and undesirable effects due to the method of research and manipulation of vignettes, a special experimental design of the scenario study proved necessary. Given its complexity, this design is discussed in Section 7.4. Section 7.5 describes the measures that were employed in the scenario study. The final section, Section 7.6, discusses the selection of suitable vignettes for the scenario study. Criteria and procedure for selecting, formulating and varying the scenarios are discussed in detail. Subsequently, in Chapter 8 results of the scenario study are presented.

7.2 Goals of the scenario study
Having shown the central concepts from moral theories on punishment to be meaningful and measurable for Dutch judges, the focus will now be shifted to sentencing in concrete criminal cases. In short, the two aspects of interest involve abstract notions of punishment on the one hand, and punishment in action on the other. Punishment in action is examined here by means of a scenario study. While the previous chapters concerned penal attitudes in general, the essence of the scenario study is the measurement of preferred sentencing goals and sentencing decisions within the framework of specific criminal cases. The scenario study was designed to shed more light on judges’ visions and preferences concerning the goals of punishment in concrete sentencing situations and to isolate ‘the person of the judge’ as a variable in the sentencing process. Most research on sentencing fails to take this into account. As Mears recently put it:
It would seem self-evident that the characteristics, attitudes, and perceptions of court practitioners affect sentencing decisions, yet researchers rarely include such factors in their analyses. Although inclusion of such factors admittedly poses considerable methodological challenges, the widespread failure even to acknowledge or consider their influence is striking. (Mears, 1998, p. 701)

In contrast, our scenario study explicitly focuses on judges’ penal attitudes and preferences for goals of punishment while, through the experimental nature of the design, controlling for as many other factors as possible. For selected cases, apart from indicating preferences for sentencing goals, judges were requested to apportion punishment, thereby allowing consistency and relevance of sentencing objectives for sentencing decisions to be examined systematically. Furthermore our data pertaining to Dutch judges’ general penal attitudes allow us to explore the relevance of penal attitudes for employing preferred goals at sentencing. The goals of the scenario study can thus be summarised in the following conditional propositions:
P1. If there is a commonly shared vision among judges on the goals of punishment that apply to specific cases, few differences are expected between judges in their preferred goals of punishment in the same cases.
P2. If personal characteristics of judges play a significant role in sentencing, substantial differences are expected between judges’ sentencing decisions with regard to the same cases.
P3. If preferred goals of punishment are relevant for choosing a particular sentence, or if a particular sentence is consistently rationalised by a preferred goal (or combination of goals), clear and consistent patterns of association are expected between goals of punishment and sanctions in individual cases.
P4. If judges’ general penal attitudes influence their preferences for particular goals of punishment in individual cases, clear and consistent patterns of association are expected between general penal attitudes and goals of punishment in individual cases.

7.3 Method
Aside from a number of (informal) constraints and converging mechanisms in sentencing (discussed in Section 5.4), roughly three general sets of characteristics that influence sentencing decisions may be distinguished: characteristics of the offence, characteristics of the offender, and characteristics of the sentencing judge (Enschedé, Moor-Smeets, & Swart, 1975). By presenting vignettes of the same criminal cases to different judges, characteristics of the offence and characteristics of the offender are controlled. In this manner, the influence of characteristics of individual judges on sentencing decisions can be isolated. Concerning examination of the sentencing decisions, this solves one important methodological problem that generally impedes research to sentencing disparity. This involves the problem of classifying ‘like cases’ and identifying criteria for grouping cases as similar or different (Blumstein et al., 1983).

Although characteristics of individual judges include a variety of aspects such as gender, social background, education and religion, we have focused on judges’ penal attitudes and preferences for specific goals in selected cases. It is important to bear in mind that the purpose of the scenario study is to determine consistency and relevance of sentencing goals in the light of sentencing decisions rather than attempt to explain or predict sentencing decisions exhaustively. Although characteristics of individual judges include a variety of aspects such as gender, social background, education and religion, we have focused on judges’ penal attitudes and preferences for specific goals in selected cases. It is important to bear in mind that the purpose of the scenario study is to determine consistency and relevance of sentencing goals in the light of sentencing decisions rather than attempt to explain or predict sentencing decisions exhaustively.[i]

A scenario study with vignettes of criminal cases inevitably involves a simplification of reality. This affects external validity of research findings.[ii] This type of study, however, if designed properly, can be a powerful tool for researching very specific aspects of interest. If the study were to involve only one type of vignette, generalisability of findings would be restricted to types of criminal cases that resemble the particular vignette employed. Systematic differentiation or manipulation of vignettes on one or more dimensions (relevant to the study) should increase the scope of research findings. Moreover, it also enables the researcher to study the impact of these experimental manipulations.

Study findings reported in Chapter 6 provided the foundation for manipulating the vignettes in the scenario study. The general structure of judges’ penal attitudes indicated a pragmatic approach towards the functions and goals of punishment. As a result of that finding, the expectation was postulated that particular characteristics of the offence and of the offender would determine the balance between the perspectives in concrete cases (Section 6.6). Concerning the relevance of penal attitudes for choosing preferred goals of punishment in specific cases, this implied an opportunity to further specify the fourth conditional proposition of Section 7.2. For this purpose the term pointer is introduced. Pointers are defined as elements (i.e., information pertaining to particular characteristics of offence and offender) in a crime case that are expected to evoke preferences for particular goals of punishment. Thus, given the pragmatic nature of the general structure of penal attitudes among Dutch judges:

P4a. If pointers that evoke a particular goal of punishment are relatively prominent in a specific case, penal attitudes should not be expected to be very relevant for the preferred goals of punishment for that specific case.

In contrast:
P4b. If pointers that evoke the range of goals of punishment are equally present in a specific case, judges employ their personal penal attitudes as tie-breakers. Penal attitudes are expected to be relevant for the preferred goals of punishment for that case.

The choice of goals of punishment was guided by findings from the study on general penal attitudes. The penal attitude scales described in the previous chapters involved Deterrence, Incapacitation, Desert, Moral Balance, Restorative Justice and Rehabilitation. Restoring the moral balance, a metaphysical general justification in the retributive approach to punishment, was not considered to be a suitable separate goal of punishment in specific crime cases.[iii] The remaining five perspectives, however, clearly imply concrete goals of punishment as shown below.

General penal attitudes Goals of punishment in scenario study
Deterrence → deterrence
Incapacitation →  incapacitation
Desert → desert
Moral Balance → –
Rehabilitation → rehabilitation
Restorative Justice → reparation

In the vignettes, pointers that are expected to evoke these specific goals of punishment were manipulated.[iv]. In the first vignette pointers for all five goals of punishment (cf. conditional proposition 4b) were equally incorporated (both qualitatively as well as quantitatively) and was thus called the ‘balanced’ vignette. The other vignettes were dominated by pointers for one goal or a particular combination of goals (cf. conditional proposition 4a). The second vignette contained more pointers for harsh treatment, i.e., deterrence, incapacitation and desert and fewer for rehabilitation and reparation (socially constructive aspects). The patterns of association among the penal attitude scales discussed in Chapter 6 prompted the choice for this vignette. In a third vignette, pointers for rehabilitation were clearly dominant. In the fourth and final vignette, pointers for reparation were most prominent. Although penal attitudes for Rehabilitation and Restorative Justice have been found to be highly correlated, the theoretical distinction between both perspectives prompted the choice for the third and fourth vignette.

Punishment7.1Thus, given the manipulation of pointers that are expected to evoke the five goals of punishment, the resulting structure of the four basic vignettes is shown in Table 7.1. The four basic vignettes shown in Table 7.1, A through D, were to be presented to all judges in the sample. Measurement of preferences for goals of punishment and sentencing decisions was thus repeated four times within each subject. Design and analysis (of variance) of this type of study are conventionally referred to as withinsubjects design and repeated measures analysis.

A number of potential problems inherent in this type of study led to further refinement of the research method and design. These problems involve obviousness of the experimental manipulation and order and carryover effects. Order and carry-over effects are discussed in the following section (7.4).

If the four vignettes would have been based on one and the same story, manipulation of pointers would have been all too obvious for respondents. Credibility of the vignettes would thus diminish and validity would be threatened. A solution to this problem was to create different versions of the same vignettes, that is, use different stories to create vignettes that are essentially the same in terms of pointers for goals of punishment. To be able to determine whether differences in study findings between basic vignettes were not caused by the different stories employed, four versions of each basic vignette were created. The resulting 16 vignettes (four for each basic vignette) are shown in Table 7.2. The vignettes within each column of Table 7.2 are essentially the same. Differences lie in the framing of these vignettes using different stories. In principle, different versions of the same basic vignette were neither meant nor were they expected to lead to substantial differences in findings.

Table 7.2 Sixteen vignettes: all versions of the four basic vignettes

Table 7.2 Sixteen vignettes: all versions of the four basic vignettes

In summary, the creation of several versions of the basic vignettes was a tool to ensure that the experimental manipulations would be less obvious for respondents. An additional advantage of employing a number of different stories is an increase in external validity of the study. Of course, in the phase of data analysis, possible effects of the factor ‘story’ are first examined. The scenario study thus involved the presentation of four vignettes to every judge in the sample, each judge receiving different versions (stories) of the four basic vignettes.

7.4 Design
When administering a number of different treatments (i.e., vignettes) to the same subjects, the presentation-order may have undesirable effects on the measurement. Subjects may become practiced, tired or ‘experimentwise’ as they experience more treatments (Maxwell & Delaney, 1990; Tabachnick & Fidell, 1996). An established technique to combat such undesirable effects is called counterbalancing. Counterbalancing involves ordering sequences of treatments so that each treatment is administered first, second, third and fourth (and so on) an equal number of times (Keppel, 1991). This allows order effects to become independent of treatments (i.e., are not confounded with treatment effects) and can be isolated during analysis.

Counterbalancing is achieved through use of a Latin square design. Latin square designs counterbalance order effects. Within-subjects designs present, however, yet another problem: the concern for carry-over effects. This type of undesirable effect occurs when, for instance, the effect of treatment A carries over to the subject’s behaviour during treatment B. Therefore a non-cyclical Latin square is preferred to counterbalance order effects and to avoid systematic carry-over effects. In such a design, treatment A follows treatment B as often as B follows A (Maxwell & Delaney, 1990).

Table 7.3 Graeco-Latin square design for the scenario study (basic vignette designated by letters; story designated by numbers)

Table 7.3 Graeco-Latin square design for the scenario study (basic vignette designated by letters; story designated by numbers)

For the scenario study, the design needed to be carried one step further than the Latin square design. This was necessary because we also wanted to be able to isolate and estimate variation in responses due to (undesirable) effects of ‘story’ (i.e., the versions of the vignettes). In order to be able to estimate all effects that were of interest to the study, two orthogonal Latin squares needed to be superimposed (Kirk, 1968): one square for basic vignettes (A through D) and one square for stories (1 through 4). As such, a Graeco-Latin square is obtained.[v] Table 7.3 shows the Graeco-Latin square that was employed for the design of the scenario study.

Measurements carried out according to this design enable independent estimation of row- (subjects), column- (order), letter- (basic vignette) and number- (story) effects, and total variation in responses can be partitioned accordingly (John, 1977).

The sixteen vignettes of Table 7.2 were organised according to the four sequences of this Graeco-Latin square. Subjects were randomly assigned to four equal groups thus producing ‘replicated squares’ (Maxwell & Delaney, 1990).[vi] Each group was presented with a questionnaire containing one particular sequence of vignettes from the Graeco-Latin square of Table 7.3.

7.5 Measures
Apart from a limited number of background characteristics, measures employed in the scenario study involved preferences for goals of punishment on the one hand, and sentencing decisions on the other.

Preferences for goals of punishment were measured in a straightforward manner. Following each vignette, respondents were requested to indicate, for that particular vignette, the importance that they attached to deterrence, incapacitation, desert, rehabilitation, and reparation. For each of these goals of punishment a 10-point scale ranging from 1 ‘very unimportant’ to 10 ‘very important’ was presented. Furthermore, per vignette, judges were asked to rank-order three of the five goals they found most important.

As a number of (qualitative) studies in the Netherlands have reported confusion among Dutch magistrates about the meaning of various sentencing objectives (see Section 3.4.2.), it has been suggested that a common frame of reference among magistrates for discussing goals of punishment is absent (cf. Enschedé et al., 1975; Van der Kaaden & Steenhuis, 1976). However, our study of penal attitudes shows that the penal concepts which readily implied the five goals of punishment for the scenario study are definitely meaningful and consistently measurable among Dutch judges. Furthermore, in order to rule out any possible misunderstandings or confusion of concepts in the scenario study, the following concise definitions of the five goals of punishment were provided in the questionnaire of the scenario study:

desert
The offender’s debt to society is settled through the infliction of suffering proportional to the seriousness of the crime.

incapacitation
To exclude an offender from society or place him under strict supervision in order to protect society from his actions.

rehabilitation
To correct an offender’s personality, personal skills or position in society in order to prevent him from doing fresh harm.

reparation
To repair material and/or immaterial damage done to the victim or society through restitution or compensatory work.

deterrence
To deter an offender or other potential offenders from committing future crimes through the use of punishment.

Employing closed questions about preferred sanctions was considered to be too restrictive to allow a deeper understanding of sentencing decisions. Given the gamut in possible sentencing options and wide discretionary powers (discussed in Section 5.4), judges were instead requested to write down in some detail their preferred sanction, including measures and special conditions if opted for. Respondents were instructed to assume that no problems had arisen pertaining to either evidence or to any formal judicial complications. They were also instructed that if community service was preferred, a request by the offender could be assumed. Furthermore, the specific sanction requested by the public prosecutor was not given. In actual practice, judges would have the sanction requested by the public prosecutor available as a starting point for determining the sentence. In the scenario-study, however, this was omitted for the purpose of allowing judges’ decision space to be as wide as possible.

7.6 Selection of vignettes
Up until this point the goals of the scenario study, method, research design and measures have been discussed without any mention of the actual contents of the vignettes. The selection and formulation of the vignettes was guided by a number of different strategies.

Each vignette was constructed in such a way that the essential information necessary for determining the type and severity of sentence was available. All vignettes contained three basic sections. The first section described the offence and apprehension by the police in some detail. The second section contained information about the victim and the consequences he suffered as a result of the offence. The third and final section described (social) characteristics of the offender in some detail. Table 7.4 shows the three basic sections of the vignettes and the elements that were manipulated within the sections.

Table 7.4 Basic sections in vignettes and elements that were manipulated

Table 7.4 Basic sections in vignettes and elements that were manipulated

It was decided to first create four versions (stories) of the balanced vignette (A1 through A4). Using these balanced vignettes as a standard, the specific elements (pointers) would then be systematically varied in order to produce harsh treatment vignettes (B1 through B4), rehabilitation vignettes (C1 through C4) and reparation vignettes (D1 through D4).

A convenient starting point for formulating and selecting a balanced vignette was to concentrate on the types of cases that could be considered ‘border-line’ in terms of applying a community service order. Aside from its function as a tool to combat prison overcrowding, community service is believed to combine reparation and rehabilitation as primary goals of punishment (Bazemore & Maloney, 1994; Jackson, de Keijser, & Michon, 1995; Walgrave & Geudens, 1996). As discussed in Section 5.3, community service may only be imposed by the courts as a substitute for a maximum of 6 months imprisonment. The closer a community service order is to its maximum of 240 hours, the more likely it is that the goals of rehabilitation and reparation are in conflict with desert, deterrence and incapacitation (given the supposed increased severity of the offence).

Similarly, cases with an unconditional prison sentence close or equal to 6 months imprisonment provide good starting points since, in principle, community service would have been an alternative option. However, in Dutch sentencing practice, there are a number of ‘counterindications’ which may deter a court from substituting a prison sentence for a community service order. These generally involve cases where the accused is absent at trial (verstek), the accused is addicted to hard-drugs,[vii] sexual offenders, notorious recidivists, offenders without residence, and offenders who have failed to complete an earlier community service order (Wijn, 1997). Therefore the cases of special interest were those where the sanction was either a community service order close or equal to 240 hours or an unsuspended prison sentence close or equal to 6 months and that included none of the counterindications mentioned above.

Table 7.5 Basic differences between the vignettes

Table 7.5 Basic differences between the vignettes

To obtain examples of such cases, the Research and Documentation Centre (RDC) of the Dutch Ministry of Justice was contacted. At the RDC, a measurement instrument, the ‘RDC-Criminal Justice Monitor’ (WODC-Strafrechtmonitor), was developed to monitor trends and examine specific characteristics of the Dutch criminal justice system. The monitor provides detailed quantitative and qualitative information extracted from case files. In 1998 the database contained a stratified sample (according to type of offence and instance that handled the case) of 635 criminal cases from 1993: 230 decided upon by the public prosecutor and 405 decided upon by the district courts (Projectteam SRM, 1997). Our request to consult the Criminal Justice Monitor database was kindly granted.[viii] Using the criteria discussed above produced a corpus of cases that were predominantly property crimes with the use of violence (art. 312 P.C. and sometimes also art. 317 P.C.). This category of crimes is relatively commonplace and represents a substantial portion of cases put before the courts (cf. Centraal Bureau voor de Statistiek, 1998). It was decided to focus all vignettes on this category. Elements of the cases selected from the RDC-Criminal Justice Monitor served as the initial input for formulating the balanced vignettes.

The vignettes were copiously edited, extended and altered until four stories (versions) of the balanced vignette were obtained (A1 through A4). The four stories involved, respectively, the robbery of a person drawing money from an cash dispenser, the robbery of a taxi-driver, the robbery of the owner of a cafeteria, and the robbery of the owner of a clothes shop.

Subsequently, characteristics of the offence, characteristics of the victim and characteristics of the offender were systematically manipulated to obtain four stories of each of the remaining three basic vignettes (B, C, and D). The resulting vignettes had no clear resemblance to any of the initially selected cases from the Monitor. Furthermore, fictitious names were employed to designate the perpetrators in the vignettes. The vignettes were intensively discussed with two deputy judges. Afterwards the final vignettes were established. A selection of four of the sixteen vignettes (A1, B2, C3, D4) are included in Appendix 1. Table 7.5 shows the essential differences between the basic vignettes in terms of the pointers that were manipulated.

In summary, the scenario study involved 16 vignettes: four stories (1 through 4) of the four basic vignettes (A through B). The basic vignettes differed from each other in terms of pointers that were expected to evoke preferences for different goals of punishment. Every judge in the sample was presented with a particular sequence of four vignettes from the Graeco-Latin square design. The design was chosen in order to counterbalance undesired effects of order and to enable systematic partitioning of the variance in responses in accord with the main effects of interest. The following chapter will discuss the procedure and presents the results of the scenario study.

NOTES
i. This implies that a substantial amount of variability in sentencing decisions may not be accounted for and will consequently show as error variance.
ii. See Lovegrove (1999) for a concise discussion of advantages and disadvantages of employing fictitious cases for the study of sentencing.
iii. However, an element of restoring the moral balance in society was incorporated in the concise definition of desert which was presented to the subjects; see Section 7.5 below.
iv. In the remainder of this text capitals will be used for the first letters of the penal attitude scales (cf. Chapter 6) and lower case letters for the concrete goals of punishment in the scenario study.
v. It is called Graeco-Latin because originally such squares involved combinations of Greek and Roman letters (Ogilvy, 1972).
vi. Residual degrees of freedom increase with an increasing number of squares resulting in more sensitive significance testing. For instance, dfresidual=3 in one square and dfresidual=231 with 20 squares while dfmain effects=3 in both instances.
vii. In the Netherlands, a distinction is made between hard drugs (art. 2 Narcotics Act) and soft drugs (art. 3 Narcotics Act). The term hard drugs is reserved for those substances that pose an unacceptable threat to public health. Heroin and cocaine are examples of hard drugs. Hashish and cannabis are examples of soft drugs. Possessing less than 30 grams of a soft drug will not be punished (art. 11 Section 4 Narcotics Act).
viii. 8 I thank the RDC in general and A.A.M. Essers and B.S.J. Wartna in particular for their willing cooperation.


Punishment And Purpose ~ Punishment In Action: The Scenario Study

Justice8.1 Introduction
In the previous chapter the design and selection of vignettes for the scenario study were presented. This chapter reports on the results. Consistency and relevance of goals of punishment in the light of sentencing decisions are examined within and across vignettes. Due attention is given to differences in sentencing decisions within the framework of the criminal cases presented. Furthermore, the role of general penal attitudes in choosing preferred goals of punishment for the selected criminal cases is scrutinised.

The results will be presented in the following way. Following a description of data collection and sample characteristics in Section 8.2, undesirable framing effects of version are analysed in Section 8.3 using the full potential of the Graeco-Latin square design. In Section 8.4 judges’ preferences for goals of punishment are examined in detail within and across vignettes. The basic vignettes were designed to differ from each other in terms of pointers that are expected to evoke preferences for different sentencing goals (see Table 7.5 in Chapter 7). Given this manipulation, planned comparisons between the vignettes have been carried out to examine whether judges’ preferences for goals of punishment concur with our expectations. Subsequently, in Section 8.5, profiles of the basic vignettes in terms of sentencing decisions are presented. Within each criminal case variation in sentencing decisions is discussed. Once the goals of punishment and sentencing decisions have been examined independently, they are analysed simultaneously in Section 8.6. For the balanced vignette (A), the harsh treatment vignette (B), the rehabilitation vignette (C), and the reparation vignette (D), patterns of association between sentencing goals and sanctions are analysed and discussed. Finally, in Section 8.7, the relevance of judges’ general penal attitudes for choosing preferred goals of punishment in the presented criminal cases is examined and discussed.

8.2 Data collection and sample
At the end of the initial questionnaire examining judges’ general penal attitudes (see Chapter 6), respondents were asked whether they would be willing to co-operate in a follow-up study. If they agreed to do so, they were asked to write their name and address on a separate slip of paper. Of the 168 judges who responded in the penal attitude study of 1997, 106 (63%) stated their willingness to be involved in a follow-up study. This panel of 106 judges therefore formed the target group for the scenario study.

In order to minimise panel attrition due to any changes in respondents’ employment position or address, the courts’ registries were contacted in May 1998. The vast majority of the 106 judges still held the same position as they had one year earlier. In 1998, only 12 percent of the judges had either moved to another court or were working in another division within the same court (e.g. civil law division). The decision was made to include these judges.

In May 1998 a letter introducing the scenario study was sent to all 105 judges in the panel.[i] In this letter, judges were reminded of their co-operation in the first study and of their stated intention to co-operate in the follow-up study. Furthermore, the nature of the follow-up study was described and they were asked once more for their co-operation. At the end of May 1998 the questionnaires containing the vignettes as well as an accompanying letter were posted. Questionnaires were to be returned anonymously in pre-paid response envelopes. With two-week intervals, two reminders were sent restating the importance of response for external validity and again kindly requesting co-operation. Within two months, 84 judges had completed and returned the questionnaire, yielding a response rate of 80 percent. Since the scenario study only involved subjects who had previously stated their willingness to co-operate, such a high rate of response had been anticipated. These 84 respondents constitute 22 percent of the original population of 385 judges.

The average age of respondents in the scenario study is 49.2 compared to 48.1 a year earlier in the penal attitude study. Furthermore, in the scenario study 26 percent of responding judges are female (28 percent in the penal attitude study). Table 8.1 shows percentages of judges grouped at courts of appeal jurisdictions (hofressorten) for respondents in the scenario study and for judges in the original population list from the criminal law divisions (see Section 6.2). The table shows that judges from the Arnhem jurisdiction are overrepresented in the scenario study by 15 percent. Judges from ’s-Gravenhage (The Hague) and particularly from ‘s-Hertogenbosch are relatively underrepresented in the sample. This implies that some prudence is called for when considering regional generalisation of the study findings.

Punishment8.1

Table 8.1 Judges grouped at the territorial level of courts of appeal (hofressort): 1998, percentages in sample and in list of population

For the repeated measures analyses reported below, the numbers of judges per sequence of vignettes from the Graeco-Latin square design needed to be equal. As discussed in Chapter 7, the 105 judges were randomly assigned to one of four equal groups (i.e. three groups of 26 and one group of 27) thus producing ‘replicated squares’ (Maxwell & Delaney, 1990). Table 8.2 shows the numbers of respondents per sequence of the design. Judges who responded are evenly distributed over the four sequences of vignettes.


Table 8.2 Number of judges in scenario study per sequence from the Graeco-Latin square, 1998 (N=84

Table 8.2 Number of judges in scenario study per sequence from the Graeco-Latin square, 1998 (N=84

In summary, response rate in the scenario study reached a quite satisfactory 80 percent, just over one fifth of the general population of interest. Regional representativeness of the current sample is somewhat limited. The numbers of judges who completed and returned the varying sequences from the Graeco-Latin square design of the study are almost identical thus requiring only a minor adjustment to arrive at equal groups. In Section 8.3 the total variance in responses is partitioned into the effects of interest to the study with particular emphasis on undesirable effects of version

8.3 Examining framing effects
In Chapter 7, the reasons for framing the basic vignettes (A through D) differently were explained. These included making the experimental manipulation of pointers less obvious and increasing the external validity of the study. Different versions (1 through 4) of the same basic vignettes were designed containing essentially the same information. As such, differences in framing were neither meant nor expected to result in any substantial effect on judges’ responses.

Making full use of the analytic possibilities provided by the Graeco-Latin square design, the total variance in responses was partitioned into all discernible main sources of variation, including variation due to version.[ii] For estimating and testing effects of version, the emphasis was on variation in judges’ preferences for the goals of punishment.

In contrast to a between-subjects design, within-subjects designs provide the opportunity to further reduce residual (error) variance thereby resulting in more sensitive significance testing. Because measurement of sentencing goals was repeated four times for each individual judge, variability among the subjects due to individual differences can be determined and removed from the error term (cf. Stevens, 1996). Put differently, each subject in a within-subjects design may serve as his or her own control (Maxwell & Delaney, 1990). Furthermore, variation in responses due to the position of a vignette in the sequence of four vignettes (first, second, third or fourth) can be extracted. As a result of counterbalancing in the design (discussed in Chapter 7), this source of variation was (a priori) equally distributed over the different vignettes. Total variance in responses can thus be partitioned into variation due to subjects, position in sequence, basic vignette (A through D), version (1 through 4) and residual or error variance.

Four subjects were excluded from the repeated measures analyses to arrive at exactly the same number of subjects per sequence from the design (see Table 8.2 above). Two of these subjects were excluded because of missing values and two others were randomly excluded. Tables 8.3 through 8.7 show the results of the repeated measures analyses with the five goals of punishment. For each goal (deterrence, incapacitation, desert, rehabilitation and reparation) total variance in responses is partitioned into separate sources of variance. F-statistics are calculated to test variance due to undesirable effects of version.

Punishment8.3

Table 8.3 Repeated measures analysis of variance: deterrence, scenario study 1998 (N=80) Table 8.4 Repeated measures analysis of variance: incapacitation, scenariostudy 1998 (N=80) Table 8.5 Repeated measures analysis of variance: desert, scenario study 1998 (N=80)


Table 8.6 Repeated measures analysis of variance: rehabilitation, scenario study 1998 (N=80) Table 8.7 Repeated measures analysis of variance: reparation, scenario study 1998 (N=80)

Table 8.6 Repeated measures analysis of variance: rehabilitation, scenario study 1998 (N=80)
Table 8.7 Repeated measures analysis of variance: reparation, scenario study 1998 (N=80)

Tables 8.3 through 8.7 show that, with the exception of rehabilitation, judges’ preferences for the goals of punishment were not affected by the versions of the basic vignettes presented to them. The effect of version on judges’ preference for rehabilitation in the vignettes is statistically significant, although it only accounts for less than 3 percent of the variance: SSversion=44.73 while SStotal=1704.10 (Table 8.6). Given that this is the only statistically significant effect of version that was found, that it is insubstantial and that every version occurred an equal number of times in combination with every basic vignette, it is possible to conclude that there were no overall effects of version (i.e., framing) on judges’ responses. Figure 8.1 further supports this conclusion by showing that the different versions did not substantially distort judges’ preferences for rehabilitation between basic vignettes: the lines designating the basic vignettes in the figure do not cross. The relative order of basic vignettes does not change across versions, which means that effects of version on rehabilitation do not overshadow the effects of basic vignettes.

PunishmentF8.1

Figure 8.1 Mean scores on rehabilitation: basic vignettes and versions, scenario study 1998 (N=80)

The Tables 8.3 through 8.7 also show that there are two main sources of variance in the responses, namely variance due to individual differences between judges and variance due to the basic vignettes. These are the sources of variation that represent the main focus of interest in the scenario study. The remainder of this chapter disregards the different versions of the basic vignettes and concentrates on (differences in) judges’ preferences for goals of punishment and their sentencing decisions.

8.4 Preferences for the goals of punishment
In this section judges’ preferences for particular goals of punishment are examined in detail within and across vignettes. Furthermore, the question of whether or not there is a commonly shared vision among judges on the goals of punishment that apply to specific cases is explored (cf. conditional proposition 1, Section 7.2).

Recall that the basic vignettes were designed to evoke differences in preferences for five goals of punishment: deterrence, incapacitation, desert, rehabilitation and reparation (see Chapter 7, Table 7.1). Figure 8.2 shows the average scores for these goals of punishment in each of the basic vignettes.

Figure 8.2 Average scores for goals of punishment per basic vignette, scenario study 1998 (N=80)

Figure 8.2 Average scores for goals of punishment per basic vignette, scenario study 1998 (N=80)

Inspection of Figure 8.2 shows that, on average, the vignettes evoked the predicted preferences. For instance, within the ‘harsh treatment vignette’ (B), the average scores for deterrence, incapacitation and desert are higher than the average scores for rehabilitation and reparation. Furthermore, deterrence, incapacitation and desert are found to be more important in the ‘harsh treatment vignette’ than in any of the other vignettes. Similarly, in the ‘reparation vignette’ (D), the goal of reparation is found to be more important than any of the other goals while comparison between vignettes shows that the average score for reparation is highest in the ‘reparation vignette’. The figure further shows that deterrence and desert are considered to be important goals of punishment (albeit to a lesser extent) even for the ‘rehabilitation vignette’ and the ‘reparation vignette’.

To support these findings statistically, planned comparisons among the average scores within and between the vignettes have been carried out.[iii] Table 8.8 shows judges’ average scores for deterrence, incapacitation, desert, rehabilitation and reparation in each of the basic vignettes. The last column of the table reports planned comparisons among the goals of punishment within each vignette. The last row of the table reports planned comparisons between the vignettes for each goal of punishment. All of the planned comparisons in Table 8.8 show differences between the average scores to be substantial and significant. The balanced vignette (A) was designed to incorporate equal pointers for deterrence, incapacitation, desert, rehabilitation and reparation. Figure 8.2 shows that differences between the average scores for these goals of punishment in the balanced vignette are indeed of a smaller magnitude than in any of the other vignettes.[iv] However, an overall comparison of means shows the differences between average scores for goals of punishment within the balanced vignette to be statistically significant (F (4, 316)=10.44, p<.001). Obviously, the relatively low average score for incapacitation (5.47) in the balanced vignette contributes substantially to this finding. It must therefore be concluded that we have only partially succeeded in creating a truly balanced vignette while patterns of (average) responses in the other vignettes are consistent with our intentions.

Punishment8.8

Table 8.8 Planned comparisons between goals of punishment within and across the basic vignettes, scenario study 1998 (N=80)

Inspection of average preferences for the goals of punishment among Dutch judges has been useful in producing overall profiles of the vignettes in terms of preferred goals of punishment, but it does not tell us anything about individual differences between judges. Yet, the magnitude of such differences is important for determining consistency among judges’ in their preferences for goals of punishment in specific cases. At this point, we return to the conditional proposition 1 that was formulated in Section 7.2 and is reiterated here:

P1. If there is a commonly shared vision among judges on the goals of punishment that apply to specific cases, few differences are expected between judges in their preferred goals of punishment in the same cases.

The scenario study enables examination of this proposition for the four specific robbery cases: the balanced case, the harsh treatment case, the rehabilitation case and the reparation case. A rather straightforward manner of examining differences in preferences for the goals of punishment in these cases is to inspect the standard deviations in responses. Table 8.9 reports these standard deviations per basic vignette.

The standard deviations reported in Table 8.9 indicate a fair amount of variability in preferences among judges. For comparison, in a standard normal distribution 68 percent of the subjects are located in the range between plus one and minus one standard deviation from the mean. Correspondingly, roughly two thirds of the judges in the sample have a score for incapacitation in the balanced vignette that varies between 3.09 and 7.85 (i.e., 5.47±2.38) and one third preferred a score outside this interval. Similarly, for rehabilitation in the harsh treatment vignette, roughly two thirds of the scores are dispersed between 3.36 and 7.44. Although there are no absolute standards for determining whether or not a standard deviation is small or large, we consider this variation to be substantial. Table 8.9 also shows that, regardless of the specific criminal case, the goals of incapacitation and reparation evoke the most pronounced differences in opinion among Dutch judges. Furthermore, in comparison to the other vignettes, (absolute) preferences for goals of punishment vary the most in the reparation vignette.

Table 8.9 Standard deviations and response ranges (in parentheses) of preferences for goals of punishment, scenario study 1998 (N=80)

Table 8.9 Standard deviations and response ranges (in parentheses) of preferences for goals of punishment, scenario study 1998 (N=80)

Although the standard deviations in Table 8.9 might be considered to be substantial, judges’ preferences for goals of punishment in a specific criminal case could still be relatively similar, only differing in scale level. To examine this possibility, a different perspective on judges’ preferences is needed. For each of the cases in the study, judges were asked to rank order the three goals of punishment that they considered to be most important. The number and nature of different rankings should produce the additional information necessary for a more definitive evaluation of conditional proposition 1. The Tables in Appendix 3 show the rankings of the goals for the four types of vignettes.

For the balanced vignette, 41 percent of the judges find desert to be the most important goal of punishment (first in rank order), 20 percent find rehabilitation most important, 19 percent deterrence, 14 percent reparation and 6 percent incapacitation. While 74 percent has included desert among the three most important goals in the balanced vignette, 26 percent has not.

Preferences for goals in the harsh treatment vignette show less diversity. Desert is rated most important by 48 percent of the judges, both deterrence and incapacitation by 21 percent. Reparation is found most important by 6 percent of respondents and rehabilitation by only 4 percent. However, 35 percent of the judges have included rehabilitation as their second or third most important goal. While the goals of punishment associated with harsh treatment are clearly found to be dominant in the harsh treatment vignette, substantial differences between judges still exist regarding the relative importance of these goals.

In the rehabilitation vignette, 46 percent of respondents rank rehabilitation as most important goal of punishment. Desert is selected as the primary goal by 23 percent, reparation by 19 percent, deterrence 11 percent and incapacitation by only 1 percent. While 65 percent of the judges therefore aim primarily for one of the socially constructive goals of punishment (rehabilitation or reparation), no less than 35 percent choose one of the goals associated with harsh treatment.

In the reparation vignette, 53 percent of the judges find reparation to be the most important goal of punishment. Desert is selected as the primary goal by 26 percent, deterrence by 12 percent, rehabilitation by 6 percent and incapacitation by 4 percent. Thirteen percent of the judges do not mention reparation as one of the three most important goals that they associate with this vignette.

Evaluation of conditional proposition 1
Preferences for goals of punishment in the specified criminal cases have been examined in order to determine whether or not judges share a common vision of the aims of punishment related to these cases. Inspection of the Tables in Appendix 3 and the summarising statistics just presented reflect the central tendencies previously reported through the average preferences. However, the magnitude of the variation in preferences per goal of punishment in conjunction with the nature and number of substantively different preferences pertaining to the same criminal cases lead us to the following evaluation (E) of conditional proposition 1:

E1. There is no commonly shared vision among Dutch judges on the goals of punishment that apply to these specific cases.
What comes closest to a commonly shared vision is found in the harsh treatment vignette. With few exceptions, judges aim primarily for desert, incapacitation or deterrence for this case. Disregarding differences in the relative importance attached to these harsh treatment goals, this type of criminal case elicits general agreement regarding the type of treatment: harsh instead of socially constructive.

The four cases employed in the scenario study are all aggravated robbery cases. Caution should therefore be exercised in generalising the findings to other types of criminal cases. However, having said this, we do not expect a commonly shared vision on the goals of punishment to exist for all other types of crimes.

8.5 Sanctions
In the previous section, profiles of the four robbery cases (basic vignettes) have been examined in terms of preferences for goals of punishment. Also, the nature and magnitude of differences in opinion between judges were explored in order to evaluate conditional proposition 1. The present section focuses on the sanctions that judges found most fitting in each of the criminal cases, thus serving as an evaluation of conditional proposition 2:

P2. If personal characteristics of judges play a significant role in sentencing, substantial differences are expected between judges’ sentencing decisions with regard to the same cases.

Before examining sentencing decisions in the scenario study in detail, the types of differences in sentencing that may be distinguished should first be specified. Clancy et al. (1981) distinguish two general types of disparity in sentencing: interjudge and intrajudge disparity. The first type occurs when there is dissension among judges over identical cases. The second type occurs when a given judge is unstable over time in his sentencing decisions with regard to ‘identical’ cases. Our concern here is with the first type of disparity. With respect to interjudge disparity, three general types of variation in sentencing decisions can be distinguished. The first is the variation in choice of principal punishments (i.e. prison, community service, fine). The second is the variation in choice of (additional) special conditions and measures (i.e. damage compensation, skills or deficiencies training, probation supervision). In the literature little attention is paid to this second type of variation. Although variation in sentencing due to differences in the use of special conditions may not be interpreted as variation in a formal judicial sense, it may, nevertheless, be of the utmost significance to both victims (e.g. compensation or restitution) and offenders (e.g. probation supervision, training programmes). These first two types of variation involve the choice of sanction-type and components of the sentence while the third type concerns the severity (or quantity) of the sanctions.

As described in Section 7.5, judges were able to select their sentences without any restrictions being imposed by the researcher. These written sentences were subsequently coded by the researcher. Quantification of the sentencing decisions was quite easy and straightforward.[v] The coding scheme that was employed is displayed in Appendix 2 with three examples for coding of sentences.

Table 8.10 through Table 8.13 show the principal punishments, measures and special conditions chosen for each of the criminal cases in the scenario study. The tables report percentages of judges who opt for a particular sanction or special condition (columns) as well as all combinations of sanctions and special conditions selected (rows) for the specific criminal cases. While these tables provide details relating to the first two types of variation in sentencing, variations in severity per component of the sentence (the third type of variation) have also been examined. For each component of the sentencing decision Table 8.14 reports measures of central tendency. As such, the table shows differences in sentencing severity between judges in each of the vignettes. [August, 2, 2016 – We are working on Table 8.10 through 8.13]

Punishment8.14

Table 8.14 Sentencing decisions in the four criminal cases: variations in severity per component of the sentence

The balanced vignette

Principal punishments
In the balanced vignette (Table 8.10) choices for principal punishments (prison, community service, fine) show a substantial partitioning of judges into two groups. While two thirds of Dutch judges prefer an unconditional prison sentence, the other 33 percent prefer a community service order. Although community service is formally linked to the prison sentence, they are quite different types of punishment (De Keijser, 1996; Jackson, De Keijser, & Michon, 1995).[vi] Most judges (90%) also specify a suspended prison term. Almost three quarters of these judges mention one or more special conditions with the suspended prison term.

Combinations with measures and special conditions
Combinations of principal punishments with measures and special conditions, the second type of variation, show a further differentiation in sentencing decisions. For almost two thirds of the judges, the sentence includes either compensation, probation supervision, training programme or a combination of these components. Half of the judges specify probation supervision in their sentence and more than a quarter mention damage compensation (either as a measure or as a special condition). Furthermore, just over 10 percent choose skills- or deficiencies training as a special condition. Table 8.10 shows that (the nature of) the combinations of these add-on components with principal punishments vary substantially.

Three specific sentencing decisions in the balanced vignette constitute the choice of almost half of the judges. One fifth of the judges see an unconditional prison term combined with a suspended prison term as the most fitting sentence. An equal number of judges add probation supervision (as a special condition) to this choice. The third major combination is
community service with a suspended sentence and probation supervision (10%).

Severity
Inspection of differences in severity per component of the sentence, the third type of variation, further refines the view of variation in sentencing decisions. While two thirds of the judges agree upon an unconditional prison term, they vary substantively in level of severity on this principal punishment (see Table 8.14). Unconditional prison terms in the balanced vignette range from 6 up to 24 months (Mean 13; SD 4.4). Community service orders (33%), on the other hand, vary less spectacularly. These range from 140 up to the maximum of 240 hours. The maximum is equal to the mode and is preferred by 54 percent. Suspended prison sentences vary between 2 and 10 months while 59 percent of these sentences is set at 6 months (mode). Damage compensation, either as a measure or as a special condition, ranges from NLG 150 to NLG 2600. More than half of the judges who mentioned damage compensation in their sentence do not specify an amount. Obviously, without detailed damage specification and without the victim joining the criminal procedure, judges find it hard to make concrete assessments of damage compensation.

The harsh treatment vignette

Principal punishments
In section 8.4 it was shown that there is wide agreement among Dutch judges concerning the type of treatment for the offender in the harsh treatment vignette. The goals of punishment that are generally associated with harsh treatment are clearly found to be the most important for the majority of judges. Indeed, as Table 8.11 shows, harsh treatment is what
this particular offender receives. No less than 94 percent of the judges prefer an unconditional prison sentence while the remaining few specify a community service order. Half of the judges specify a suspended prison term.

Combinations with measures and special conditions
There is no substantial disagreement between judges in relation to the type of sanction and combination of sanctions with special conditions. Eightysix percent either prefer a simple unconditional prison term (49%), or an unconditional prison term with a suspended sentence (20%), or unconditional prison with a suspended sentence and probation supervision (17%). Few judges make use of the suspended prison term to specify compensation or skills- or deficiencies training as a special condition.

Severity
The first two types of variation in sentencing decisions in the harsh treatment vignette are to a large extent absent in the harsh treatment vignette. However, the third type of variation, variation in severity, does show substantial differences in sentence length. While all but five judges specify an unconditional prison term, the length of the term varies between 6 and 30 months (Mean 18; SD 6.3).

The rehabilitation vignette

Principal punishments
In the rehabilitation vignette (Table 8.12) community service seems to be the obvious choice for most judges (82%). Even so, 15 percent still prefer an unconditional prison sentence in this case. Almost all of the judges (94%) specify a suspended prison term and most of these are combined with special conditions.

Combinations with measures and special conditions
As in the balanced vignette, combinations of principal punishments with special conditions further differentiate the sentences substantially. The combinations in this case, however, do not vary as widely as they do in the balanced case. Probation supervision is the most frequently specified special condition (58%). However, compensation and training programmes are also frequently selected (13% and 16% respectively) in combination with probation supervision. The most common sentences in this case are community service combined with a suspended prison term (25%), community service with suspended prison and probation supervision (30%) and community service with suspended prison, probation supervision and skills- or deficiencies training (11%). As such, sentencing decisions in this vignette are somewhat less diverse than in the balanced vignette.

Severity
In this case 82 percent of the judges preferred a community service order. The number of hours specified varies from 50 up to the maximum of 240 hours. Although the majority (54%) of these judges preferred the maximum number of hours, one fifth specified a community service order of 120 hours or less, while a quarter chose 140 to 180 hours. The same type of distribution characterises the choice of unconditional prison terms.

The reparation vignette

Principal punishments
In the reparation vignette, only a few judges specified an unconditional prison term. Seventy percent preferred a community service order (see Table 8.13). Over a quarter of the judges neither sentenced the offender to an unconditional prison term nor to perform community service. Instead, they predominantly sentenced the offender to a fine. This vignette constitutes the only case where a fine is preferred by a substantial number of the judges (21%).

Combinations with measures and special conditions
The only add-on component that is considered seriously by the judges in this case is damage compensation (47%), either as a measure or as a special condition with a suspended sentence. Most variation in components of the sentencing decisions is caused by the choice for principal punishments (community service versus fine), yes or no, combined with
damage compensation. Two sentences describe almost 60 percent of the choices made: 29 procent specify community service with a suspended prison term while an equal number of judges add damage compensation to that particular sentence.

Severity
As in the previous vignettes, variation in severity is substantial in the reparation vignette. While half of the judges who specify a community service order apply the maximum of 240 hours, the other half are evenly dispersed between 40 and 210 hours. The fines range from NLG 500 to NLG 3000. Damage compensation (amount is specified by more than half
of the judges who opt for this component) ranges from NLG 200 to NLG 1500 (Mean 758; SD 382).

Evaluation of conditional proposition 2
Three types of variation in sentencing have been considered: variation in choice of principal punishment(s), variation in combinations of principal punishments with measures and special conditions and variation in sentence severity. The sentences in the study involved the same criminal cases. Any differences in sentencing decisions per vignette must therefore lie in judges’ personal interpretation of characteristics incorporated in these cases, their personal views on punishment, or an interaction between the two (cf. Hogarth, 1971).

As with the preferred goals of punishment (see section 8.4), the most serious case in the scenario study, the harsh treatment vignette, elicits general agreement concerning the type of treatment: harsh treatment, i.e., unconditional imprisonment. While the type of treatment appears to be undisputed among judges, the severity of the prison term varies widely. The other vignettes, in contrast, elicit much more variation in type of sanction and combinations of principal punishments with measures and special conditions. While the offences portrayed in the balanced vignette, the rehabilitation vignette and the reparation vignette are by law serious enough to merit an unconditional prison sentence, the difference with the harsh treatment vignette lies in the presence of pointers for a more socially constructive perspective on treatment (i.e., rehabilitative and/or reparative). It is, therefore, important to note that different types of cases with different types of offenders elicit different types of variation in sentencing. After reviewing the sentencing decisions in each of the criminal cases in the scenario study, it must be concluded that variation in sentencing decisions in type of sentence as well as severity of the sentence is quite substantial. This leads to the following evaluation of conditional proposition 2:

E2. Personal characteristics of judges play a significant role in sentencing.
The scope of this evaluation needs some further qualification. Although personal characteristics of judges have been shown to play a significant role in their sentencing decisions, it would be incorrect to project the scale of variation shown in an experimental setting onto real-life court cases. In Chapter 5, a number of influences and constraints that level judges’ sentencing decisions were discussed. In the scenario study, such influences and constraints were absent. For example, in the vignettes there was no mention of the punishment requested by a public prosecutor, nor was there any deliberation in chambers with colleague-judges. In practice, despite the influence of such mechanisms, variation in sentencing nevertheless remains (see section 5.4). Although part of that variation may be due in practice to differences between cases in specific characteristics of offence and offender (‘no criminal case is exactly the same’), we have shown that differences persist even for identical cases. Furthermore, differences of opinion between judges may even influence some of the levelling mechanisms themselves. They may, for instance, seriously impair acceptance and consistent application of non-binding sentencing directives (cf. De Keijser, 1999).

Personal characteristics include a vast array of variables. The data do not allow a detailed analysis of all potentially relevant personal characteristics. Rather, from the outset, the focus has been on specific types of personal characteristic: penal attitudes in general and preferences for goals of punishment in specific criminal cases. Up until now, penal attitudes, preferences for goals of punishment and sentencing decisions in specific cases have been analysed independently. In the next sections they are analysed simultaneously. Relevance and consistency of these particular personal characteristics for sentencing decisions in the specified criminal cases are explored.

8.6 Goals of punishment and sanctions: consistency and relevance
In the previous sections preferences for goals of punishment and sentencing decisions have been examined in detail per vignette. Between the vignettes, distinct patterns have been shown to exist in both sets of variables. Underlying these distinct patterns, however, there is substantial variation among judges. While the analyses have focused on goals of punishment and sentencing decisions separately, this section considers patterns of association between both sets of variables. By analysing them simultaneously, consistency and relevance of goals of punishment are determined in the light of sentencing decisions per criminal case in the scenario study. As such, results of these analysis are used to evaluate conditional proposition 3:

P3. If preferred goals of punishment are relevant for choosing a particular sentence, or if a particular sentence is consistently rationalised by a preferred goal (or combination of goals), clear and consistent patterns of association are expected between goals of punishment and sanctions in individual cases.

Since a sentencing decision is generally a composite which includes more components than simply a principal punishment specified, considering variation within separate components of a sentence cannot do justice to the true variation in sentencing decisions. In other words, analysing components of a sentence separately may produce results which are unrealistic and perhaps too optimistic in view of sentencing decisions considered as composites. To increase utility and validity, sentencing models should incorporate multiple sentencing outcomes (Blumstein, Cohen, Martin, & Tonry, 1983; Mears, 1998).

To be able to analyse patterns of association between goals of punishment and multiple sentencing outcomes in an integrated manner, canonical correlation analysis was selected as being the most appropriate technique. Canonical correlation analysis may be used when each subject is measured on two sets of variables and one is interested in how these two sets relate to each other. In the scenario study, the two sets of variables per vignette are goals of punishment on the one hand, and components of the sentencing decision on the other. Canonical correlation analysis proceeds to maximise the relationship(s) between two sets of variables (Tabachnick & Fidell, 1996). If one is interested in screening for patterns of association, canonical correlation analysis is most likely to reveal them. Other techniques, such as structural equations models would require modelling particular patterns of association in advance which, in this case, is not the objective. Appendix 4 elaborates in more detail on relevant technical aspects of the application of canonical correlation analysis in the scenario study. [vii]

Table 8.15 shows the results of the canonical correlation analyses with the goals of punishment and sentencing decisions for each of the four basic vignettes in the scenario study. For every vignette two models which differ in the way that the variables in the set of sentence components were coded have been explored.[viii] Per model, sentence components were either employed as interval or as dichotomous variables. Furthermore the choice of coding depended on the number of judges specifying a particular sanction or special condition and the distribution in terms of severity (see Tables 8.10 through 8.14). Fine, compensation, probation supervision and training were always employed as dichotomous variables in the models.[ix]

Table 8.15 Goals of punishment (set 1) and sentencing decisions (set 2): structure correlations, canonical correlations, redundancies, scenario study 1998

Table 8.15 Goals of punishment (set 1) and sentencing decisions (set 2): structure correlations, canonical correlations, redundancies, scenario study 1998

Balanced vignette
As discussed earlier, unsuspended prison and community service are mutually exclusive in sentencing (i.e., community service can only be applied to substitute for an unsuspended prison term). Since all but one judge in the balanced vignette specified either an unsuspended prison term or community service, analyses including only the unsuspended prison sentence are reported for this vignette in Table 8.15. Results with respect to prison as a sentence component also provide information (but in an opposite direction) for community service.

For both models in the balanced vignette only the first pair of canonical variates is significantly correlated and reported. The shared variance of the canonical variates (rc2) is 24 percent for the model with all sentence components as binary variables and 30 percent when prison and suspended prison are employed as interval variables. Interpretation with the structure correlations is quite straightforward and similar for both models. The goals of punishment and sentence components appear to be associated according to the harsh treatment versus socially constructive perspectives. Judges with high scores for harsh treatment goals (deterrence, incapacitation and desert) and low scores for socially constructive goals (rehabilitation and reparation) prefer unconditional imprisonment. Conversely, preferences for the socially constructive goals, especially for rehabilitation, are positively associated with community service (i.e., not imprisonment), suspended prison, probation supervision, compensation and training. The strongest relation is between a judge’s score for rehabilitation and his or her choice between imprisonment and community service (model AI). Furthermore, length of the prison term increases with decreasing scores for rehabilitation (model AII).

Although the reported canonical correlations are statistically significant and the patterns of association are clearly interpretable and meaningful, inspection of redundancies reveals a less optimistic picture. If preferences for the goals of punishment are viewed as rationalisations of sentencing decisions, in model AII only 8.4 percent of the variance in the set of goal variables can be accounted for by the canonical variate of the sentence components. On the other hand, if preferences for goals of punishment are assumed to be relevant for reaching a sentencing decision, only 7.7 percent of the variance in sentencing decisions can be accounted for by the variate representing the goals of punishment. Either way, considering redundancies, more than 90 percent of the variance in both sets of variables remains unaccounted for.Although the reported canonical correlations are statistically significant and the patterns of association are clearly interpretable and meaningful, inspection of redundancies reveals a less optimistic picture. If preferences for the goals of punishment are viewed as rationalisations of sentencing decisions, in model AII only 8.4 percent of the variance in the set of goal variables can be accounted for by the canonical variate of the sentence components. On the other hand, if preferences for goals of punishment are assumed to be relevant for reaching a sentencing decision, only 7.7 percent of the variance in sentencing decisions can be accounted for by the variate representing the goals of punishment. Either way, considering redundancies, more than 90 percent of the variance in both sets of variables remains
unaccounted for.

Harsh treatment vignette
In section 8.5, it has been shown that in contrast to the other vignettes, the harsh treatment vignette revealed relatively little disagreement among Dutch judges regarding the type of sentence. All but five judges opted for an unconditional prison sentence in this criminal case, with or without the use of suspended prison or probation supervision. Severity of the prison sentence in this criminal case, however, varied widely.

Canonical correlations for both models (BI and BII) indicate more than 32 percent overlapping variance between canonical variates. Interpretation of the structure correlations does not differ between the models and is similar to the interpretation presented for the balanced vignette. While almost all judges have specified an unconditional prison term, the length of the prison term is negatively associated with higher scores for rehabilitation. Furthermore, judges with relatively high scores for rehabilitation tend to make additional use of suspended prison and, especially, probation supervision while desert is negatively associated with these add-on components. Redundancies are higher in the harsh treatment vignette than in the other vignettes. For instance, the amount of variance that the canonical variate of the goals extracts from the set of sentence components is 18.2 percent in model BI and 16.8 percent in model BII. However, this still leaves a substantial amount of variance in sentencing decisions unaccounted for in this vignette.

Rehabilitation vignette
Canonical correlations for both models are lower than in the other vignettes. Moreover, these correlations turned out not to be statistically significant. This renders interpretation with the structure correlations a tenuous and risky matter. In model CI, the set of goals show the same contrasts as in the balanced and harsh treatment vignettes and preferences for these goals appear to be associated with the choice for prison or community service in the expected manner. The structure correlation of suspended prison, however, is much more difficult to interpret in the light of the goals of punishment. Considering model CII, structure correlations appear extremely difficult to interpret. Moreover, redundancies indicate negligible portions of variance accounted for in both sets of variables. It must therefore be concluded that in the rehabilitation vignette no consistent patterns of association between goals of punishment and sentencing decisions could be shown.

Reparation vignette
In the reparation vignette, in contrast to the other vignettes, not specifying a community service order does not imply unsuspended prison. While 70 percent of the judges sentenced the offender to community service, only four judges from the remaining 30 percent specified an unconditional prison term (see Table 8.13). This may help to explain why both models show that harsh treatment goals and rehabilitation are not necessarily considered conflicting in the light of sentencing decisions. The choice for and severity of community service and suspended prison are positively associated with higher scores on harsh treatment goals (with the exception of deterrence) as well as rehabilitation. Simultaneously, concern for reparation tends to conflict with suspended prison and community service and is positively related to compensation and fine. In other words, judges with relatively high scores for rehabilitation and relatively low scores for reparation prefer harsher community service orders and longer suspended prison terms while they tend not to include compensation or fine in their sentence.

These judges are also more concerned with harsh treatment (mainly incapacitation) as an element in sentencing. Apparently, in a criminal case with characteristics of the offence and the offender as portrayed in the reparation vignette, the socially constructive goals of rehabilitation and reparation may be conflicting in considering type and severity of the sentence. Considering community service this finding is striking. At least in the restorative justice literature, community service is believed to accommodate both reparation and rehabilitation, although rehabilitation is not a primary aim (see Sections 2.7 and 7.6).

As with the previous vignettes, inspection of redundancies places these findings in a different perspective. At best, 12.6 percent of the variance in sentencing decisions may be accounted for by the variate representing the goals of punishment (model DII). While canonical correlations are significant and the pattern of association between the set of goals and sentence components do not pose problems of interpretation, these patterns only apply to a small portion of the variance that is actually shared between the two sets of variables.

Evaluation of conditional proposition 3
Per vignette, substantial variation both in preferences for goals of punishment and in sentencing decisions have been shown to exist in previous sections. If the variation in both sets of variables were linked in a consistent and substantial manner, results of the analyses just discussed would certainly have shown this. In the rehabilitation vignette, no significant patterns of association were found whatsoever. In the balanced vignette, the harsh treatment vignette and the reparation vignette, each analysis resulted in only one pair of significant and interpretable canonical variates.[x] Since sentencing was only related to the goal variables, considerable portions of unexplained variance were expected (see section 7.3).[xi]

Reported redundancies, however, showed the portions of variance in both sets of variables that remain unaccounted for to be too large to justify a favourable evaluation of conditional proposition 3. Thus, although in three of the four vignettes a rudimentary ‘sense of direction’ concerning the relation between goals of punishment and sentencing was apparent, results lead us to the following evaluation of conditional proposition 3:

E3. Preferences for goals of punishment are not very relevant for choosing a particular sentence. Conversely, sentencing decisions are not consistently rationalised by goals of punishment.
One might be tempted to blame this lack of consistency between goals of punishment and sentencing decisions on judges having different conceptions of goals of punishment (cf. Enschedé, Moor-Smeets, & Swart, 1975; Van der Kaaden & Steenhuis, 1976). However, it is not very likely that this factor underlies the current findings. To prevent any such misconceptions, all judges in the scenario study were presented with concise and clear definitions of the goals of punishment (see Section 7.5). Furthermore, in Chapter 6 it has been shown that even at the abstract and case- independent level, the relevant (theoretical) concepts can be measured in a consistent and valid manner. In short, Dutch judges certainly comprehend the meaning of the various goals and perspectives of punishment. Moreover, there is no reason to believe that judges in the scenario study did not reach their sentencing decisions in a deliberated and well-considered manner. Even though judges differ both in preferences for goals of punishment and in sentencing decisions with respect to identical criminal cases, consistent and substantial patterns of association between both sets of variables might still be expected. This expectation, however, has proven to be untenable. While judges might try to be consistent within themselves (cf. Hogarth, 1971), the very nature of ‘consistency’ between goals of punishment and sentencing differs substantially between Dutch judges.

8.7 Penal attitudes and goals of punishment: consistency and relevance
In this section Dutch judges’ penal attitudes as measured and discussed in Chapter 6 are related to their preferences for the goals of punishment in considering the four vignettes in the scenario study. The objective is to determine whether or not the personal penal attitudes held by judges are relevant for the goals of punishment they pursue in specific criminal cases. As such, results are used to evaluate conditional proposition 4: P4. If judges’ general penal attitudes influence their preferences for particular goals of punishment in individual cases, clear and consistent patterns of association are expected between general penal attitudes and goals of punishment in individual cases. The general structure of penal attitudes which was examined in Chapter 6, indicated a pragmatic approach to the functions and goals of punishment.

We therefore expected personal (abstract) penal attitudes to be relevant in specific criminal cases only if pointers that evoke the range of goals of punishment are equally present in a case. In such cases, penal attitudes would be employed as tie-breakers. In other cases, where pointers for particular goals are relatively prominent, individual penal attitudes would be irrelevant (see Chapter 7). Conditional proposition 4 was therefore split in two sub-propositions:

P4a. If pointers that evoke a particular goal of punishment are relatively prominent in a specific case, penal attitudes should not be expected to be very relevant for the preferred goals of punishment for that specific case.

P4b. If pointers that evoke the range of goals of punishment are equally present in a specific case, judges employ their personal penal attitudes as tie-breakers. Penal attitudes are expected to be relevant for the preferred goals of punishment for that case.

The evaluation of these conditional propositions was to be accomplished by comparing findings from the balanced vignette (equal pointers for the goals of punishment) with the other three vignettes (pointers for some goals relatively prominent). Before presenting and interpreting the findings, it should be reiterated that, as was shown in Section 8.4, we have only partially succeeded in creating a truly balanced vignette.

In determining the relevance of penal attitudes for preferred goals of punishment in the selected criminal cases, it is assumed that judges’ penal attitudes have remained relatively stable over the time span of one year between the penal attitude study and the scenario study.[xii] Data from both studies have been matched using background variables such as age, experience, gender, court and previous employment which were recorded in both studies. Data from two of the 84 judges from the scenario study could not be matched with the penal attitude data.

While Section 8.6 considered patterns of association between goals of punishment and sentencing decisions, this section involves patterns of association between penal attitudes and goals of punishment. Therefore the same type of analysis, i.e., canonical correlation analysis, was appropriate.

Two models have been analysed for each vignette. In the first model (I) the five scales representing attitudes toward Deterrence, Incapacitation, Desert, Rehabilitation and Restorative Justice were employed (see Chapter 6). In the second model (II) the set of five penal attitude scales has been reduced to (or, rather, summarised in) the two underlying perspectives of harsh treatment and social constructiveness. This reduction was achieved through principal components analysis with oblique rotation of the components. The first component represents Deterrence, Desert and Incapacitation (i.e., harsh treatment). The second component represents Rehabilitation and Reparation (i.e., socially constructive).[xiii] The attitude scale ‘Moral Balance’ was excluded from these analyses. Only the five penal attitude scales that clearly implicated the goals of punishment to be employed in the scenario study have been included in these canonical correlation analyses.[xiv]

Table 8.16 shows the results of the analyses with the penal attitude scales and goals of punishment for the four vignettes in the scenario study. The table shows none of the canonical correlation coefficients to be statistically significant with the exception of model II in the rehabilitation vignette.15 While more of these coefficients would have been statistically significant with greater sample size, reported redundancies show the penal attitudes not to be relevant for preferred goals of punishment in the scenario study. The variance in goals of punishment accounted for by the attitude variates never exceeds 4.5 percent.

Penal attitudes were not expected to be relevant in either the case of the harsh treatment vignette, the rehabilitation vignette or the reparation vignette. However, conditional proposition 4b stated the expectation that in the balanced vignette judges’ penal attitudes would indeed be relevant for their preferred goals of punishment. The variance in the goal set accounted for by the attitude variates in both models in the balanced vignette is as low as in the other vignettes. These findings lead to the following evaluation of conditional proposition 4:

E4. Judges’ general penal attitudes do not influence their preferences for goals of punishment in specific cases, even if pointers that evoke the range of goals of punishment are equally present in a specific case.

Table 8.16 Penal attitudes (set 1) and goals of punishment (set 2): structure correlations, canonical correlations, redundancies, scenario study 1998

Table 8.16 Penal attitudes (set 1) and goals of punishment (set 2): structure correlations, canonical correlations, redundancies, scenario study 1998

8.8 Concise review of findings
It has been argued that examining the relevance of moral legal theory for the practice of punishment requires studying penal attitudes as well as punishment in action. Results from the scenario study (i.e., punishment in action) complete the examination of the underlying legitimising framework of punishment.

In the scenario study, criminal cases have been presented to Dutch judges in order to consider differences in both their preferences for the goals of punishment and their sentencing decisions. Furthermore, the study aimed at determining whether or not substantial and consistent patterns of association exist between goals and sentences and also the relevance of abstract penal attitudes for pursuing particular goals of punishment in specific cases.

Using analyses consistent with the Graeco-Latin square design of the study, it has been shown that, as intended, the different versions of the four basic vignettes were essentially the same. Examination of average scores for the goals of punishment revealed profiles of the basic vignettes that were consistent with the manipulations of pointers. Underlying these average scores, substantial variation between judges has been shown to exist in considering the goals of punishment for the same criminal case. In the harsh treatment vignette, where pointers for rehabilitation and reparation were minimal, preferences for the goals of punishment varied less than in the other vignettes. In this vignette, most judges at least agreed on the type of treatment: harsh treatment. On the whole, however, variation in preferred goals of punishment was substantial enough to merit the conclusion that there is no commonly shared view among Dutch judges on the goals of punishment as they apply to specific cases (E1).

Regarding the sentences per vignette, different types of variation in sentencing have been considered: variation in choice of principal punishments, in the use of additional special conditions and measures and in severity. Overall, variation in sentencing with respect to the same criminal cases appeared to be considerable. It was shown that different types of cases with different types of offenders elicit different types of variation in sentencing. In the harsh treatment vignette, relatively little variation appeared in choice of principal punishment and special conditions. Severity of the prison term, however, varied widely between judges in this vignette. In the balanced vignette, on the other hand, the variation was predominantly apparent in choice of principal punishment as well as in the use of special conditions. Since all judges in the scenario study were presented with the same criminal cases, it was concluded that personal characteristics of judges play a significant role in sentencing (E2).

For the specific criminal cases in the scenario study, whether or not consistent patterns of association exist between preferences for goals of punishment and sentencing decisions was examined. Even with substantial variation in both sets of variables, consistent patterns of association might still be expected. Although the patterns of association that emerged from the analyses were readily interpretable, the variation that is actually shared between the preferences for goals and sentencing decisions turned out tobe minimal. Compared to the other vignettes, in the harsh treatment vignette preferences for the goals of punishment appeared to be most relevant for the sentencing decisions. Furthermore, the analyses revealed that, in so far as consistent patterns were shown, differences in preference for rehabilitation were especially relevant for differences in sentencing. Thus, although some sense of direction concerning the relation between goals of punishment and sentencing was apparent, it was concluded that judges’ preferences for goals of punishment are not very relevant for the choice of a particular sentence. Nor were sentencing decisions consistently rationalised by goals of punishment (E3).

Finally, the influence of judges’ penal attitudes on their preferred goals of punishment in specific cases has been examined. Penal attitudes were shown to be irrelevant for the goals which judges pursue in the selected cases. Although it was expected that penal attitudes would be employed as tie-breakers in the balanced vignette, where pointers for the range of goals were (about) equally present, this expectation proved untenable (E4). In the following and final chapter (Chapter 9), these results will be integrated in a concluding discussion on moral legal theory, legitimising frameworks and the practice of punishment.

NOTES
i. Unfortunately one judge was deceased.
ii. Interaction effects are not available for analysis when data are collected according to a Graeco-Latin square design because, in such a design, effects are not fully crossed (Swanborn, 1987; Tabachnick & Fidell, 1996).
iii. For the planned comparisons ‘Helmert’ contrasts have been employed.
iv. 4 In fact variance in average scores within the balanced vignette is roughly three times less than variance in average scores within the other three vignettes.
v. Operational periods of suspended sentences, if specified, have not been coded for analyses. ‘Probation supervision’ and ‘Skills or deficiencies training’ have been coded as simple dichotomous variables.
vi. Community service may only be imposed to substitute for an unconditional prison sentence with a maximum of six months. See section 5.3.
vii. For comprehensive discussions of canonical correlation analysis and its applications, see Thompson (1984), Stevens (1996) and Tabachnick and Fidell (1996).
viii. See Appendix 4.
ix. Concerning fine and compensation, there were too many judges not specifying an exact monetary amount to validly employ these variables at the interval level. Furthermore, in case of interval coding, the zero-category would be ‘unnaturally’ deviant.
x. If the sample size in this study had been considerably larger, subsequent pairs of canonical variates might have been statistically significant in some of the models. Inspection of added redundancies (not displayed) related to second pairs of variates, showed that this would lead to only marginal increases (1 to 3 percent) in total redundancy.
xi. This would be a caveat if the aim had been to create an explanatory model of sentencing disparity (cf. Palys & Divorsky, 1986; Lemon & Bond, 1987).
xii. In fact, it is quite common to assume that attitudes are relatively stable over time (cf. Oskamp, 1977).
xiii. Explained total variance in this two-component solution is 71 percent. Component correlation (after oblique rotation) is 0.07.
xiv. See Section 7.3. Analyses including the Moral Balance scale (not displayed) did not yield substantial increase in canonical correlations or redundancies.
xv. Bartlett’s V (18.48) exceeded the critical χ2 value (18.31; a=.05, df=10) by only .17.