Punishment And Purpose ~ Penal Attitudes Among Dutch Magistrates
 6.1 Introduction
In previous sections a theoretically informed instrument and model for measuring penal attitudes has been developed. The instrument has first been applied to a sample of Dutch law students and then, after some revision, replicated with a second sample of law students. From both an empirical and theoretical point of view, analyses led to the conclusion that a six-dimensional structure is most appropriate and tenable for describing penal attitudes. Factor- and scale-analyses showed Deterrence, Incapacitation, Desert, Moral Balance, Rehabilitation and Restorative Justice to form internally consistent and readily interpretable dimensions and scales.
Results from the factor- and scale analyses on law students’ data have served as the foundation for a basic Structural Equation Model (SEM) of penal attitudes (the so-called baseline model). This baseline model was presented in Section 4.7. To further validate the measurement instrument and confirm results of the studies with law students, the baseline model is tested with data collected from judges in Dutch criminal courts. Such a sequence of analyses involving the use of data from different samples is believed to be effective for simplifying, refining and confirming a basic model (Bryant & Yarnold, 1995).
After testing the structural equation model we will proceed to construct corresponding summated rating scales. This will be carried out in a manner similar to that discussed in previous sections. The rating scales of penal attitudes will subsequently be used for more descriptive purposes. These rating scales will also re-appear in Chapter 8 where they will play an important role in analyses concerning magistrates’ views in concrete sentencing situations.
In Section 6.2 the process of data collection and some of the pitfalls involved are discussed. The organisation of Dutch criminal courts from which data were collected was described in the previous chapter. Section 6.3 describes response rates in some depth and Section 6.4 provides some background statistics of the sample of Dutch judges involved in this study. After these preparatory sections, the structural equation model is put to the test in Section 6.5. Subsequently definitive summated rating scales pertaining to the theoretical concepts are constructed and described in more detail in Sections 6.6 and 6.7. The chapter concludes with a concise discussion of the salience of penal attitudes among Dutch magistrates and their own perceptions of colleagues’ penal attitudes in Section 6.8.
6.2 Data collection
Data for our study have been collected from judges and justices in the criminal law divisions of the District Courts and the Courts of Appeal. Judges in Courts of Limited Jurisdiction were not of interest to this study since aside from civil cases, they hear mostly misdemeanours. Neither were justices in the Supreme Court of interest. These justices do not consider the facts of a case, but instead focus on issues of (formal) law. Therefore, only judges and justices from the 19 District Courts and the five Courts of appeal have been included in this study.[i]
A first step in preparing for data collection was to compile a list containing the names and court addresses of all judges working in the criminal law divisions of the district courts and courts of appeal. The list excluded deputy judges.[ii] Compiling the list was quite laborious. Two sources of names were available as a starting point: The ‘List of Names of the Dutch Judiciary’ (Dienst Rechtspleging van het Ministerie van Justitie, 1997) published by the Ministry of Justice and the ‘Guide to the Dutch Judiciary’ (Berger-Wiegerinck et al., 1997). Judges in the Netherlands are appointed to a court, not to a specific division (e.g. civil law, criminal law, administrative law) within the court. Furthermore Dutch judges frequently rotate between the divisions of a court. Because of this functional mobility, existing lists of names do not specify the division of a court a judge is working in. This problem was resolved by submitting requests for this supplementary information to each court’s registry. One district court refused to supply this information. An ‘educated guess’ as to which judges were working in the criminal law division was obtained from a lawyer in that particular region of the country. One court of appeal also refused to supply this information. The chairman of the criminal law division of this court of appeal, however, named the number of judges in his division and kindly agreed to distribute the questionnaires. The list was completed in May 1997.[iii]

Table 6.1 Numbers of judges in criminal law divisions of Dutch district courts and courts of appeal (boldface) according to the list, May 1997
Table 6.1 shows the numbers of judges in criminal law divisions of the district courts and courts of appeal on the list. Given the somewhat imprecise methods that were sometimes used to collate these numbers, they should be treated with some caution. The imprecisions will most likely lead to a slight underestimation of the true number of judges in criminal law divisions in Dutch district courts and courts of appeal. However, although such minor imprecisions are likely, we have no reason to expect severe underestimation.
Since the population of interest to this study is fairly limited in magnitude (N=385, see below), from the outset response has been a pivotal matter of concern. It is generally acknowledged that surveys by mail frequently suffer from (extremely) low response rates, even for short questionnaires. An additional problem that is especially pressing in mailed questionnaires is the danger of (too many) unanswered questions (cf. Dillman, 1978). These problems threaten external validity. Although not a great deal of empirical research has been carried out with the Dutch judiciary, this problem has already impaired some previous research (e.g. Van der Land, 1970). Response problems may be caused by numerous factors such as characteristics of the population, sensitivity of the research topic(s), presentation of the questionnaire, specific wording of particular questions, concerns for anonymity, attitudes towards (social science) research, timing of follow-ups and length of the questionnaire. To maximise response, all aspects of a study should be designed to create the most positive overall image (Dillman, 1978, p. 8). In making the necessary preparations for data collection, due attention has therefore been paid to as many of these aspects as possible.
Most judges in the Netherlands are members of a professional association called the ‘Netherlands Association for the Judiciary’[iv]. It was believed that a letter of recommendation from the chairman of the criminal law division of this association would provide an important impetus for judges to respond positively to our requests for co-operation. The chairman kindly agreed to provide such a recommendation. A copy of this letter of recommendation accompanied all questionnaires. To further encourage response rate, two weeks before sending out the actual questionnaires, letters of introduction were sent to the chairpersons of the criminal law divisions in all courts and courts of appeal. This letter of introduction stated the objectives of the research project. Furthermore the letter asked if they would be kind enough to notify the judges in their divisions that a questionnaire pertaining to this particular research project was forthcoming. Finally, careful attention was paid to the lay-out of the questionnaire and all questionnaires contained clear instructions.
The questionnaires were posted in June 1997. Each questionnaire was accompanied by the above mentioned letter of recommendation as well as a letter containing some background information on the research project and a request for co-operation. Two weeks after mailing the questionnaires, a reminder was sent to all judges restating the importance of response for external validity of the project and once again kindly requesting their co-operation. Judges were not required to reveal their identity. Completed questionnaires were to be returned anonymously in unmarked, pre-paid response envelopes. Respondents were also asked if they would be willing to co-operate in a follow-up study. If they agreed to do so, they were asked to write their name and address on a separate slip of paper. To safeguard anonymity, this slip was to be returned in a separate pre-paid envelope. Apart from a number of general questions and some questions pertaining to socio-economic characteristics, the bulk of the questionnaire consisted of attitude statements. These attitude statements were identical to those included in the second study with law students.

Table 6.2 Response rate per court, July 1997
6.3 Response
Over a period of two months, completed questionnaires were received by mail. By the end of July 1997 a total of 168 questionnaires had been completed and returned. The resulting overall response rate is 44 percent. Although a sample of 168 might be judged by some to be somewhat low for purposes of quantitative analyses, it should be noted that this number constitutes almost half of the population of judges in Dutch criminal courts. Table 6.2 shows response rates calculated per district court and per court of appeal. The table reveals a fair amount of variance in response rates. The highest response rate of 77 percent was obtained from the district court in Utrecht while the lowest response rate of 13 percent was obtained from the court of appeal in ‘s-Hertogenbosch. In most courts, however, between 30 percent and 50 percent of judges in the criminal law divisions completed and returned the questionnaire. Low response rates combined with small absolute numbers of respondents in particular courts indicate that it would be unwise to make statements pertaining to individual courts or differences between courts based on these data. Furthermore, for the same reason, detailed descriptions of data per court might endanger the anonymity of judges in particular courts. When relevant, such data will therefore only be reported after the courts have been grouped at the territorial level of jurisdiction of the courts of appeal[v].
Table 6.3 shows percentages of responding judges grouped at the territorial level of jurisdiction of the courts of appeal (hofressort). The first column of the table shows percentages in the sample (N=168), while the second column shows percentages in the list (N=385). Table 6.3 shows no substantial over- or underrepresentation of judges from particular jurisdictions.

Of the 168 responding judges 106 (63%) stated their willingness to be involved in the follow-up study.[vi] In summary, given that the total number of judges who were eligible to take part in this study is fairly limited (385), from the outset response rate has been a pivotal matter of concern. Paying due attention to the various aspects that were believed to be important in enhancing judges’ willingness to participate has produced a final response rate of 44 percent. Although response varies substantially between courts, grouped at the level of hofressort the five jurisdictions are represented proportionally in the sample.
6.4 Sample
The questionnaire contained some questions pertaining to background characteristics such as age, gender, specific function, experience in the criminal law division and previous occupation. Table 6.4 reports the grouped age distribution in the sample. Age distribution in the sample ranges from 30 to 69.[vii] The average age of responding judges coincides with the median and is 48.1 years (within a standard deviation of 8.5 years).
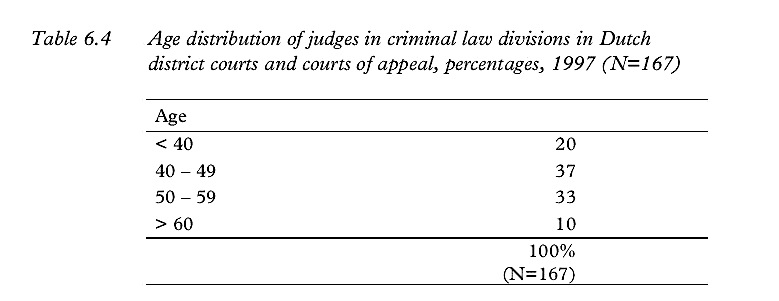
Table 6.4 Age distribution of judges in criminal law divisions in Dutch district courts and courts of appeal, percentages, 1997 (N=167)
In a survey of composition characteristics of the Dutch judiciary, De Groot-van Leeuwen observes a steady decline in average age of Dutch magistrates between 1951 and 1986. The average age of all judges was 53.2 in 1951 and 49.6 in 1986 (De Groot-van Leeuwen, 1991, p. 65). While the data reported here pertain to a subset of all judges[viii], with some caution the mean age of 48.1 might be taken as an indicator of further rejuvenation of the Dutch judiciary.[ix] Substantially correlated with age is the amount of experience judges report in practicing criminal law (r=0.61). The average amount of experience reported is 6.7 years (within a standard deviation of 5.6 years). Experience ranges from two months to over 30 years, while two thirds of the judges have between one and eight years of experience. In the list 33 percent of all judges are female while 28 percent of responding judges are female. This means a slight under-representation (by 5%) of female judges in the current sample.
Respondents were also asked about the specific function that they occupy in the criminal law division of their court.[x] Available functions were juvenile judge, police judge, trial judge in a panel of judges at a district court, trial judge in a panel of judges at a court of appeal and judge of instruction (investigative judge). All respondents from courts of appeal sit in panels of judges. At the district courts only 20 percent of judges carry out one single task in the court. In most cases this task is that of judge in a panel of judges. The remaining judges who perform just one function either work as a juvenile judge, police judge or judge of instruction. The vast majority (80%) of judges in district courts report to perform two or even three functions in the court. Table 6.5 shows the most common combinations of functions in district courts.

Table 6.5 Most common combinations of functions in district courts, percentages, 1997 (N=138)
It should be emphasised that the situation reported in table 6.5 is a volatile one. Judges in district courts are not just mobile between divisions of the courts; also within the criminal law division, functions are quite easily alternated, added or reduced. The particular function or combination of functions is not a constant in time. In relation to the gamut of functions available in the criminal law divisions, judges in the district courts certainly appear to be widely employable generalists within the system. The vast majority of judges do not practise law in isolation from other judges. Even judges who carry out a single function as unus iudex are highly likely to participate in a panel of judges in the near future or have done so in the recent past.
As indicated in Section 5.2, there are two ways for candidate judges to become eligible for appointment after obtaining a university degree in law: a candidate must either have followed the six-year magistrate training (RAIO training), or have a minimum of six years experience in a legal profession. Table 6.6 shows the professions of respondents directly prior to their appointment as judge. The percentages in Table 6.6 cumulate to more than 100 percent, due to a number of judges reporting some combination of these professions prior to their appointment as judge. Comparing data from the years 1951, 1974 and 1986, De Groot-van Leeuwen (1991, p. 67) observes a decline in the percentage of judges recruited from the six year magistrate training (59% in 1951, 57% in 1974, 45% in 1986). In the present sample, one third of the judges has gone through the six year magistrate training (RAIO) prior to being appointed as judge. This could be indicative of a further decline in the proportion of judges recruited from magistrate training in favour of judges recruited from other legal professions.

Table 6.6 Profession prior to appointment, percentages, 1997 (N=168)
More judges come from advocacy (27%) than from any other legal profession. Only 6 percent of the judges have came from the Public Prosecutors Office. Most of the remaining judges have either a background in business, university law faculties or the civil service. In summary, no substantial systematic flaws have been noted in sample composition. Respondents’ average age is 48. Number of years of experience in practising criminal law averages seven years and increases with age. Almost a third of the sample is female. Only 20 percent of respondents practice criminal law in isolation from others as unus iudex. Furthermore, two thirds of responding judges have been recruited from other legal professions, while one third has gone through the six-year magistrate training prior to their appointment as judge.
6.5 Testing the structural equation model of penal attitudes
This section is divided in two parts. The first part discusses analysis and results of the baseline structural equation model of penal attitudes presented in Section 4.7. The second part is focused on theoretical interpretation of the findings.
6.5.1 Analysis and results
Structural equation models for this study have been estimated with EQS (Bentler, 1992) using the maximum likelihood method.[xi] Input for all analyses was the observed variance-covariance matrix (not presented). Goodness-of-fit was evaluated using information from χ2 test results, the Comparative Fit Index (CFI) and from inspection of standardised residuals.[xii]
Traditionally, model fit in structural equation modelling (SEM) used to be evaluated by the χ2 test. However, there has been an increasing dissatisfaction with this goodness-of-fit measure because X2 significance testing is heavily influenced by sample size. The judges’ data comprise a sample of relatively small size (N=168). Therefore, χ2 test results are used to asses model fit in two ways. First, by comparing fit of different models, i.e., comparing the modified model to the baseline model (Bentler, 1992); second, by computing the χ2 to degrees of freedom ratio. A rule of thumb is that good model fit may be indicated when the χ2 to degrees of freedom ratio is less than 2 (cf. Tabachnick & Fidell, 1996).
The comparative fit index (CFI), provided by EQS, is one of the numerous goodness-of-fit indices which has been developed as an alternative to the χ2 significance test. The CFI takes into account the number of degrees of freedom of the model, but is not affected by sample size (Bollen, 1990). According to Bentler (1990) the index is the least (negatively) biased in small samples among those provided by EQS. The CFI should be over .90 to indicate satisfactory model fit.
Standardised residuals indicate the difference between the observed sample covariances and the covariances predicted by the model (in standardised form). Generally, the residuals should be small, their distribution should be (roughly) symmetric and centered around zero. One should not find residuals with extreme values (cf. Tabachnick & Fidell, 1996). Initially, the baseline model of penal attitudes among Dutch judges, that was presented earlier in Figure 4.2, did not fit the data satisfactorily. After removing five outliers and three cases with many missing responses on the relevant variables, a CFI of .79 and a χ2 value of 664.96 (df=399, p<.001) were obtained. Some minor modifications to the baseline model were necessary to arrive at an acceptable final model: four observed variables (items) were excluded and two observed variables were assigned to another latent variable. Regarding correlations among the latent variables (the structural part of the model), one correlation was dropped and two correlations were added to the model. The final model (N=161) resulted in a CFI of .92. The χ2 test result was 378.75 (df=292, p<.001), yielding a χ2 to degrees of freedom ratio of 1.30. Both measures indicate satisfactory model fit. Furthermore, goodness-of-fit is supported by the considerable decrease (286.21) inχ2 value of the final model compared to the baseline model. The standardised residuals showed a symmetric distribution, centered around zero, without notable extreme values. A higher degree of fit might have been achieved by freeing (adding) more parameters and cancelling some others, or even by exclusion of more observed variables. In principle however, we set out primarily to examine a pre-conceived theoretical structure. Therefore, model modifications presented here are few and only to a very limited extent motivated from a data-driven point of view.
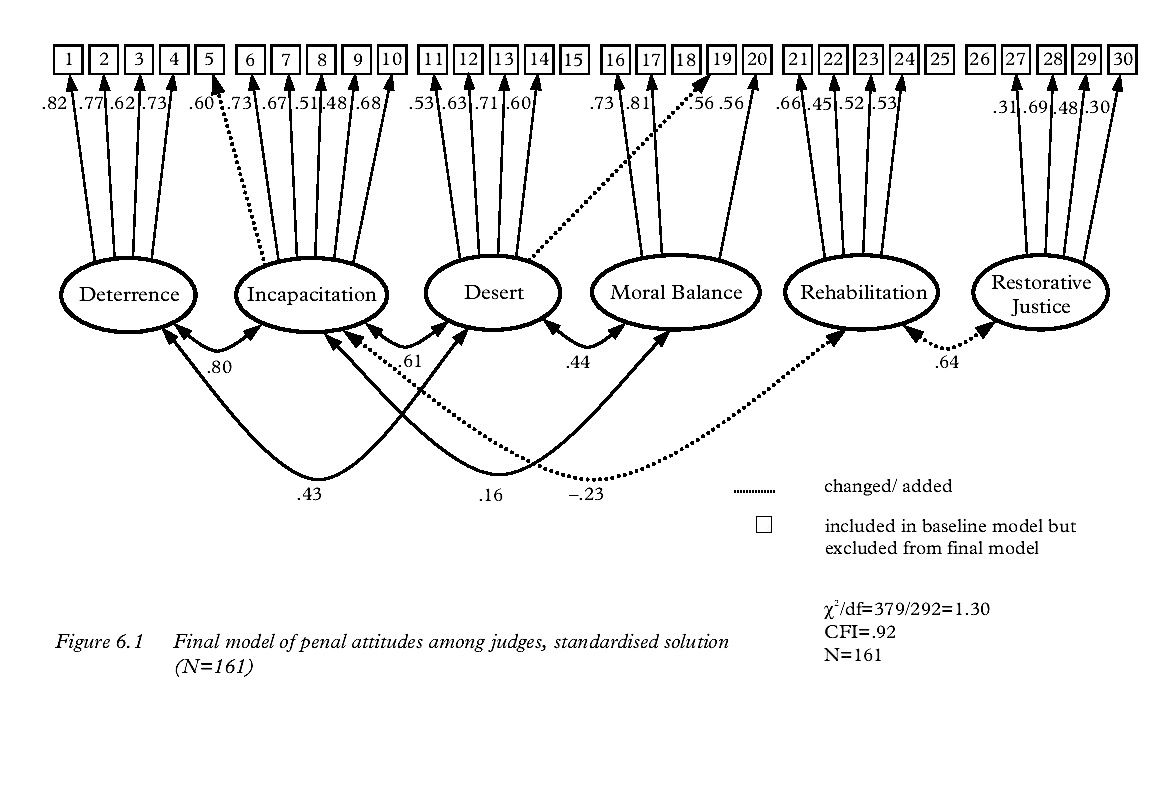
Figure 6.1 Final model of penal attitudes among judges, standardised solution (N=161)
Figure 6.1 shows the standardised solution of the final model. Comparison of the baseline model of Figure 4.2 with the final model in Figure 6.1 reveals the revisions that were made to arrive at acceptable model-fit.
In Figure 6.1, the item-numbers correspond to those previously reported in Table 4.8. The modifications to the baseline model are clearly marked. Dotted connections in the Figure show parameters that were changed or added. Grey shaded items in the model indicate variables that were included in the baseline model but excluded from the final model.
Figure 6.1 shows that parameters concerning two items (5, 19) needed change of latent variables to improve fit. Inspection of these two items and the respective latent variables shows that this does not change the theoretical interpretation of the model at all. Item 5 (“Most people who advocate resocialisation measures for perpetrators of offences attach little importance to the seriousness of the crimes committed”), a Deterrence-item in the baseline model now becomes part of the Incapacitation factor. Taking the content of this item into consideration, there seems to be no theoretical reason to reject this change. Indeed regarding Deterrence and Incapacitation this item can be perceived as quite equivocal. Item 19 (“The meting out of punishment to perpetrators of offences is a moral duty”) is now associated with the Desert factor instead of the Moral Balance factor in the baseline model. Both these latent variables are components of retributivism: Moral Balance is expected to function more like a general justifying aim while Desert serves to provide the goal at sentencing. Given this close theoretical interlinkage between both latent variables, the fact that 19 changed from Moral Balance to Desert, is not damaging to the theoretical structure as a whole. Further theoretical interpretation of the model is discussed in the following section.
6.5.2 Interpretation
As expected Deterrence and Incapacitation are highly correlated latent variables in the model (r=0.80). Theoretically these concepts are distinguishable within the utilitarian approach. Together, however, as noted in Section 4.7, they represent a mix of individual and general prevention characterised by ‘harsh treatment’. Judges (as well as law students) most likely view deterrence and incapacitation as prevention through harsh treatment, probably with the prison sentence in mind. Apart from a high correlation between Deterrence and Incapacitation, Figure 6.1 shows both these utilitarian concepts to be substantially correlated to the retributive concept of Desert (r=0.43, r=0.61 respectively). Although Desert stems from a different philosophical theory, these concepts clearly have something in common. A plausible explanation is fairly evident. Each of these concepts is generally associated with punitiveness, or, rather, harsh treatment in general. Concerning the Dutch practice of punishment, Hoefnagels (1980) has argued earlier that these theoretically distinct concepts are frequently used quite arbitrarily to justify harsh treatment. Moral Balance seems laterally related to these ‘punitive’ concepts, mainly through its correlation with the retributive concept of Desert (r=0.44). From a theoretical point of view this latter correlation is quite natural since restoring the moral balance is a general justifying aim within the retributive doctrine (see Chapter 2). Although the individual concepts associated with punitiveness and harsh treatment remain discernible at both a theoretical and an empirical level, they are substantially correlated. It is therefore important to note that in terms of, for instance, a severe prison sentence, punitiveness can be justified by a variety of theoretical arguments and may be aimed at achieving different goals. The philosophical roots of such harsh treatment may vary considerably and cannot be unveiled or understood just by looking at the concrete sanction that was meted out.
Juxtaposed to the punitive concepts in Figure 6.1, we find Rehabilitation and Restorative Justice. Modelling an extra correlation between Incapacitation and Rehabilitation significantly improved fit, as did modelling an extra correlation between Rehabilitation and Restorative Justice (see dotted parameters in the structural part of the model).[xiii] Although Rehabilitation and Incapacitation are both utilitarian methods for individual prevention, the correlation between the two is a negative one (r=– 0.23). From all ‘punitive’ concepts, incapacitation is perhaps most readily indicative of the prison sentence. Since the 1970’s it has become generally accepted that imprisonment and resocialisation may be in conflict. While resocialisation and rehabilitation were priorities in detention policy during the 1970’s, today in prison policy they have been more or less abandoned in favour of ‘safe, humane and efficient’ execution of the prison sentence (cf. De Keijser, 1996; Hirsch Ballin & Kosto, 1994).
Interpretation of the added correlation between Rehabilitation and Restorative Justice is somewhat less trivial. While these concepts do not seem to be associated substantially with the punitive concepts discussed above, they do have a substantial positive correlation (r=0.64) with each other. As discussed in Chapter 2, an important impetus for the development of the Restorative Justice approach has been a high degree of dissatisfaction with the existing retributive and utilitarian approaches. In the Restorative paradigm the objective of a judicial intervention is not to punish, nor to re-educate, but to restore and compensate for the damage done. At first sight, this might even lead one to expect a negative correlation between Rehabilitation and Restorative Justice. How then can such a substantial positive correlation between Rehabilitation and Restorative Justice be explained? The answer to this question is twofold.
First, there is an inclination in the Netherlands of mixing conflict resolution as proposed (in a more radical form) by Hulsman (see Chapter 2) and other restorative aspects with resocialisation. Moreover, there appears to be a tendency in Dutch sentencing practice to regard restoration or conflict resolution not as autonomous objectives, but as a means to achieve resocialisation. In other words, Restorative Justice has not (yet) developed as a full alternative paradigm in the minds of Dutch magistrates.
Rather, in Dutch penal practice, restorative aspects are still seen as a means of helping to bring about behavioural changes in offenders. Bentham stated that a sanction is better learned and makes a longer lasting impression in the mind of the offender when it bears an analogy to the offence (Bentham, 1789 /1982, ch. XV, sct. 7–9; see Chapter 2). Regarding the qualitative aspects of the offence, confronting offenders with the harm they have inflicted and obliging them to make reparation is quite promising in terms of lasting impressions and therefore has the potential to resocialise.
This is best illustrated by Dutch community service sentences which, ideally, bear analogy to the offence (cf. Ploeg & Beer, 1993). The second and related explanation for the correlation between Rehabilitation and Restorative Justice is that the Restorative paradigm does not disqualify rehabilitation and resocialisation of offenders. In the restorative justice literature, resocialising effects of a restorative intervention are regarded as probable and desirable spin-offs (e.g., Bazemore & Maloney, 1994; Walgrave, 1994; Weitekamp, 1992). Resocialising aspects of restorative interventions, though not the primary objectives, are therefore explicitly acknowledged by proponents of the restorative paradigm. In short, while Restorative Justice and the utilitarian concept of Rehabilitation are quite distinct from a theoretical perspective, in (Dutch) practice they are very much intertwined. Both Rehabilitation and Restorative Justice concentrate on socially constructive aspects of the reaction to offending. Rehabilitation involves socially constructive aspects of the offender and his position in society. The Restorative Justice view is mainly concerned with socially constructive aspects concerning the position of the victim and its relation to the offender. In penal practice, both views may be considered complementary.
In summary, the baseline model of penal attitudes that was constructed in Chapter 4 with data obtained from Dutch law students (see Figure 4.2) has been tested with data obtained from judges in Dutch criminal courts. The baseline model required only minor modifications before an acceptable degree of fit could be reached. Rather than proving our initial findings to be flawed, these modifications have improved our understanding of penal attitudes held by Dutch judges. Although, given the sample size, some prudence is called for results concur with previously formulated ideas concerning the structure of penal attitudes and are viewed as yet another confirmation of the validity and usefulness of the measurement instrument. In this study the risk of capitalising on chance is reduced by concurrent results of different empirical studies: in three different samples, two student samples and one judge sample, (basically) the same structure in penal attitudes was found. By this replication of results, the substantive meaning of the proposed model is therefore strongly supported. Results suggest two general dimensions to underlie judges’ penal philosophies: harsh treatment on the one hand and social constructiveness on the other.
6.6 Rating scales for penal attitudes
The structural equation model above involved the simultaneous estimation of two components: a measurement model concerning relationships between observed and latent variables and a structural model concerning interrelations between latent variables. In this section rating scales are constructed representing the various theoretical constructs (latent variables). Interrelations between such rating scales will no longer be constrained by the simultaneous estimation of a measurement model. Instead, we can now safely assume that the scales constitute valid and reliable representations (as intended) for the theoretical constructs and proceed as if they were observed variables.
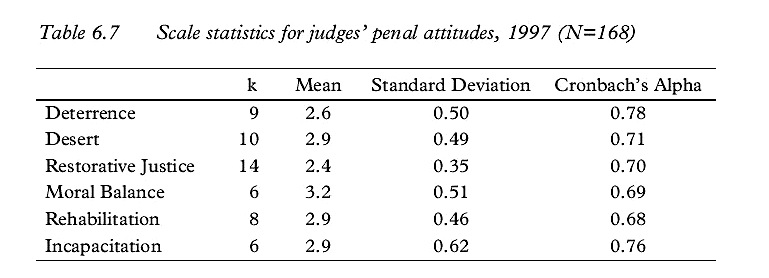
Table 6.7 Scale statistics for judges’ penal attitudes, 1997 (N=168)
The rating scales for judges are based on the same items that were used in the two studies with law students. The items used in the structural equation model are, of course, parts of the respective summated rating scales. Table 6.7 shows the number of items in each scale, means, standard deviations and internal consistencies of the scales. The summated scales have been divided by the respective numbers of items included in the scales. The Table shows internal consistencies for the six scales to be fair and quite acceptable, ranging from 0.68 (Rehabilitation) to 0.78 (Deterrence). Comparison of the scale means suggests that, on the whole, Dutch judges have a somewhat more favorable attitude towards restoring the Moral Balance (mean score 3.2), than towards any of the other sentencing objectives. The mean score on the Restorative Justice scale (2.4) is lower than that on any of the other scales.
Standard deviations reported in Table 6.7 show a fair amount of variance in summated rating scale scores. Although standard deviations provide insight in variance in scores on the separate scales, it would be desirable to have an objective standard against which to compare the distributions. Such a standard is provided by the standard normal distribution. Values for kurtosis and skewness can be transformed to z-scores and subsequently tested for significant deviation from the standard normal distribution (Tabachnick & Fidell, 1996). Transformations of these values into zscores (not displayed) showed that none of the scales were significantly more peaked or flat compared to the normal distribution. Regarding skewness, only the Moral Balance scale was found to be significantly, but not very substantially, negatively skewed (–.57, z=–3.0, p<.01). Apart from this exception, there were no further significant departures from normality in the scales.
Before turning our attention to some more detailed analyses of differences between Dutch judges in terms of penal attitudes, interrelationships and dimensionality underlying the six attitude scales have been further examined by applying yet another technique. The six summated rating scales have been analysed using PRINCALS: PRINCipal components analysis by Alternating Least Squares (Gifi, 1990; Van de Geer, 1988). After variables are transformed according to the ‘ALS’-algorithm the technique proceeds quite similarly to ordinary principal components analysis (PCA). However, contrary to ordinary principal components analysis, PRINCALS allows data of various measurement levels (interval, ordinal, nominal) to be analysed simultaneously. Furthermore, interpretation is facilitated by the programme’s graphically orientated output.
Figure 6.2 shows the results of the PRINCALS analysis on the six rating scales.[xiv] This is a so-called vector diagram. The vectors in Figure 6.2 represent component loadings of the rating scales in an unrotated twodimensional space.[xv] The ‘importance’ of the scales in the (twodimensional) solution is represented by the length of the vectors. More importantly for present purposes, however, is the relative orientation (angles) of the vectors. An increasingly small angle between vectors indicates an increasingly high correlation between the respective scales, and vice versa. If two or more vectors coincide, they correlate perfectly. A perpendicular orientation of vectors, on the other hand, indicates zero correlation.
Figure 6.2 to a high degree visualises interrelationships that were estimated between latent variables in the structural equation model of Figure 6.1. Two main ‘clusters’ of vectors can be discerned in Figure 6.2:
1. Rehabilitation and Restorative Justice;
2. Moral Balance, Desert, Incapacitation, Deterrence. The fact that the terms ‘punitive concepts’ and ‘non-punitive concepts’ have been used above, might be taken to imply that both types of concepts are part of a common underlying punitiveness dimension.
This, however, is not the case. Although highly correlated amongst themselves, sentencing objectives freely associated with punitiveness (Deterrence, Incapacitation, Desert, and, to a somewhat lesser degree Moral Balance) are virtually uncorrelated with the ‘non-punitive’ objectives of Rehabilitation and Restorative justice: in Figure 6.2 both clusters of vectors are positioned in a near-perpendicular (orthogonal) orientation. If there had been a true underlying punitiveness-dimension to these concepts, the respective vectors would be pointing in opposite directions, that is, be highly negatively correlated. Therefore, in the minds of Dutch judges a favorable attitude towards Desert, for instance, does not necessarily imply a negative attitude towards Rehabilitation and Restoration. In fact, the attitude towards Desert has no predictive value for attitudes towards Rehabilitation and Restoration.

Figure 6.2 Judges’ penal attitudes: component loadings of six penal attitude scales (PRINCALS), 1997 (N=168)
At first sight one might be tempted to view Figure 6.2 as the visualisation of something that comes very close to the hybrid penal philosophy that is said to be dominant in the Netherlands: the general justification for punishment, its essence, is provided by retribution. Below the limits defined by retribution, notions of utility determine the choice concerning mode and severity of punishment.[xvi] Interpreting Figure 6.2 as such, restoring the Moral Balance in society would then be seen to represent the general retributive justification. The Moral Balance vector is positioned between Rehabilitation and Restorative Justice on the one hand, and Incapacitation, Desert and Deterrence on the other. All vectors in the Figure are, in varying degree, positively correlated with Moral Balance. It should be noted, however, that the Moral Balance vector is shorter than the other vectors.
After some careful consideration, however, several reasons should lead one to conclude that Figure 6.2 does not represent such a hybrid penal philosophy. First, Moral Balance provides the general justification with Restorative Justice and Desert among the remaining (uncorrelated) perspectives while the hybrid theory would prescribe only utilitarian principles to guide the further choice of punishment. Secondly, the figure cannot and does not imply a hierarchy among penal objectives as is supposed in the hybrid approach. Thirdly, there is no place in the hybrid theory for restorative justice. Fourthly, from both a theoretical and a practical point of view concepts such as Rehabilitation and Desert are hardly reconcilable.
The fact that such concepts are neither substantially positively nor negatively correlated leads one to suspect another process underlying Figure 6.2. Although sentencing objectives related to harsh treatment, irrespective of their philosophical roots, correlate highly amongst each other and Rehabilitation and Restorative Justice correlate highly as well, the choice for a guiding principle in concrete sentencing situations may be largely determined by eclectic considerations. One perspective does not a priori exclude the other, although the attitude towards restoring the Moral Balance in society is more or less reconcilable with whichever perspective is favoured. The fact that these general attitudes towards punishment are not characterised by mutually exclusive categories will facilitate eclecticism in the more concrete stadia of the sentencing process.[xvii] The discussion can be further illustrated when we consider the results of a factor analysis with the six rating scales of penal attitudes. Factor analysis on the attitude scales with oblique rotation of factors (with eigenvalue greater than one) resulted in two uncorrelated factors (r=0.12, p=0.13).
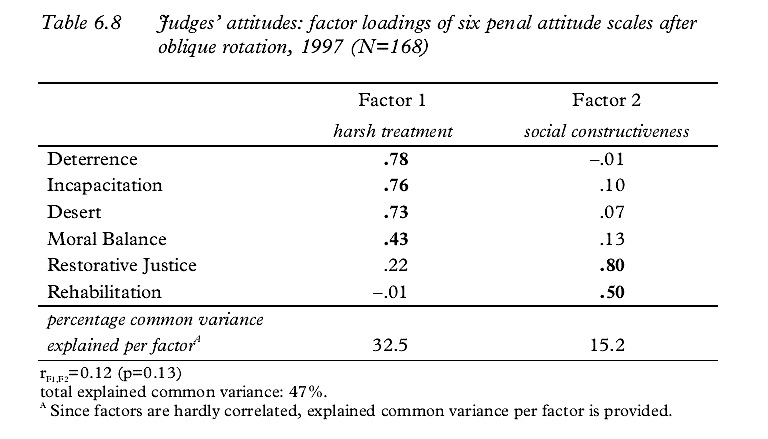
Table 6.8 Judges’ attitudes: factor loadings of six penal attitude scales after oblique rotation, 1997 (N=168)
Deterrence, Incapacitation, Desert, and (to a somewhat lesser extent) Moral Balance have high factor loadings on the first factor, while Restorative Justice and Rehabilitation have high factor loadings on the second factor. The factor loadings are presented in Table 6.8. Two independent dimensions underlying the six attitude scales were once again identified. The first factor is labelled harsh treatment. The second factor, uncorrelated with the first, covers the socially constructive perspectives. Clearly, and not surprisingly, this analysis confirms the previous findings. Since the two dimensions are uncorrelated, one would expect particular characteristics of the offence and the offender to determine the balance between these perspectives in concrete cases.
Clearly in the minds of magistrates interrelations between the concepts measured do not reproduce the abstract philosophical frameworks of penal doctrine as described in Chapter 2. Judges may not be expected to fully reproduce the structure of abstract penal doctrine: ‘general philosophical principles become translated into the specific, concrete and, inevitably, more limited rules’ (Hogarth, 1971, p. 69). Although the various concepts from moral legal theory have proven to be distinguishable, meaningful and measurable, associations between the concepts may be seen to reflect some kind of practical penal philosophy (cf. Hogarth, 1971). Judges’ attitudes in general seem to merge into a more streamlined and pragmatic approach to punishment. The question arises whether such a practical and pragmatic ‘penal philosophy’ can still legitimise the practice of punishment in a consistent and normatively acceptable manner. This question will be elaborated upon further in Chapter 8.
In summary, the theoretical constructs derived from the various theoretical positions have proved to be consistently meaningful and measurable concepts in the minds of magistrates. After confirmatory analyses using structural equation modelling in Section 6.5, we proceeded to construct rating scales representing the respective theoretical concepts. The scales for Deterrence, Desert, Incapacitation, Moral Balance, Restorative Justice and Rehabilitation exhibited quite acceptable internal consistencies, ranging from 0.68 to 0.78. In-depth examination of interrelationships between the scales using varying techniques showed a pattern of association among the concepts that was readily interpretable and very similar to that estimated in the structural equation analyses. If one would insist on further reduction of the dimensionality in these data, the observed patterns of association among the scales pointed to two underlying uncorrelated dimensions: harsh treatment and social constructiveness.
6.7 Penal attitudes and background characteristics
Although our research efforts have been focused on the measurement of penal attitudes and determining interrelationships between attitudes toward various sentencing objectives, a limited number of judges’ background characteristics were available for some further analyses. In the previous sections the measurement and structure of penal attitudes have been discussed and examined in detail. This section relates judges’ penal attitudes to a number of background characteristics. Apart from the specific court or court of appeal where a judge works, information pertaining to characteristics such as age, gender, specific function in the criminal law division, experience in the criminal law division and previous occupation were available. Each of these characteristics has been described in more detail in Section 6.4. To unveil any possible influences that these background characteristics might have on judges’ penal attitudes, a PRINCALS analysis was carried out in much the same way as with the six rating scales in the previous section. This time, the full potential of the PRINCALS method is utilised because we are simultaneously analysing data of different measurement levels.
Of the background characteristics mentioned above, only gender, age and years of experience appeared to be substantially related to penal attitudes. This was established by examining the so-called ‘row sums’ of the background characteristics in the PRINCALS output in concurrence with (univariate) analyses of variance (not displayed) of these background characteristics with the rating scales. Of course age and experience are confounded (r=0.61 as reported in Section 6.4). It was assumed that experience is the characteristic that really matters here. Therefore, a final PRINCALS solution was generated using only experience, gender and the six scales for penal attitudes.
While the scales were analysed as ordinal variables, ‘gender’ and ‘years of experience’ have been included in the analysis as nominal variables.[xviii] In calculating co-ordinates for categories of nominal variables, in contrast to ordinal variables, there are no restrictions regarding relative orientation (ordinality) of the co-ordinate points. Figure 6.3 displays the result of this PRINCALS analysis. The format of this figure is somewhat different from the previous figure. The scales in Figure 6.3 are no longer represented by vectors, but rather by straight lines running through the respective category points (1 through 5) of each scale. The figure depicts associations between variables and categories simultaneously in several ways. As in Figure 6.2 angles between scales still represent correlations. Perpendicular projections of seperate category points of gender and experience onto the scales will show the general (average) position of judges with that characteristic on the particular scale. Furthermore association between nominal category points is represented by their closeness in space.
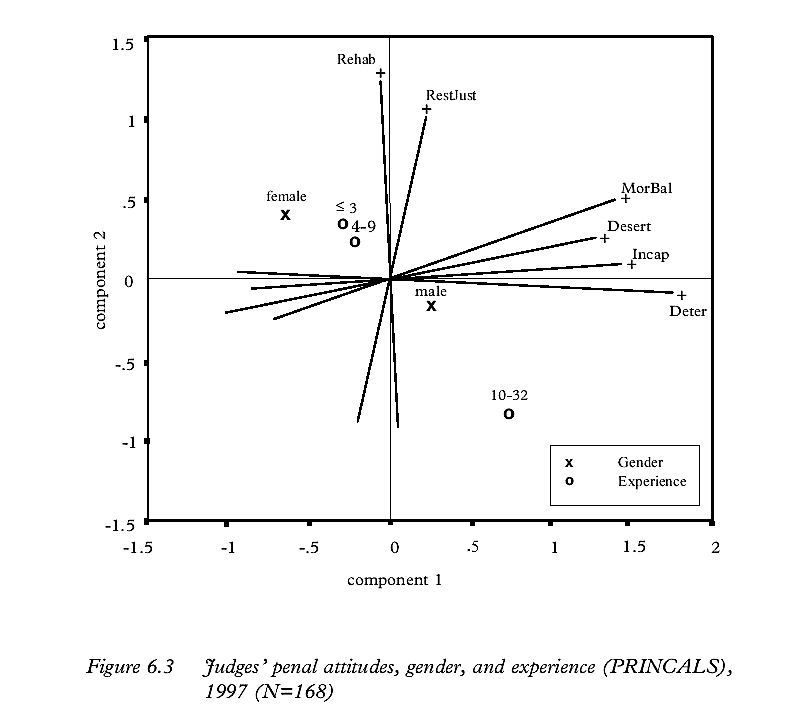
Figure 6.3 Judges’ penal attitudes, gender, and experience (PRINCALS), 1997 (N=168)
Associations between the penal attitudes need no further explanation since the relative orientation of the respective lines represents the same structure as in Figure 6.2. Figure 6.3 shows that male and female judges have different attitudes concerning the concepts related to harsh treatment. Male judges do not stand out in terms of excessive ‘punitiveness’. Female judges, however, are less favourable towards Incapacitation, Deterrence and Desert than their male counterparts.
Furthermore, Figure 6.3 shows differences between more and less experienced judges in terms of their penal attitudes. Criminal judges with 9 years experience or less[xix] have relatively favourable social constructive attitudes while simultaneously they tend to be situated on the ‘mild’ sides of the scales representing Moral Balance, Incapacitation, Deterrence and Desert (harsh treatment). Criminal judges with extensive experience up to 32 years, however, have less favourable attitudes towards social construction. Simultaneously, these more experienced judges have a more favourable attitude towards ‘harsh treatment’ than their less experienced peers (cf. Bond & Lemon, 1981). It must be noted, however, that differences between experience categories in terms of socially constructive attitudes are predominantly due to differences in Rehabilitation attitudes and not to differences in Restorative Justice attitudes.[xx] Various (rather trivial) explanations for this observation come to mind. One explanation might be that more experienced judges have become increasingly disappointed with the ‘socially constructive’ potential of the criminal justice system. The resulting ‘numbness’ leads to more favourable attitudes towards harsh treatment of offenders. At this stage, however, such an explanation is mere speculation. Before even beginning to elaborate on such explanations, one has to prove that this phenomenon is really due to experience, not to other variables that may differ in time. A reasoned explanation would require longitudinal study of penal attitudes in conjunction with in-depth analyses of other variables.
In summary, analyses relating some background characteristics of respondents to their penal attitudes, showed gender and experience both to have substantial impact. Female judges showed less favourable attitudes to ‘harsh treatment’ than did their male colleagues. Furthermore, preferences towards ‘harsh treatment’ increase with the amount of experience while, at the same time, support for social construction is dropping.
6.8 Salience and assessment of colleagues’ attitudes
Before penal attitudes will be examined in the light of concrete sentencing situations in the following chapters, one final issue needs to be addressed. In Chapter 3, the attitude concept was already discussed in some detail. Attitudes, it was argued, are supposed to have a motivational function with respect to behaviour (see Section 3.2). The extent to which an attitude is likely to guide behaviour is believed to be influenced by the salience (i.e., accessibility) of the attitude toward a particular object. Consistency between attitude and behaviour is therefore expected to increase with (amongst other things) attitude salience (Ajzen, 1988, pp. 79–80).
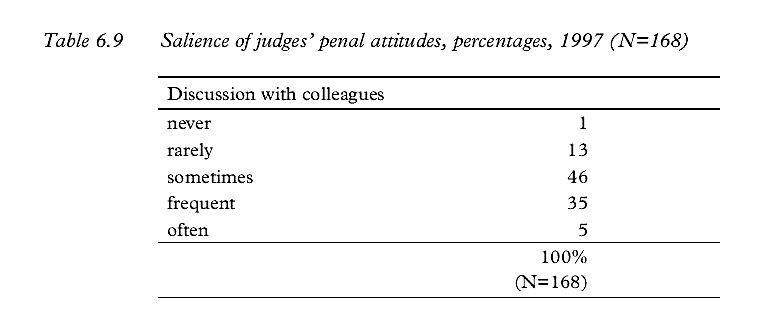
Table 6.9 Salience of judges’ penal attitudes, percentages, 1997 (N=168)
Although in the practice of sentencing there are many formal, social and situational constraints and influences on magistrates’ behaviour, some general indication of penal attitude salience would be welcome as complementary information in the context of this study. Such an indication was obtained by asking respondents how often they discuss various (normative) aspects of punishment such as the general justification and goals at sentencing with their colleagues. Table 6.9 shows the judges’ responses to this question.
Table 6.9 shows that relatively few judges (14%) never or rarely discuss justifications and goals of punishment with colleagues. While 46 percent of the magistrates sometimes discuss these topics with their peers, 40 percent of the magistrates discuss functions and goals of punishment frequently (35%) or even often (5%) with their colleagues. In general, therefore, penal attitudes should be quite accessible (salient) in the minds of judges in Dutch criminal courts.
A final bit of information concerning judges’ penal attitudes was obtained by asking them about their perception of attitudinal variation among Dutch judges in criminal courts concerning goals of punishment. Furthermore, they were asked to give an indication of in how far they thought their own penal attitudes were different from those of their colleagues. Both questions were answered using seven-point scales ranging from 1 ‘no difference’ through 7 ‘a great deal of difference’. Table 6.10 shows responses to both questions.
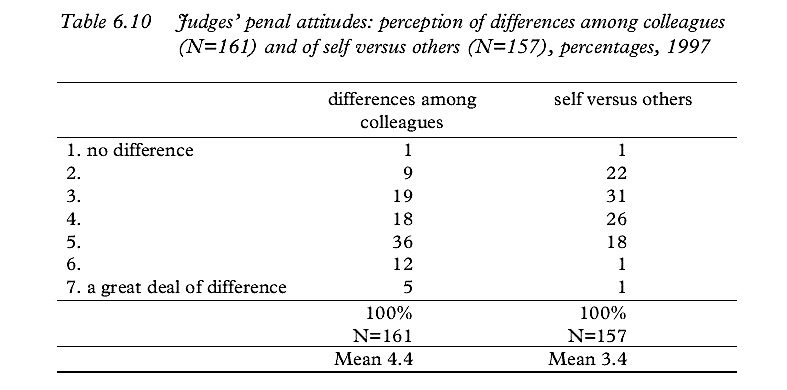
Table 6.10 Judges’ penal attitudes: perception of differences among colleagues (N=161) and of self versus others (N=157), percentages, 1997
Average scores on both scales are also provided in the table which shows that judges in general seem to perceive a fair amount of differences in penal attitudes among their colleagues (Mean 4.4). Only 29 percent of respondents perceive little or no differences in judges’ penal attitudes.[xxi]
When asked about the degree to which respondents believe their own penal attitudes to diverge from those of their colleagues, the opposite pattern emerged. Not many judges find their own attitudes to be very different from their colleagues’ attitudes (Mean 3.4). Only one fifth of the judges perceive a fair amount of difference between their own attitudes and those of their colleagues. This confirms a finding earlier reported by Hogarth that regardless of their own penal attitudes, judges tend to view themselves as being in the mainstream of thinking. Possibly this is caused by a process of selective perception of others’ penal attitudes (Hogarth, 1971).
Finally, as might be expected, the two perceptions reported in Table 6.10 are substantially correlated (r=0.50, p<0.01): a judge who perceives his penal attitudes to differ from those of his colleagues is quite likely to perceive a lot of difference in general and vice versa. These perceptions, however, are not significantly affected by the number of times judges discuss these matters with their colleagues.
In summary, taking the frequency of discussing topics related to functions and goals of punishment as an indicator of penal attitude salience (i.e., accessibility), we may conclude that, in general, penal attitudes are quite readily accessible in the minds of Dutch judges. However, despite frequent discussions among magistrates, they perceive a fair level of differing attitudes among themselves while, at the same time, think that their own attitude is not much different from others’.
NOTES
i. See Section 5.2 for a discussion of the organisation of Dutch criminal courts.
ii. Each court has a number of deputy judges. The list excluded this group since their primary occupation is usually other than being a judge in a criminal court. Some judges working in one court are deputy in another court. As such, they would be included in the list. Many other deputy judges are either members of the law faculties of the various Dutch universities or work as attorney.
iii. Below the phrase ‘the list’ will be repeatedly used and refers to this self-compiled list of names of judges and justices in the criminal law divisions.
iv. Nederlandse Vereniging voor Rechtspraak (NVvR).
v. i.e., hofressorten; see Section 5.2.
vi. See Chapter 7 and Chapter 8.
vii. By law, the maximum age for judges in Dutch courts is fixed at 70.
viii. Only judges in criminal law divisions in district courts and courts of appeal.
ix. It might, however, also be indicative of the tendency of younger judges to be somewhat more willing to respond.
x. The term ‘function’ is used here to refer to different types of judges as described in Section 5.2.
xi. I thank Rien van der Leeden for his invaluable help with these analyses.
xii. See De Keijser (2000) for a concise introduction to structural equation models and EQS. See also Bentler (1986, 1990, 1992), Bollen (1989, 1990) and Jöreskog & Sörbom (1993) for more detailed discussions of structural equation modelling.
xiii. Note that these correlations concur with correlations reported in Table 4.7. These correlations were, however, not used in the baseline model because they were found to be relatively insubstantial.
xiv. Prior to the analysis, the scales have been recoded so that they ranged from the integers 1 (relative negative attitude) to 5 (relative positive attitude).
xv. 15 Princals component loadings: Rehabilitation (.02; .84), Restorative Justice (.26; .78), Moral Balance (.62; .15), Desert (.82; –.07), Incapacitation (.78; –.10), Deterrence (.80; –.21).
xvi. See Chapter 2 for a discussion of this and other hybrid theories.
xvii. See Chapter 2 for a discussion of eclecticism as a sentencing strategy.
xviii. Years of experience has been recoded in three categories: ‘less than three years’, ‘four through nine years’ and ‘ten through thirty-two years’.
xix. The figure shows that females are somewhat better represented among the relatively lesser experienced judges than males.
xx. This was revealed through univariate analysis of variance.
xxi. Hogarth had asked Magistrates from Ontario a similar question with similar outcome: the majority of Canadian judges felt that there is lack of uniformity concerning sentencing philosophy (Hogarth, 1971, p. 182).