Punishment And Purpose ~ Punishment In Action: The Scenario Study
No Comments yet 8.1 Introduction
In the previous chapter the design and selection of vignettes for the scenario study were presented. This chapter reports on the results. Consistency and relevance of goals of punishment in the light of sentencing decisions are examined within and across vignettes. Due attention is given to differences in sentencing decisions within the framework of the criminal cases presented. Furthermore, the role of general penal attitudes in choosing preferred goals of punishment for the selected criminal cases is scrutinised.
The results will be presented in the following way. Following a description of data collection and sample characteristics in Section 8.2, undesirable framing effects of version are analysed in Section 8.3 using the full potential of the Graeco-Latin square design. In Section 8.4 judges’ preferences for goals of punishment are examined in detail within and across vignettes. The basic vignettes were designed to differ from each other in terms of pointers that are expected to evoke preferences for different sentencing goals (see Table 7.5 in Chapter 7). Given this manipulation, planned comparisons between the vignettes have been carried out to examine whether judges’ preferences for goals of punishment concur with our expectations. Subsequently, in Section 8.5, profiles of the basic vignettes in terms of sentencing decisions are presented. Within each criminal case variation in sentencing decisions is discussed. Once the goals of punishment and sentencing decisions have been examined independently, they are analysed simultaneously in Section 8.6. For the balanced vignette (A), the harsh treatment vignette (B), the rehabilitation vignette (C), and the reparation vignette (D), patterns of association between sentencing goals and sanctions are analysed and discussed. Finally, in Section 8.7, the relevance of judges’ general penal attitudes for choosing preferred goals of punishment in the presented criminal cases is examined and discussed.
8.2 Data collection and sample
At the end of the initial questionnaire examining judges’ general penal attitudes (see Chapter 6), respondents were asked whether they would be willing to co-operate in a follow-up study. If they agreed to do so, they were asked to write their name and address on a separate slip of paper. Of the 168 judges who responded in the penal attitude study of 1997, 106 (63%) stated their willingness to be involved in a follow-up study. This panel of 106 judges therefore formed the target group for the scenario study.
In order to minimise panel attrition due to any changes in respondents’ employment position or address, the courts’ registries were contacted in May 1998. The vast majority of the 106 judges still held the same position as they had one year earlier. In 1998, only 12 percent of the judges had either moved to another court or were working in another division within the same court (e.g. civil law division). The decision was made to include these judges.
In May 1998 a letter introducing the scenario study was sent to all 105 judges in the panel.[i] In this letter, judges were reminded of their co-operation in the first study and of their stated intention to co-operate in the follow-up study. Furthermore, the nature of the follow-up study was described and they were asked once more for their co-operation. At the end of May 1998 the questionnaires containing the vignettes as well as an accompanying letter were posted. Questionnaires were to be returned anonymously in pre-paid response envelopes. With two-week intervals, two reminders were sent restating the importance of response for external validity and again kindly requesting co-operation. Within two months, 84 judges had completed and returned the questionnaire, yielding a response rate of 80 percent. Since the scenario study only involved subjects who had previously stated their willingness to co-operate, such a high rate of response had been anticipated. These 84 respondents constitute 22 percent of the original population of 385 judges.
The average age of respondents in the scenario study is 49.2 compared to 48.1 a year earlier in the penal attitude study. Furthermore, in the scenario study 26 percent of responding judges are female (28 percent in the penal attitude study). Table 8.1 shows percentages of judges grouped at courts of appeal jurisdictions (hofressorten) for respondents in the scenario study and for judges in the original population list from the criminal law divisions (see Section 6.2). The table shows that judges from the Arnhem jurisdiction are overrepresented in the scenario study by 15 percent. Judges from ’s-Gravenhage (The Hague) and particularly from ‘s-Hertogenbosch are relatively underrepresented in the sample. This implies that some prudence is called for when considering regional generalisation of the study findings.

Table 8.1 Judges grouped at the territorial level of courts of appeal (hofressort): 1998, percentages in sample and in list of population
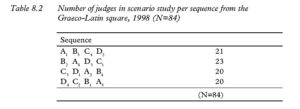
For the repeated measures analyses reported below, the numbers of judges per sequence of vignettes from the Graeco-Latin square design needed to be equal. As discussed in Chapter 7, the 105 judges were randomly assigned to one of four equal groups (i.e. three groups of 26 and one group of 27) thus producing ‘replicated squares’ (Maxwell & Delaney, 1990). Table 8.2 shows the numbers of respondents per sequence of the design. Judges who responded are evenly distributed over the four sequences of vignettes.
In summary, response rate in the scenario study reached a quite satisfactory 80 percent, just over one fifth of the general population of interest. Regional representativeness of the current sample is somewhat limited. The numbers of judges who completed and returned the varying sequences from the Graeco-Latin square design of the study are almost identical thus requiring only a minor adjustment to arrive at equal groups. In Section 8.3 the total variance in responses is partitioned into the effects of interest to the study with particular emphasis on undesirable effects of version
8.3 Examining framing effects
In Chapter 7, the reasons for framing the basic vignettes (A through D) differently were explained. These included making the experimental manipulation of pointers less obvious and increasing the external validity of the study. Different versions (1 through 4) of the same basic vignettes were designed containing essentially the same information. As such, differences in framing were neither meant nor expected to result in any substantial effect on judges’ responses.
Making full use of the analytic possibilities provided by the Graeco-Latin square design, the total variance in responses was partitioned into all discernible main sources of variation, including variation due to version.[ii] For estimating and testing effects of version, the emphasis was on variation in judges’ preferences for the goals of punishment.
In contrast to a between-subjects design, within-subjects designs provide the opportunity to further reduce residual (error) variance thereby resulting in more sensitive significance testing. Because measurement of sentencing goals was repeated four times for each individual judge, variability among the subjects due to individual differences can be determined and removed from the error term (cf. Stevens, 1996). Put differently, each subject in a within-subjects design may serve as his or her own control (Maxwell & Delaney, 1990). Furthermore, variation in responses due to the position of a vignette in the sequence of four vignettes (first, second, third or fourth) can be extracted. As a result of counterbalancing in the design (discussed in Chapter 7), this source of variation was (a priori) equally distributed over the different vignettes. Total variance in responses can thus be partitioned into variation due to subjects, position in sequence, basic vignette (A through D), version (1 through 4) and residual or error variance.
Four subjects were excluded from the repeated measures analyses to arrive at exactly the same number of subjects per sequence from the design (see Table 8.2 above). Two of these subjects were excluded because of missing values and two others were randomly excluded. Tables 8.3 through 8.7 show the results of the repeated measures analyses with the five goals of punishment. For each goal (deterrence, incapacitation, desert, rehabilitation and reparation) total variance in responses is partitioned into separate sources of variance. F-statistics are calculated to test variance due to undesirable effects of version.
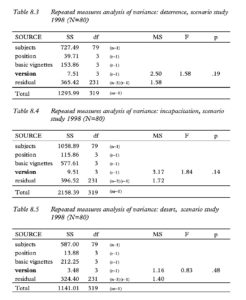
Table 8.3 Repeated measures analysis of variance: deterrence, scenario study 1998 (N=80) Table 8.4 Repeated measures analysis of variance: incapacitation, scenariostudy 1998 (N=80) Table 8.5 Repeated measures analysis of variance: desert, scenario study 1998 (N=80)
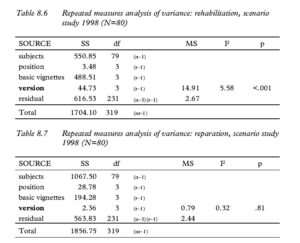
Table 8.6 Repeated measures analysis of variance: rehabilitation, scenario study 1998 (N=80)
Table 8.7 Repeated measures analysis of variance: reparation, scenario study 1998 (N=80)
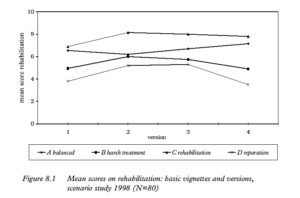
Tables 8.3 through 8.7 show that, with the exception of rehabilitation, judges’ preferences for the goals of punishment were not affected by the versions of the basic vignettes presented to them. The effect of version on judges’ preference for rehabilitation in the vignettes is statistically significant, although it only accounts for less than 3 percent of the variance: SSversion=44.73 while SStotal=1704.10 (Table 8.6). Given that this is the only statistically significant effect of version that was found, that it is insubstantial and that every version occurred an equal number of times in combination with every basic vignette, it is possible to conclude that there were no overall effects of version (i.e., framing) on judges’ responses. Figure 8.1 further supports this conclusion by showing that the different versions did not substantially distort judges’ preferences for rehabilitation between basic vignettes: the lines designating the basic vignettes in the figure do not cross. The relative order of basic vignettes does not change across versions, which means that effects of version on rehabilitation do not overshadow the effects of basic vignettes.
The Tables 8.3 through 8.7 also show that there are two main sources of variance in the responses, namely variance due to individual differences between judges and variance due to the basic vignettes. These are the sources of variation that represent the main focus of interest in the scenario study. The remainder of this chapter disregards the different versions of the basic vignettes and concentrates on (differences in) judges’ preferences for goals of punishment and their sentencing decisions.
8.4 Preferences for the goals of punishment
In this section judges’ preferences for particular goals of punishment are examined in detail within and across vignettes. Furthermore, the question of whether or not there is a commonly shared vision among judges on the goals of punishment that apply to specific cases is explored (cf. conditional proposition 1, Section 7.2).
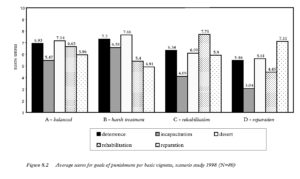
Recall that the basic vignettes were designed to evoke differences in preferences for five goals of punishment: deterrence, incapacitation, desert, rehabilitation and reparation (see Chapter 7, Table 7.1). Figure 8.2 shows the average scores for these goals of punishment in each of the basic vignettes.
Inspection of Figure 8.2 shows that, on average, the vignettes evoked the predicted preferences. For instance, within the ‘harsh treatment vignette’ (B), the average scores for deterrence, incapacitation and desert are higher than the average scores for rehabilitation and reparation. Furthermore, deterrence, incapacitation and desert are found to be more important in the ‘harsh treatment vignette’ than in any of the other vignettes. Similarly, in the ‘reparation vignette’ (D), the goal of reparation is found to be more important than any of the other goals while comparison between vignettes shows that the average score for reparation is highest in the ‘reparation vignette’. The figure further shows that deterrence and desert are considered to be important goals of punishment (albeit to a lesser extent) even for the ‘rehabilitation vignette’ and the ‘reparation vignette’.
To support these findings statistically, planned comparisons among the average scores within and between the vignettes have been carried out.[iii] Table 8.8 shows judges’ average scores for deterrence, incapacitation, desert, rehabilitation and reparation in each of the basic vignettes. The last column of the table reports planned comparisons among the goals of punishment within each vignette. The last row of the table reports planned comparisons between the vignettes for each goal of punishment. All of the planned comparisons in Table 8.8 show differences between the average scores to be substantial and significant. The balanced vignette (A) was designed to incorporate equal pointers for deterrence, incapacitation, desert, rehabilitation and reparation. Figure 8.2 shows that differences between the average scores for these goals of punishment in the balanced vignette are indeed of a smaller magnitude than in any of the other vignettes.[iv] However, an overall comparison of means shows the differences between average scores for goals of punishment within the balanced vignette to be statistically significant (F (4, 316)=10.44, p<.001). Obviously, the relatively low average score for incapacitation (5.47) in the balanced vignette contributes substantially to this finding. It must therefore be concluded that we have only partially succeeded in creating a truly balanced vignette while patterns of (average) responses in the other vignettes are consistent with our intentions.
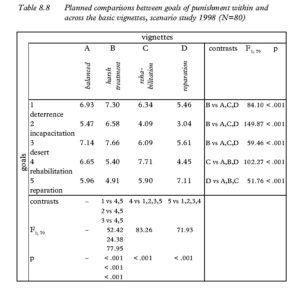
Table 8.8 Planned comparisons between goals of punishment within and across the basic vignettes, scenario study 1998 (N=80)
Inspection of average preferences for the goals of punishment among Dutch judges has been useful in producing overall profiles of the vignettes in terms of preferred goals of punishment, but it does not tell us anything about individual differences between judges. Yet, the magnitude of such differences is important for determining consistency among judges’ in their preferences for goals of punishment in specific cases. At this point, we return to the conditional proposition 1 that was formulated in Section 7.2 and is reiterated here:
P1. If there is a commonly shared vision among judges on the goals of punishment that apply to specific cases, few differences are expected between judges in their preferred goals of punishment in the same cases.
The scenario study enables examination of this proposition for the four specific robbery cases: the balanced case, the harsh treatment case, the rehabilitation case and the reparation case. A rather straightforward manner of examining differences in preferences for the goals of punishment in these cases is to inspect the standard deviations in responses. Table 8.9 reports these standard deviations per basic vignette.
The standard deviations reported in Table 8.9 indicate a fair amount of variability in preferences among judges. For comparison, in a standard normal distribution 68 percent of the subjects are located in the range between plus one and minus one standard deviation from the mean. Correspondingly, roughly two thirds of the judges in the sample have a score for incapacitation in the balanced vignette that varies between 3.09 and 7.85 (i.e., 5.47±2.38) and one third preferred a score outside this interval. Similarly, for rehabilitation in the harsh treatment vignette, roughly two thirds of the scores are dispersed between 3.36 and 7.44. Although there are no absolute standards for determining whether or not a standard deviation is small or large, we consider this variation to be substantial. Table 8.9 also shows that, regardless of the specific criminal case, the goals of incapacitation and reparation evoke the most pronounced differences in opinion among Dutch judges. Furthermore, in comparison to the other vignettes, (absolute) preferences for goals of punishment vary the most in the reparation vignette.
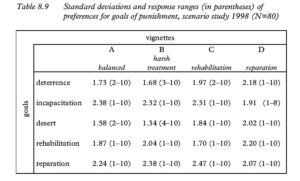
Table 8.9 Standard deviations and response ranges (in parentheses) of preferences for goals of punishment, scenario study 1998 (N=80)
Although the standard deviations in Table 8.9 might be considered to be substantial, judges’ preferences for goals of punishment in a specific criminal case could still be relatively similar, only differing in scale level. To examine this possibility, a different perspective on judges’ preferences is needed. For each of the cases in the study, judges were asked to rank order the three goals of punishment that they considered to be most important. The number and nature of different rankings should produce the additional information necessary for a more definitive evaluation of conditional proposition 1. The Tables in Appendix 3 show the rankings of the goals for the four types of vignettes.
For the balanced vignette, 41 percent of the judges find desert to be the most important goal of punishment (first in rank order), 20 percent find rehabilitation most important, 19 percent deterrence, 14 percent reparation and 6 percent incapacitation. While 74 percent has included desert among the three most important goals in the balanced vignette, 26 percent has not.
Preferences for goals in the harsh treatment vignette show less diversity. Desert is rated most important by 48 percent of the judges, both deterrence and incapacitation by 21 percent. Reparation is found most important by 6 percent of respondents and rehabilitation by only 4 percent. However, 35 percent of the judges have included rehabilitation as their second or third most important goal. While the goals of punishment associated with harsh treatment are clearly found to be dominant in the harsh treatment vignette, substantial differences between judges still exist regarding the relative importance of these goals.
In the rehabilitation vignette, 46 percent of respondents rank rehabilitation as most important goal of punishment. Desert is selected as the primary goal by 23 percent, reparation by 19 percent, deterrence 11 percent and incapacitation by only 1 percent. While 65 percent of the judges therefore aim primarily for one of the socially constructive goals of punishment (rehabilitation or reparation), no less than 35 percent choose one of the goals associated with harsh treatment.
In the reparation vignette, 53 percent of the judges find reparation to be the most important goal of punishment. Desert is selected as the primary goal by 26 percent, deterrence by 12 percent, rehabilitation by 6 percent and incapacitation by 4 percent. Thirteen percent of the judges do not mention reparation as one of the three most important goals that they associate with this vignette.
Evaluation of conditional proposition 1
Preferences for goals of punishment in the specified criminal cases have been examined in order to determine whether or not judges share a common vision of the aims of punishment related to these cases. Inspection of the Tables in Appendix 3 and the summarising statistics just presented reflect the central tendencies previously reported through the average preferences. However, the magnitude of the variation in preferences per goal of punishment in conjunction with the nature and number of substantively different preferences pertaining to the same criminal cases lead us to the following evaluation (E) of conditional proposition 1:
E1. There is no commonly shared vision among Dutch judges on the goals of punishment that apply to these specific cases.
What comes closest to a commonly shared vision is found in the harsh treatment vignette. With few exceptions, judges aim primarily for desert, incapacitation or deterrence for this case. Disregarding differences in the relative importance attached to these harsh treatment goals, this type of criminal case elicits general agreement regarding the type of treatment: harsh instead of socially constructive.
The four cases employed in the scenario study are all aggravated robbery cases. Caution should therefore be exercised in generalising the findings to other types of criminal cases. However, having said this, we do not expect a commonly shared vision on the goals of punishment to exist for all other types of crimes.
8.5 Sanctions
In the previous section, profiles of the four robbery cases (basic vignettes) have been examined in terms of preferences for goals of punishment. Also, the nature and magnitude of differences in opinion between judges were explored in order to evaluate conditional proposition 1. The present section focuses on the sanctions that judges found most fitting in each of the criminal cases, thus serving as an evaluation of conditional proposition 2:
P2. If personal characteristics of judges play a significant role in sentencing, substantial differences are expected between judges’ sentencing decisions with regard to the same cases.
Before examining sentencing decisions in the scenario study in detail, the types of differences in sentencing that may be distinguished should first be specified. Clancy et al. (1981) distinguish two general types of disparity in sentencing: interjudge and intrajudge disparity. The first type occurs when there is dissension among judges over identical cases. The second type occurs when a given judge is unstable over time in his sentencing decisions with regard to ‘identical’ cases. Our concern here is with the first type of disparity. With respect to interjudge disparity, three general types of variation in sentencing decisions can be distinguished. The first is the variation in choice of principal punishments (i.e. prison, community service, fine). The second is the variation in choice of (additional) special conditions and measures (i.e. damage compensation, skills or deficiencies training, probation supervision). In the literature little attention is paid to this second type of variation. Although variation in sentencing due to differences in the use of special conditions may not be interpreted as variation in a formal judicial sense, it may, nevertheless, be of the utmost significance to both victims (e.g. compensation or restitution) and offenders (e.g. probation supervision, training programmes). These first two types of variation involve the choice of sanction-type and components of the sentence while the third type concerns the severity (or quantity) of the sanctions.
As described in Section 7.5, judges were able to select their sentences without any restrictions being imposed by the researcher. These written sentences were subsequently coded by the researcher. Quantification of the sentencing decisions was quite easy and straightforward.[v] The coding scheme that was employed is displayed in Appendix 2 with three examples for coding of sentences.
Table 8.10 through Table 8.13 show the principal punishments, measures and special conditions chosen for each of the criminal cases in the scenario study. The tables report percentages of judges who opt for a particular sanction or special condition (columns) as well as all combinations of sanctions and special conditions selected (rows) for the specific criminal cases. While these tables provide details relating to the first two types of variation in sentencing, variations in severity per component of the sentence (the third type of variation) have also been examined. For each component of the sentencing decision Table 8.14 reports measures of central tendency. As such, the table shows differences in sentencing severity between judges in each of the vignettes. [August, 2, 2016 – We are working on Table 8.10 through 8.13]
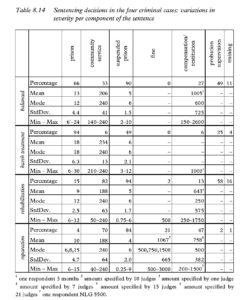
Table 8.14 Sentencing decisions in the four criminal cases: variations in severity per component of the sentence
The balanced vignette
Principal punishments
In the balanced vignette (Table 8.10) choices for principal punishments (prison, community service, fine) show a substantial partitioning of judges into two groups. While two thirds of Dutch judges prefer an unconditional prison sentence, the other 33 percent prefer a community service order. Although community service is formally linked to the prison sentence, they are quite different types of punishment (De Keijser, 1996; Jackson, De Keijser, & Michon, 1995).[vi] Most judges (90%) also specify a suspended prison term. Almost three quarters of these judges mention one or more special conditions with the suspended prison term.
Combinations with measures and special conditions
Combinations of principal punishments with measures and special conditions, the second type of variation, show a further differentiation in sentencing decisions. For almost two thirds of the judges, the sentence includes either compensation, probation supervision, training programme or a combination of these components. Half of the judges specify probation supervision in their sentence and more than a quarter mention damage compensation (either as a measure or as a special condition). Furthermore, just over 10 percent choose skills- or deficiencies training as a special condition. Table 8.10 shows that (the nature of) the combinations of these add-on components with principal punishments vary substantially.
Three specific sentencing decisions in the balanced vignette constitute the choice of almost half of the judges. One fifth of the judges see an unconditional prison term combined with a suspended prison term as the most fitting sentence. An equal number of judges add probation supervision (as a special condition) to this choice. The third major combination is
community service with a suspended sentence and probation supervision (10%).
Severity
Inspection of differences in severity per component of the sentence, the third type of variation, further refines the view of variation in sentencing decisions. While two thirds of the judges agree upon an unconditional prison term, they vary substantively in level of severity on this principal punishment (see Table 8.14). Unconditional prison terms in the balanced vignette range from 6 up to 24 months (Mean 13; SD 4.4). Community service orders (33%), on the other hand, vary less spectacularly. These range from 140 up to the maximum of 240 hours. The maximum is equal to the mode and is preferred by 54 percent. Suspended prison sentences vary between 2 and 10 months while 59 percent of these sentences is set at 6 months (mode). Damage compensation, either as a measure or as a special condition, ranges from NLG 150 to NLG 2600. More than half of the judges who mentioned damage compensation in their sentence do not specify an amount. Obviously, without detailed damage specification and without the victim joining the criminal procedure, judges find it hard to make concrete assessments of damage compensation.
The harsh treatment vignette
Principal punishments
In section 8.4 it was shown that there is wide agreement among Dutch judges concerning the type of treatment for the offender in the harsh treatment vignette. The goals of punishment that are generally associated with harsh treatment are clearly found to be the most important for the majority of judges. Indeed, as Table 8.11 shows, harsh treatment is what
this particular offender receives. No less than 94 percent of the judges prefer an unconditional prison sentence while the remaining few specify a community service order. Half of the judges specify a suspended prison term.
Combinations with measures and special conditions
There is no substantial disagreement between judges in relation to the type of sanction and combination of sanctions with special conditions. Eightysix percent either prefer a simple unconditional prison term (49%), or an unconditional prison term with a suspended sentence (20%), or unconditional prison with a suspended sentence and probation supervision (17%). Few judges make use of the suspended prison term to specify compensation or skills- or deficiencies training as a special condition.
Severity
The first two types of variation in sentencing decisions in the harsh treatment vignette are to a large extent absent in the harsh treatment vignette. However, the third type of variation, variation in severity, does show substantial differences in sentence length. While all but five judges specify an unconditional prison term, the length of the term varies between 6 and 30 months (Mean 18; SD 6.3).
The rehabilitation vignette
Principal punishments
In the rehabilitation vignette (Table 8.12) community service seems to be the obvious choice for most judges (82%). Even so, 15 percent still prefer an unconditional prison sentence in this case. Almost all of the judges (94%) specify a suspended prison term and most of these are combined with special conditions.
Combinations with measures and special conditions
As in the balanced vignette, combinations of principal punishments with special conditions further differentiate the sentences substantially. The combinations in this case, however, do not vary as widely as they do in the balanced case. Probation supervision is the most frequently specified special condition (58%). However, compensation and training programmes are also frequently selected (13% and 16% respectively) in combination with probation supervision. The most common sentences in this case are community service combined with a suspended prison term (25%), community service with suspended prison and probation supervision (30%) and community service with suspended prison, probation supervision and skills- or deficiencies training (11%). As such, sentencing decisions in this vignette are somewhat less diverse than in the balanced vignette.
Severity
In this case 82 percent of the judges preferred a community service order. The number of hours specified varies from 50 up to the maximum of 240 hours. Although the majority (54%) of these judges preferred the maximum number of hours, one fifth specified a community service order of 120 hours or less, while a quarter chose 140 to 180 hours. The same type of distribution characterises the choice of unconditional prison terms.
The reparation vignette
Principal punishments
In the reparation vignette, only a few judges specified an unconditional prison term. Seventy percent preferred a community service order (see Table 8.13). Over a quarter of the judges neither sentenced the offender to an unconditional prison term nor to perform community service. Instead, they predominantly sentenced the offender to a fine. This vignette constitutes the only case where a fine is preferred by a substantial number of the judges (21%).
Combinations with measures and special conditions
The only add-on component that is considered seriously by the judges in this case is damage compensation (47%), either as a measure or as a special condition with a suspended sentence. Most variation in components of the sentencing decisions is caused by the choice for principal punishments (community service versus fine), yes or no, combined with
damage compensation. Two sentences describe almost 60 percent of the choices made: 29 procent specify community service with a suspended prison term while an equal number of judges add damage compensation to that particular sentence.
Severity
As in the previous vignettes, variation in severity is substantial in the reparation vignette. While half of the judges who specify a community service order apply the maximum of 240 hours, the other half are evenly dispersed between 40 and 210 hours. The fines range from NLG 500 to NLG 3000. Damage compensation (amount is specified by more than half
of the judges who opt for this component) ranges from NLG 200 to NLG 1500 (Mean 758; SD 382).
Evaluation of conditional proposition 2
Three types of variation in sentencing have been considered: variation in choice of principal punishment(s), variation in combinations of principal punishments with measures and special conditions and variation in sentence severity. The sentences in the study involved the same criminal cases. Any differences in sentencing decisions per vignette must therefore lie in judges’ personal interpretation of characteristics incorporated in these cases, their personal views on punishment, or an interaction between the two (cf. Hogarth, 1971).
As with the preferred goals of punishment (see section 8.4), the most serious case in the scenario study, the harsh treatment vignette, elicits general agreement concerning the type of treatment: harsh treatment, i.e., unconditional imprisonment. While the type of treatment appears to be undisputed among judges, the severity of the prison term varies widely. The other vignettes, in contrast, elicit much more variation in type of sanction and combinations of principal punishments with measures and special conditions. While the offences portrayed in the balanced vignette, the rehabilitation vignette and the reparation vignette are by law serious enough to merit an unconditional prison sentence, the difference with the harsh treatment vignette lies in the presence of pointers for a more socially constructive perspective on treatment (i.e., rehabilitative and/or reparative). It is, therefore, important to note that different types of cases with different types of offenders elicit different types of variation in sentencing. After reviewing the sentencing decisions in each of the criminal cases in the scenario study, it must be concluded that variation in sentencing decisions in type of sentence as well as severity of the sentence is quite substantial. This leads to the following evaluation of conditional proposition 2:
E2. Personal characteristics of judges play a significant role in sentencing.
The scope of this evaluation needs some further qualification. Although personal characteristics of judges have been shown to play a significant role in their sentencing decisions, it would be incorrect to project the scale of variation shown in an experimental setting onto real-life court cases. In Chapter 5, a number of influences and constraints that level judges’ sentencing decisions were discussed. In the scenario study, such influences and constraints were absent. For example, in the vignettes there was no mention of the punishment requested by a public prosecutor, nor was there any deliberation in chambers with colleague-judges. In practice, despite the influence of such mechanisms, variation in sentencing nevertheless remains (see section 5.4). Although part of that variation may be due in practice to differences between cases in specific characteristics of offence and offender (‘no criminal case is exactly the same’), we have shown that differences persist even for identical cases. Furthermore, differences of opinion between judges may even influence some of the levelling mechanisms themselves. They may, for instance, seriously impair acceptance and consistent application of non-binding sentencing directives (cf. De Keijser, 1999).
Personal characteristics include a vast array of variables. The data do not allow a detailed analysis of all potentially relevant personal characteristics. Rather, from the outset, the focus has been on specific types of personal characteristic: penal attitudes in general and preferences for goals of punishment in specific criminal cases. Up until now, penal attitudes, preferences for goals of punishment and sentencing decisions in specific cases have been analysed independently. In the next sections they are analysed simultaneously. Relevance and consistency of these particular personal characteristics for sentencing decisions in the specified criminal cases are explored.
8.6 Goals of punishment and sanctions: consistency and relevance
In the previous sections preferences for goals of punishment and sentencing decisions have been examined in detail per vignette. Between the vignettes, distinct patterns have been shown to exist in both sets of variables. Underlying these distinct patterns, however, there is substantial variation among judges. While the analyses have focused on goals of punishment and sentencing decisions separately, this section considers patterns of association between both sets of variables. By analysing them simultaneously, consistency and relevance of goals of punishment are determined in the light of sentencing decisions per criminal case in the scenario study. As such, results of these analysis are used to evaluate conditional proposition 3:
P3. If preferred goals of punishment are relevant for choosing a particular sentence, or if a particular sentence is consistently rationalised by a preferred goal (or combination of goals), clear and consistent patterns of association are expected between goals of punishment and sanctions in individual cases.
Since a sentencing decision is generally a composite which includes more components than simply a principal punishment specified, considering variation within separate components of a sentence cannot do justice to the true variation in sentencing decisions. In other words, analysing components of a sentence separately may produce results which are unrealistic and perhaps too optimistic in view of sentencing decisions considered as composites. To increase utility and validity, sentencing models should incorporate multiple sentencing outcomes (Blumstein, Cohen, Martin, & Tonry, 1983; Mears, 1998).
To be able to analyse patterns of association between goals of punishment and multiple sentencing outcomes in an integrated manner, canonical correlation analysis was selected as being the most appropriate technique. Canonical correlation analysis may be used when each subject is measured on two sets of variables and one is interested in how these two sets relate to each other. In the scenario study, the two sets of variables per vignette are goals of punishment on the one hand, and components of the sentencing decision on the other. Canonical correlation analysis proceeds to maximise the relationship(s) between two sets of variables (Tabachnick & Fidell, 1996). If one is interested in screening for patterns of association, canonical correlation analysis is most likely to reveal them. Other techniques, such as structural equations models would require modelling particular patterns of association in advance which, in this case, is not the objective. Appendix 4 elaborates in more detail on relevant technical aspects of the application of canonical correlation analysis in the scenario study. [vii]
Table 8.15 shows the results of the canonical correlation analyses with the goals of punishment and sentencing decisions for each of the four basic vignettes in the scenario study. For every vignette two models which differ in the way that the variables in the set of sentence components were coded have been explored.[viii] Per model, sentence components were either employed as interval or as dichotomous variables. Furthermore the choice of coding depended on the number of judges specifying a particular sanction or special condition and the distribution in terms of severity (see Tables 8.10 through 8.14). Fine, compensation, probation supervision and training were always employed as dichotomous variables in the models.[ix]
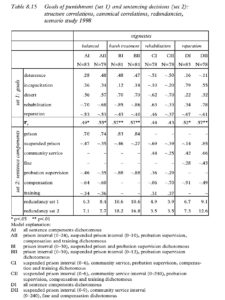
Table 8.15 Goals of punishment (set 1) and sentencing decisions (set 2): structure correlations, canonical correlations, redundancies, scenario study 1998
Balanced vignette
As discussed earlier, unsuspended prison and community service are mutually exclusive in sentencing (i.e., community service can only be applied to substitute for an unsuspended prison term). Since all but one judge in the balanced vignette specified either an unsuspended prison term or community service, analyses including only the unsuspended prison sentence are reported for this vignette in Table 8.15. Results with respect to prison as a sentence component also provide information (but in an opposite direction) for community service.
For both models in the balanced vignette only the first pair of canonical variates is significantly correlated and reported. The shared variance of the canonical variates (rc2) is 24 percent for the model with all sentence components as binary variables and 30 percent when prison and suspended prison are employed as interval variables. Interpretation with the structure correlations is quite straightforward and similar for both models. The goals of punishment and sentence components appear to be associated according to the harsh treatment versus socially constructive perspectives. Judges with high scores for harsh treatment goals (deterrence, incapacitation and desert) and low scores for socially constructive goals (rehabilitation and reparation) prefer unconditional imprisonment. Conversely, preferences for the socially constructive goals, especially for rehabilitation, are positively associated with community service (i.e., not imprisonment), suspended prison, probation supervision, compensation and training. The strongest relation is between a judge’s score for rehabilitation and his or her choice between imprisonment and community service (model AI). Furthermore, length of the prison term increases with decreasing scores for rehabilitation (model AII).
Although the reported canonical correlations are statistically significant and the patterns of association are clearly interpretable and meaningful, inspection of redundancies reveals a less optimistic picture. If preferences for the goals of punishment are viewed as rationalisations of sentencing decisions, in model AII only 8.4 percent of the variance in the set of goal variables can be accounted for by the canonical variate of the sentence components. On the other hand, if preferences for goals of punishment are assumed to be relevant for reaching a sentencing decision, only 7.7 percent of the variance in sentencing decisions can be accounted for by the variate representing the goals of punishment. Either way, considering redundancies, more than 90 percent of the variance in both sets of variables remains unaccounted for.Although the reported canonical correlations are statistically significant and the patterns of association are clearly interpretable and meaningful, inspection of redundancies reveals a less optimistic picture. If preferences for the goals of punishment are viewed as rationalisations of sentencing decisions, in model AII only 8.4 percent of the variance in the set of goal variables can be accounted for by the canonical variate of the sentence components. On the other hand, if preferences for goals of punishment are assumed to be relevant for reaching a sentencing decision, only 7.7 percent of the variance in sentencing decisions can be accounted for by the variate representing the goals of punishment. Either way, considering redundancies, more than 90 percent of the variance in both sets of variables remains
unaccounted for.
Harsh treatment vignette
In section 8.5, it has been shown that in contrast to the other vignettes, the harsh treatment vignette revealed relatively little disagreement among Dutch judges regarding the type of sentence. All but five judges opted for an unconditional prison sentence in this criminal case, with or without the use of suspended prison or probation supervision. Severity of the prison sentence in this criminal case, however, varied widely.
Canonical correlations for both models (BI and BII) indicate more than 32 percent overlapping variance between canonical variates. Interpretation of the structure correlations does not differ between the models and is similar to the interpretation presented for the balanced vignette. While almost all judges have specified an unconditional prison term, the length of the prison term is negatively associated with higher scores for rehabilitation. Furthermore, judges with relatively high scores for rehabilitation tend to make additional use of suspended prison and, especially, probation supervision while desert is negatively associated with these add-on components. Redundancies are higher in the harsh treatment vignette than in the other vignettes. For instance, the amount of variance that the canonical variate of the goals extracts from the set of sentence components is 18.2 percent in model BI and 16.8 percent in model BII. However, this still leaves a substantial amount of variance in sentencing decisions unaccounted for in this vignette.
Rehabilitation vignette
Canonical correlations for both models are lower than in the other vignettes. Moreover, these correlations turned out not to be statistically significant. This renders interpretation with the structure correlations a tenuous and risky matter. In model CI, the set of goals show the same contrasts as in the balanced and harsh treatment vignettes and preferences for these goals appear to be associated with the choice for prison or community service in the expected manner. The structure correlation of suspended prison, however, is much more difficult to interpret in the light of the goals of punishment. Considering model CII, structure correlations appear extremely difficult to interpret. Moreover, redundancies indicate negligible portions of variance accounted for in both sets of variables. It must therefore be concluded that in the rehabilitation vignette no consistent patterns of association between goals of punishment and sentencing decisions could be shown.
Reparation vignette
In the reparation vignette, in contrast to the other vignettes, not specifying a community service order does not imply unsuspended prison. While 70 percent of the judges sentenced the offender to community service, only four judges from the remaining 30 percent specified an unconditional prison term (see Table 8.13). This may help to explain why both models show that harsh treatment goals and rehabilitation are not necessarily considered conflicting in the light of sentencing decisions. The choice for and severity of community service and suspended prison are positively associated with higher scores on harsh treatment goals (with the exception of deterrence) as well as rehabilitation. Simultaneously, concern for reparation tends to conflict with suspended prison and community service and is positively related to compensation and fine. In other words, judges with relatively high scores for rehabilitation and relatively low scores for reparation prefer harsher community service orders and longer suspended prison terms while they tend not to include compensation or fine in their sentence.
These judges are also more concerned with harsh treatment (mainly incapacitation) as an element in sentencing. Apparently, in a criminal case with characteristics of the offence and the offender as portrayed in the reparation vignette, the socially constructive goals of rehabilitation and reparation may be conflicting in considering type and severity of the sentence. Considering community service this finding is striking. At least in the restorative justice literature, community service is believed to accommodate both reparation and rehabilitation, although rehabilitation is not a primary aim (see Sections 2.7 and 7.6).
As with the previous vignettes, inspection of redundancies places these findings in a different perspective. At best, 12.6 percent of the variance in sentencing decisions may be accounted for by the variate representing the goals of punishment (model DII). While canonical correlations are significant and the pattern of association between the set of goals and sentence components do not pose problems of interpretation, these patterns only apply to a small portion of the variance that is actually shared between the two sets of variables.
Evaluation of conditional proposition 3
Per vignette, substantial variation both in preferences for goals of punishment and in sentencing decisions have been shown to exist in previous sections. If the variation in both sets of variables were linked in a consistent and substantial manner, results of the analyses just discussed would certainly have shown this. In the rehabilitation vignette, no significant patterns of association were found whatsoever. In the balanced vignette, the harsh treatment vignette and the reparation vignette, each analysis resulted in only one pair of significant and interpretable canonical variates.[x] Since sentencing was only related to the goal variables, considerable portions of unexplained variance were expected (see section 7.3).[xi]
Reported redundancies, however, showed the portions of variance in both sets of variables that remain unaccounted for to be too large to justify a favourable evaluation of conditional proposition 3. Thus, although in three of the four vignettes a rudimentary ‘sense of direction’ concerning the relation between goals of punishment and sentencing was apparent, results lead us to the following evaluation of conditional proposition 3:
E3. Preferences for goals of punishment are not very relevant for choosing a particular sentence. Conversely, sentencing decisions are not consistently rationalised by goals of punishment.
One might be tempted to blame this lack of consistency between goals of punishment and sentencing decisions on judges having different conceptions of goals of punishment (cf. Enschedé, Moor-Smeets, & Swart, 1975; Van der Kaaden & Steenhuis, 1976). However, it is not very likely that this factor underlies the current findings. To prevent any such misconceptions, all judges in the scenario study were presented with concise and clear definitions of the goals of punishment (see Section 7.5). Furthermore, in Chapter 6 it has been shown that even at the abstract and case- independent level, the relevant (theoretical) concepts can be measured in a consistent and valid manner. In short, Dutch judges certainly comprehend the meaning of the various goals and perspectives of punishment. Moreover, there is no reason to believe that judges in the scenario study did not reach their sentencing decisions in a deliberated and well-considered manner. Even though judges differ both in preferences for goals of punishment and in sentencing decisions with respect to identical criminal cases, consistent and substantial patterns of association between both sets of variables might still be expected. This expectation, however, has proven to be untenable. While judges might try to be consistent within themselves (cf. Hogarth, 1971), the very nature of ‘consistency’ between goals of punishment and sentencing differs substantially between Dutch judges.
8.7 Penal attitudes and goals of punishment: consistency and relevance
In this section Dutch judges’ penal attitudes as measured and discussed in Chapter 6 are related to their preferences for the goals of punishment in considering the four vignettes in the scenario study. The objective is to determine whether or not the personal penal attitudes held by judges are relevant for the goals of punishment they pursue in specific criminal cases. As such, results are used to evaluate conditional proposition 4: P4. If judges’ general penal attitudes influence their preferences for particular goals of punishment in individual cases, clear and consistent patterns of association are expected between general penal attitudes and goals of punishment in individual cases. The general structure of penal attitudes which was examined in Chapter 6, indicated a pragmatic approach to the functions and goals of punishment.
We therefore expected personal (abstract) penal attitudes to be relevant in specific criminal cases only if pointers that evoke the range of goals of punishment are equally present in a case. In such cases, penal attitudes would be employed as tie-breakers. In other cases, where pointers for particular goals are relatively prominent, individual penal attitudes would be irrelevant (see Chapter 7). Conditional proposition 4 was therefore split in two sub-propositions:
P4a. If pointers that evoke a particular goal of punishment are relatively prominent in a specific case, penal attitudes should not be expected to be very relevant for the preferred goals of punishment for that specific case.
P4b. If pointers that evoke the range of goals of punishment are equally present in a specific case, judges employ their personal penal attitudes as tie-breakers. Penal attitudes are expected to be relevant for the preferred goals of punishment for that case.
The evaluation of these conditional propositions was to be accomplished by comparing findings from the balanced vignette (equal pointers for the goals of punishment) with the other three vignettes (pointers for some goals relatively prominent). Before presenting and interpreting the findings, it should be reiterated that, as was shown in Section 8.4, we have only partially succeeded in creating a truly balanced vignette.
In determining the relevance of penal attitudes for preferred goals of punishment in the selected criminal cases, it is assumed that judges’ penal attitudes have remained relatively stable over the time span of one year between the penal attitude study and the scenario study.[xii] Data from both studies have been matched using background variables such as age, experience, gender, court and previous employment which were recorded in both studies. Data from two of the 84 judges from the scenario study could not be matched with the penal attitude data.
While Section 8.6 considered patterns of association between goals of punishment and sentencing decisions, this section involves patterns of association between penal attitudes and goals of punishment. Therefore the same type of analysis, i.e., canonical correlation analysis, was appropriate.
Two models have been analysed for each vignette. In the first model (I) the five scales representing attitudes toward Deterrence, Incapacitation, Desert, Rehabilitation and Restorative Justice were employed (see Chapter 6). In the second model (II) the set of five penal attitude scales has been reduced to (or, rather, summarised in) the two underlying perspectives of harsh treatment and social constructiveness. This reduction was achieved through principal components analysis with oblique rotation of the components. The first component represents Deterrence, Desert and Incapacitation (i.e., harsh treatment). The second component represents Rehabilitation and Reparation (i.e., socially constructive).[xiii] The attitude scale ‘Moral Balance’ was excluded from these analyses. Only the five penal attitude scales that clearly implicated the goals of punishment to be employed in the scenario study have been included in these canonical correlation analyses.[xiv]
Table 8.16 shows the results of the analyses with the penal attitude scales and goals of punishment for the four vignettes in the scenario study. The table shows none of the canonical correlation coefficients to be statistically significant with the exception of model II in the rehabilitation vignette.15 While more of these coefficients would have been statistically significant with greater sample size, reported redundancies show the penal attitudes not to be relevant for preferred goals of punishment in the scenario study. The variance in goals of punishment accounted for by the attitude variates never exceeds 4.5 percent.
Penal attitudes were not expected to be relevant in either the case of the harsh treatment vignette, the rehabilitation vignette or the reparation vignette. However, conditional proposition 4b stated the expectation that in the balanced vignette judges’ penal attitudes would indeed be relevant for their preferred goals of punishment. The variance in the goal set accounted for by the attitude variates in both models in the balanced vignette is as low as in the other vignettes. These findings lead to the following evaluation of conditional proposition 4:
E4. Judges’ general penal attitudes do not influence their preferences for goals of punishment in specific cases, even if pointers that evoke the range of goals of punishment are equally present in a specific case.
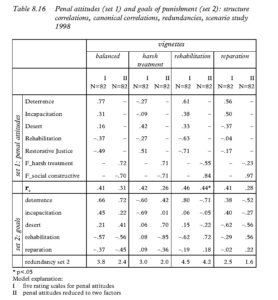
Table 8.16 Penal attitudes (set 1) and goals of punishment (set 2): structure correlations, canonical correlations, redundancies, scenario study 1998
8.8 Concise review of findings
It has been argued that examining the relevance of moral legal theory for the practice of punishment requires studying penal attitudes as well as punishment in action. Results from the scenario study (i.e., punishment in action) complete the examination of the underlying legitimising framework of punishment.
In the scenario study, criminal cases have been presented to Dutch judges in order to consider differences in both their preferences for the goals of punishment and their sentencing decisions. Furthermore, the study aimed at determining whether or not substantial and consistent patterns of association exist between goals and sentences and also the relevance of abstract penal attitudes for pursuing particular goals of punishment in specific cases.
Using analyses consistent with the Graeco-Latin square design of the study, it has been shown that, as intended, the different versions of the four basic vignettes were essentially the same. Examination of average scores for the goals of punishment revealed profiles of the basic vignettes that were consistent with the manipulations of pointers. Underlying these average scores, substantial variation between judges has been shown to exist in considering the goals of punishment for the same criminal case. In the harsh treatment vignette, where pointers for rehabilitation and reparation were minimal, preferences for the goals of punishment varied less than in the other vignettes. In this vignette, most judges at least agreed on the type of treatment: harsh treatment. On the whole, however, variation in preferred goals of punishment was substantial enough to merit the conclusion that there is no commonly shared view among Dutch judges on the goals of punishment as they apply to specific cases (E1).
Regarding the sentences per vignette, different types of variation in sentencing have been considered: variation in choice of principal punishments, in the use of additional special conditions and measures and in severity. Overall, variation in sentencing with respect to the same criminal cases appeared to be considerable. It was shown that different types of cases with different types of offenders elicit different types of variation in sentencing. In the harsh treatment vignette, relatively little variation appeared in choice of principal punishment and special conditions. Severity of the prison term, however, varied widely between judges in this vignette. In the balanced vignette, on the other hand, the variation was predominantly apparent in choice of principal punishment as well as in the use of special conditions. Since all judges in the scenario study were presented with the same criminal cases, it was concluded that personal characteristics of judges play a significant role in sentencing (E2).
For the specific criminal cases in the scenario study, whether or not consistent patterns of association exist between preferences for goals of punishment and sentencing decisions was examined. Even with substantial variation in both sets of variables, consistent patterns of association might still be expected. Although the patterns of association that emerged from the analyses were readily interpretable, the variation that is actually shared between the preferences for goals and sentencing decisions turned out tobe minimal. Compared to the other vignettes, in the harsh treatment vignette preferences for the goals of punishment appeared to be most relevant for the sentencing decisions. Furthermore, the analyses revealed that, in so far as consistent patterns were shown, differences in preference for rehabilitation were especially relevant for differences in sentencing. Thus, although some sense of direction concerning the relation between goals of punishment and sentencing was apparent, it was concluded that judges’ preferences for goals of punishment are not very relevant for the choice of a particular sentence. Nor were sentencing decisions consistently rationalised by goals of punishment (E3).
Finally, the influence of judges’ penal attitudes on their preferred goals of punishment in specific cases has been examined. Penal attitudes were shown to be irrelevant for the goals which judges pursue in the selected cases. Although it was expected that penal attitudes would be employed as tie-breakers in the balanced vignette, where pointers for the range of goals were (about) equally present, this expectation proved untenable (E4). In the following and final chapter (Chapter 9), these results will be integrated in a concluding discussion on moral legal theory, legitimising frameworks and the practice of punishment.
NOTES
i. Unfortunately one judge was deceased.
ii. Interaction effects are not available for analysis when data are collected according to a Graeco-Latin square design because, in such a design, effects are not fully crossed (Swanborn, 1987; Tabachnick & Fidell, 1996).
iii. For the planned comparisons ‘Helmert’ contrasts have been employed.
iv. 4 In fact variance in average scores within the balanced vignette is roughly three times less than variance in average scores within the other three vignettes.
v. Operational periods of suspended sentences, if specified, have not been coded for analyses. ‘Probation supervision’ and ‘Skills or deficiencies training’ have been coded as simple dichotomous variables.
vi. Community service may only be imposed to substitute for an unconditional prison sentence with a maximum of six months. See section 5.3.
vii. For comprehensive discussions of canonical correlation analysis and its applications, see Thompson (1984), Stevens (1996) and Tabachnick and Fidell (1996).
viii. See Appendix 4.
ix. Concerning fine and compensation, there were too many judges not specifying an exact monetary amount to validly employ these variables at the interval level. Furthermore, in case of interval coding, the zero-category would be ‘unnaturally’ deviant.
x. If the sample size in this study had been considerably larger, subsequent pairs of canonical variates might have been statistically significant in some of the models. Inspection of added redundancies (not displayed) related to second pairs of variates, showed that this would lead to only marginal increases (1 to 3 percent) in total redundancy.
xi. This would be a caveat if the aim had been to create an explanatory model of sentencing disparity (cf. Palys & Divorsky, 1986; Lemon & Bond, 1987).
xii. In fact, it is quite common to assume that attitudes are relatively stable over time (cf. Oskamp, 1977).
xiii. Explained total variance in this two-component solution is 71 percent. Component correlation (after oblique rotation) is 0.07.
xiv. See Section 7.3. Analyses including the Moral Balance scale (not displayed) did not yield substantial increase in canonical correlations or redundancies.
xv. Bartlett’s V (18.48) exceeded the critical χ2 value (18.31; a=.05, df=10) by only .17.
You May Also Like
Comments
Leave a Reply
